

Part 2Data cut-off: October 4, 2026
When do dividend increases keep going?
Reading increase streaks and changes in profit, operating cash flow and cash
Companies that raised dividends in 2025
55.2%
The share fell into the 30% range in 2020–21, while cuts rose to about 20%. It has since returned to around half each year.
Share raising dividends (bars) and share cutting (line)
What this study found
- 20.7%
Share of companies that cut dividends in 2021 — two to three times other years (6.5–10.9%).
- 77.5%
Share of companies with 3+ consecutive increases that raised again the next year (62.0% after a single increase).
- 21.8%
Share that cut dividends the year after net income fell 30% or more (11.5% when it rose or held flat).
Study basisJapanese stocks: 4,096 companies in Stock Club, those comparable with the prior year, 2018–2025, data cut-off October 4, 2026
What do companies that keep raising their dividends have in common? Using recorded actuals for Japanese stocks, we look separately at yearly dividend outcomes, the number of consecutive increases, and changes in profit, operating cash flow and cash.
We compare actual annual total dividends of Japanese stocks, including special and commemorative payments. Yearly results cover 2018–2025; next-year outcomes look back from base years 2019–2024. One company in one financial year counts as one “company-year”; the same company in another year counts again.
Data cut-off: October 4, 2026. Japanese stocks, annual dividends recorded by Stock Club.
1. How much does the share of companies raising dividends change by year?
The share raising dividends fell into the 30% range in 2020–21 and then returned to around half. Cuts reached about 20% in those two years only, well above other years (6.5–10.9%).
Figure 1: Dividend outcomes among all companies comparable in each year (2018–2025)
Sample: 2,503–3,461 companies, fiscal years 2018–2025
Among all companies comparable in each year, 2020 (2,959 companies) showed 32.8% increases and 19.5% cuts, while 2025 (3,461 companies) showed 55.2% increases and 6.5% cuts.
Data and notessample, counts, method and caveats
We start with the 4,096 companies recorded as common stocks in Stock Club as of October 4, 2026, and select companies whose annual actual dividends can be compared with the prior year at the same FY-end month. Forecasts, missing values, unverified split adjustments and irregular financial periods are excluded; confirmed zero dividends are included. Companies are not selected for having raised dividends.
Selection: 4,096 recorded companies → 3,839 with financial records for 2017–2025 → 3,737 with at least one comparable annual dividend → 2,177 comparable with the prior year in all eight years. Comparing 2018 also needs 2017 dividends, so the last group requires nine years of data.
The two charts below show all companies comparable in each year (2,503–3,461, depending on the year) and the 2,177 companies with data for all eight years. Because the companies and denominators differ, shares do not match even in the same year.
Figure 2: Dividend outcomes among the 2,177 companies with data for all eight years
Sample: the same 2,177 companies with data for all 8 years, 2018–2025
The same 2,177 companies, comparable with the prior year in every year from 2018 to 2025, counted each year. Requiring nine years of data favors long-listed companies with complete records. Source: actuals recorded by Stock Club.
With the same companies every year, increases still rose from 32.3% in 2020 to 57.9% in 2025, and cuts fell from 20.3% to 6.8%. Neither chart represents the whole market at the time.
Among companies comparable in each year with positive net profit in both years, the 2020 median change in net profit was −38.4% for companies that cut and +6.2% for those that raised. This is a same-year relationship, not a forecast of the following year.
Figure notes
By financial year (calendar year of the FY end), counting all companies comparable with the prior year. The number and mix of companies change each year. The right-hand figures show the share of cuts. Source: actuals recorded by Stock Club.
Show values and sample sizes
2,177 with all eight years
- Financial year
- 2018
- n
- 2,177
- Increase
- 1,009 / 2,177 (46.3%)
- Unchanged
- 673 / 2,177 (30.9%)
- Cut (incl. to zero)
- 181 / 2,177 (8.3%)
- Start / resume
- 40 / 2,177 (1.8%)
- Remain zero
- 274 / 2,177 (12.6%)
2,177 with all eight years
- Financial year
- 2019
- n
- 2,177
- Increase
- 927 / 2,177 (42.6%)
- Unchanged
- 711 / 2,177 (32.7%)
- Cut (incl. to zero)
- 237 / 2,177 (10.9%)
- Start / resume
- 31 / 2,177 (1.4%)
- Remain zero
- 271 / 2,177 (12.4%)
2,177 with all eight years
- Financial year
- 2020
- n
- 2,177
- Increase
- 703 / 2,177 (32.3%)
- Unchanged
- 732 / 2,177 (33.6%)
- Cut (incl. to zero)
- 441 / 2,177 (20.3%)
- Start / resume
- 29 / 2,177 (1.3%)
- Remain zero
- 272 / 2,177 (12.5%)
2,177 with all eight years
- Financial year
- 2021
- n
- 2,177
- Increase
- 742 / 2,177 (34.1%)
- Unchanged
- 627 / 2,177 (28.8%)
- Cut (incl. to zero)
- 456 / 2,177 (20.9%)
- Start / resume
- 55 / 2,177 (2.5%)
- Remain zero
- 297 / 2,177 (13.6%)
2,177 with all eight years
- Financial year
- 2022
- n
- 2,177
- Increase
- 1,072 / 2,177 (49.2%)
- Unchanged
- 551 / 2,177 (25.3%)
- Cut (incl. to zero)
- 174 / 2,177 (8.0%)
- Start / resume
- 87 / 2,177 (4.0%)
- Remain zero
- 293 / 2,177 (13.5%)
2,177 with all eight years
- Financial year
- 2023
- n
- 2,177
- Increase
- 1,077 / 2,177 (49.5%)
- Unchanged
- 575 / 2,177 (26.4%)
- Cut (incl. to zero)
- 211 / 2,177 (9.7%)
- Start / resume
- 43 / 2,177 (2.0%)
- Remain zero
- 271 / 2,177 (12.4%)
2,177 with all eight years
- Financial year
- 2024
- n
- 2,177
- Increase
- 1,184 / 2,177 (54.4%)
- Unchanged
- 496 / 2,177 (22.8%)
- Cut (incl. to zero)
- 186 / 2,177 (8.5%)
- Start / resume
- 64 / 2,177 (2.9%)
- Remain zero
- 247 / 2,177 (11.3%)
2,177 with all eight years
- Financial year
- 2025
- n
- 2,177
- Increase
- 1,261 / 2,177 (57.9%)
- Unchanged
- 503 / 2,177 (23.1%)
- Cut (incl. to zero)
- 147 / 2,177 (6.8%)
- Start / resume
- 31 / 2,177 (1.4%)
- Remain zero
- 235 / 2,177 (10.8%)
All comparable that year
- Financial year
- 2018
- n
- 2,503
- Increase
- 1,192 / 2,503 (47.6%)
- Unchanged
- 757 / 2,503 (30.2%)
- Cut (incl. to zero)
- 203 / 2,503 (8.1%)
- Start / resume
- 44 / 2,503 (1.8%)
- Remain zero
- 307 / 2,503 (12.3%)
All comparable that year
- Financial year
- 2019
- n
- 2,610
- Increase
- 1,129 / 2,610 (43.3%)
- Unchanged
- 822 / 2,610 (31.5%)
- Cut (incl. to zero)
- 285 / 2,610 (10.9%)
- Start / resume
- 40 / 2,610 (1.5%)
- Remain zero
- 334 / 2,610 (12.8%)
All comparable that year
- Financial year
- 2020
- n
- 2,959
- Increase
- 972 / 2,959 (32.8%)
- Unchanged
- 980 / 2,959 (33.1%)
- Cut (incl. to zero)
- 577 / 2,959 (19.5%)
- Start / resume
- 41 / 2,959 (1.4%)
- Remain zero
- 389 / 2,959 (13.1%)
All comparable that year
- Financial year
- 2021
- n
- 3,080
- Increase
- 1,026 / 3,080 (33.3%)
- Unchanged
- 867 / 3,080 (28.1%)
- Cut (incl. to zero)
- 637 / 3,080 (20.7%)
- Start / resume
- 79 / 3,080 (2.6%)
- Remain zero
- 471 / 3,080 (15.3%)
All comparable that year
- Financial year
- 2022
- n
- 3,210
- Increase
- 1,583 / 3,210 (49.3%)
- Unchanged
- 737 / 3,210 (23.0%)
- Cut (incl. to zero)
- 241 / 3,210 (7.5%)
- Start / resume
- 125 / 3,210 (3.9%)
- Remain zero
- 524 / 3,210 (16.3%)
All comparable that year
- Financial year
- 2023
- n
- 3,359
- Increase
- 1,605 / 3,359 (47.8%)
- Unchanged
- 814 / 3,359 (24.2%)
- Cut (incl. to zero)
- 310 / 3,359 (9.2%)
- Start / resume
- 78 / 3,359 (2.3%)
- Remain zero
- 552 / 3,359 (16.4%)
All comparable that year
- Financial year
- 2024
- n
- 3,429
- Increase
- 1,788 / 3,429 (52.1%)
- Unchanged
- 713 / 3,429 (20.8%)
- Cut (incl. to zero)
- 269 / 3,429 (7.8%)
- Start / resume
- 107 / 3,429 (3.1%)
- Remain zero
- 552 / 3,429 (16.1%)
All comparable that year
- Financial year
- 2025
- n
- 3,461
- Increase
- 1,910 / 3,461 (55.2%)
- Unchanged
- 701 / 3,461 (20.3%)
- Cut (incl. to zero)
- 226 / 3,461 (6.5%)
- Start / resume
- 74 / 3,461 (2.1%)
- Remain zero
- 550 / 3,461 (15.9%)
2018
- Comparable
- 2,503
- Non-comparable periods
- 668
2019
- Comparable
- 2,610
- Non-comparable periods
- 665
2020
- Comparable
- 2,959
- Non-comparable periods
- 411
2021
- Comparable
- 3,080
- Non-comparable periods
- 389
2022
- Comparable
- 3,210
- Non-comparable periods
- 373
2023
- Comparable
- 3,359
- Non-comparable periods
- 331
2024
- Comparable
- 3,429
- Non-comparable periods
- 337
2025
- Comparable
- 3,461
- Non-comparable periods
- 379
Notes: net profit of raisers and cutters in the same year
A same-year comparison of all companies comparable that year, split by dividend outcome (separate from the 2,177-company group and next-year results). Medians use only companies with positive profit in both years; zero-or-below current values and missing prior values are excluded from growth rates.
2018
- Dividend
- Cut
- Total n
- 203
- With both years’ profit
- 124
- Current zero or below
- 36
- With growth rate
- 85
- Median
- -22.8%
2018
- Dividend
- Increase
- Total n
- 1,192
- With both years’ profit
- 738
- Current zero or below
- 7
- With growth rate
- 716
- Median
- +15.2%
2019
- Dividend
- Cut
- Total n
- 285
- With both years’ profit
- 161
- Current zero or below
- 35
- With growth rate
- 121
- Median
- -26.6%
2019
- Dividend
- Increase
- Total n
- 1,129
- With both years’ profit
- 681
- Current zero or below
- 6
- With growth rate
- 664
- Median
- +12.4%
2020
- Dividend
- Cut
- Total n
- 577
- With both years’ profit
- 334
- Current zero or below
- 114
- With growth rate
- 213
- Median
- -38.4%
2020
- Dividend
- Increase
- Total n
- 972
- With both years’ profit
- 607
- Current zero or below
- 8
- With growth rate
- 587
- Median
- +6.2%
2021
- Dividend
- Cut
- Total n
- 637
- With both years’ profit
- 369
- Current zero or below
- 136
- With growth rate
- 222
- Median
- -19.6%
2021
- Dividend
- Increase
- Total n
- 1,026
- With both years’ profit
- 603
- Current zero or below
- 5
- With growth rate
- 559
- Median
- +32.2%
2022
- Dividend
- Cut
- Total n
- 241
- With both years’ profit
- 129
- Current zero or below
- 34
- With growth rate
- 91
- Median
- -23.1%
2022
- Dividend
- Increase
- Total n
- 1,583
- With both years’ profit
- 926
- Current zero or below
- 17
- With growth rate
- 851
- Median
- +27.5%
2023
- Dividend
- Cut
- Total n
- 310
- With both years’ profit
- 195
- Current zero or below
- 68
- With growth rate
- 124
- Median
- -39.0%
2023
- Dividend
- Increase
- Total n
- 1,605
- With both years’ profit
- 943
- Current zero or below
- 20
- With growth rate
- 900
- Median
- +12.9%
2024
- Dividend
- Cut
- Total n
- 269
- With both years’ profit
- 171
- Current zero or below
- 45
- With growth rate
- 117
- Median
- -26.3%
2024
- Dividend
- Increase
- Total n
- 1,788
- With both years’ profit
- 1,026
- Current zero or below
- 18
- With growth rate
- 971
- Median
- +17.5%
2025
- Dividend
- Cut
- Total n
- 226
- With both years’ profit
- 136
- Current zero or below
- 44
- With growth rate
- 88
- Median
- -22.3%
2025
- Dividend
- Increase
- Total n
- 1,910
- With both years’ profit
- 1,113
- Current zero or below
- 21
- With growth rate
- 1,071
- Median
- +14.5%
2. Did longer increase streaks lead to another increase the next year?
The longer the streak, the more often the next year was another increase (62.0% after one, 68.7% after two, 77.5% after three or more). Even with three or more, next-year cuts ranged from 4.3% to 18.2% by year.
Figure 3: Next-year dividend by number of consecutive increases
Sample: 7,877 company-years (base years 2019–2024; next years 2020–2025)
After three or more consecutive increases, the next year brought 77.5% increases, 13.8% no change and 8.7% cuts. The streak stopped (no change or cut) in 22.5%, lower than after one (38.0%) or two (31.3%) increases.
Figure 4: Next-year cut rate after three or more increases, by base year
Sample: 328–807 companies with 3+ consecutive increases, by base year
The cut rate ranged from 18.2% (base year 2020) to 4.3% (2021). A long streak does not guarantee another increase.
Data and notessample, counts, method and caveats
Each year from 2019 to 2024 serves as a base year. We include companies with a dividend in the base year and comparable dividends in the prior, base and following years, group them by one, two, or three or more consecutive increases observed through the base year, and compare whether the next year brought an increase, no change or a cut. Each company counts again in each eligible year.
Figure notes
Base years 2019–2024 combined (following years 2020–2025). The 3-or-more group has 2,986 company-years from 1,265 companies. Counts include only observed history, so actual streaks may be longer. Source: actuals recorded by Stock Club.
The 3-or-more group above, split by base year. The horizontal axis is the base year; values are the share that cut the following year. n is the number of companies in each year. Source: actuals recorded by Stock Club.
Show values and sample sizes
2019
- Consecutive increases (observed)
- 1
- Company-years
- 377
- Companies
- 377
- Increase
- 158 / 377 (41.9%)
- Unchanged
- 119 / 377 (31.6%)
- Cut (incl. to zero)
- 100 / 377 (26.5%)
- Streak stopped (unchanged + cut)
- 219 / 377 (58.1%)
2019
- Consecutive increases (observed)
- 2
- Company-years
- 232
- Companies
- 232
- Increase
- 120 / 232 (51.7%)
- Unchanged
- 56 / 232 (24.1%)
- Cut (incl. to zero)
- 56 / 232 (24.1%)
- Streak stopped (unchanged + cut)
- 112 / 232 (48.3%)
2019
- Consecutive increases (observed)
- 3 or more
- Company-years
- 487
- Companies
- 487
- Increase
- 322 / 487 (66.1%)
- Unchanged
- 96 / 487 (19.7%)
- Cut (incl. to zero)
- 69 / 487 (14.2%)
- Streak stopped (unchanged + cut)
- 165 / 487 (33.9%)
2020
- Consecutive increases (observed)
- 1
- Company-years
- 357
- Companies
- 357
- Increase
- 168 / 357 (47.1%)
- Unchanged
- 79 / 357 (22.1%)
- Cut (incl. to zero)
- 110 / 357 (30.8%)
- Streak stopped (unchanged + cut)
- 189 / 357 (52.9%)
2020
- Consecutive increases (observed)
- 2
- Company-years
- 154
- Companies
- 154
- Increase
- 78 / 154 (50.6%)
- Unchanged
- 45 / 154 (29.2%)
- Cut (incl. to zero)
- 31 / 154 (20.1%)
- Streak stopped (unchanged + cut)
- 76 / 154 (49.4%)
2020
- Consecutive increases (observed)
- 3 or more
- Company-years
- 433
- Companies
- 433
- Increase
- 256 / 433 (59.1%)
- Unchanged
- 98 / 433 (22.6%)
- Cut (incl. to zero)
- 79 / 433 (18.2%)
- Streak stopped (unchanged + cut)
- 177 / 433 (40.9%)
2021
- Consecutive increases (observed)
- 1
- Company-years
- 513
- Companies
- 513
- Increase
- 321 / 513 (62.6%)
- Unchanged
- 111 / 513 (21.6%)
- Cut (incl. to zero)
- 81 / 513 (15.8%)
- Streak stopped (unchanged + cut)
- 192 / 513 (37.4%)
2021
- Consecutive increases (observed)
- 2
- Company-years
- 163
- Companies
- 163
- Increase
- 119 / 163 (73.0%)
- Unchanged
- 19 / 163 (11.7%)
- Cut (incl. to zero)
- 25 / 163 (15.3%)
- Streak stopped (unchanged + cut)
- 44 / 163 (27.0%)
2021
- Consecutive increases (observed)
- 3 or more
- Company-years
- 328
- Companies
- 328
- Increase
- 288 / 328 (87.8%)
- Unchanged
- 26 / 328 (7.9%)
- Cut (incl. to zero)
- 14 / 328 (4.3%)
- Streak stopped (unchanged + cut)
- 40 / 328 (12.2%)
2022
- Consecutive increases (observed)
- 1
- Company-years
- 846
- Companies
- 846
- Increase
- 554 / 846 (65.5%)
- Unchanged
- 191 / 846 (22.6%)
- Cut (incl. to zero)
- 101 / 846 (11.9%)
- Streak stopped (unchanged + cut)
- 292 / 846 (34.5%)
2022
- Consecutive increases (observed)
- 2
- Company-years
- 316
- Companies
- 316
- Increase
- 221 / 316 (69.9%)
- Unchanged
- 47 / 316 (14.9%)
- Cut (incl. to zero)
- 48 / 316 (15.2%)
- Streak stopped (unchanged + cut)
- 95 / 316 (30.1%)
2022
- Consecutive increases (observed)
- 3 or more
- Company-years
- 398
- Companies
- 398
- Increase
- 330 / 398 (82.9%)
- Unchanged
- 46 / 398 (11.6%)
- Cut (incl. to zero)
- 22 / 398 (5.5%)
- Streak stopped (unchanged + cut)
- 68 / 398 (17.1%)
2023
- Consecutive increases (observed)
- 1
- Company-years
- 487
- Companies
- 487
- Increase
- 335 / 487 (68.8%)
- Unchanged
- 94 / 487 (19.3%)
- Cut (incl. to zero)
- 58 / 487 (11.9%)
- Streak stopped (unchanged + cut)
- 152 / 487 (31.2%)
2023
- Consecutive increases (observed)
- 2
- Company-years
- 536
- Companies
- 536
- Increase
- 407 / 536 (75.9%)
- Unchanged
- 71 / 536 (13.2%)
- Cut (incl. to zero)
- 58 / 536 (10.8%)
- Streak stopped (unchanged + cut)
- 129 / 536 (24.1%)
2023
- Consecutive increases (observed)
- 3 or more
- Company-years
- 533
- Companies
- 533
- Increase
- 435 / 533 (81.6%)
- Unchanged
- 66 / 533 (12.4%)
- Cut (incl. to zero)
- 32 / 533 (6.0%)
- Streak stopped (unchanged + cut)
- 98 / 533 (18.4%)
2024
- Consecutive increases (observed)
- 1
- Company-years
- 589
- Companies
- 589
- Increase
- 429 / 589 (72.8%)
- Unchanged
- 108 / 589 (18.3%)
- Cut (incl. to zero)
- 52 / 589 (8.8%)
- Streak stopped (unchanged + cut)
- 160 / 589 (27.2%)
2024
- Consecutive increases (observed)
- 2
- Company-years
- 321
- Companies
- 321
- Increase
- 238 / 321 (74.1%)
- Unchanged
- 57 / 321 (17.8%)
- Cut (incl. to zero)
- 26 / 321 (8.1%)
- Streak stopped (unchanged + cut)
- 83 / 321 (25.9%)
2024
- Consecutive increases (observed)
- 3 or more
- Company-years
- 807
- Companies
- 807
- Increase
- 683 / 807 (84.6%)
- Unchanged
- 81 / 807 (10.0%)
- Cut (incl. to zero)
- 43 / 807 (5.3%)
- Streak stopped (unchanged + cut)
- 124 / 807 (15.4%)
2019–2024 combined
- Consecutive increases (observed)
- 1
- Company-years
- 3,169
- Companies
- 2,362
- Increase
- 1,965 / 3,169 (62.0%)
- Unchanged
- 702 / 3,169 (22.2%)
- Cut (incl. to zero)
- 502 / 3,169 (15.8%)
- Streak stopped (unchanged + cut)
- 1,204 / 3,169 (38.0%)
2019–2024 combined
- Consecutive increases (observed)
- 2
- Company-years
- 1,722
- Companies
- 1,552
- Increase
- 1,183 / 1,722 (68.7%)
- Unchanged
- 295 / 1,722 (17.1%)
- Cut (incl. to zero)
- 244 / 1,722 (14.2%)
- Streak stopped (unchanged + cut)
- 539 / 1,722 (31.3%)
2019–2024 combined
- Consecutive increases (observed)
- 3 or more
- Company-years
- 2,986
- Companies
- 1,265
- Increase
- 2,314 / 2,986 (77.5%)
- Unchanged
- 413 / 2,986 (13.8%)
- Cut (incl. to zero)
- 259 / 2,986 (8.7%)
- Streak stopped (unchanged + cut)
- 672 / 2,986 (22.5%)
3. What happened to dividends after profit, operating CF or cash fell?
After net income fell 30% or more, 21.8% cut dividends the next year — about twice the 11.5% when it rose or held flat. The gap was smaller for operating cash flow and year-end cash.
Figure 5: Next-year dividend by change in net profit
Sample: 1,791 non-financial companies, 6,814 company-years (consolidated)
When net profit was positive in both years and fell by 30% or more, 21.8% (235/1,078) cut the next year, about twice the 11.5% (405/3,510) after rising or flat profit. Yet 38.2% of those with a 30%+ fall still raised dividends.
Figure 6: Next-year dividend by change in operating CF
Sample: 1,791 non-financial companies, 6,814 company-years (consolidated)
For operating CF, cuts were 15.7% after a 30%+ fall and 13.0% after a rise or flat result, a smaller gap than for profit. The zero-or-below group had 19.4%.
Figure 7: Next-year dividend by change in year-end cash
Sample: 1,791 non-financial companies, 6,814 company-years (consolidated)
For year-end cash, cuts were 17.9% after a 30%+ fall and 13.5% after a rise or flat result. Operating CF and cash separate outcomes less clearly than profit. Because group composition also differs, this is not a ranking of which measure best predicts cuts.
Data and notessample, counts, method and caveats
This covers 6,814 company-years from 1,791 nonfinancial companies with a dividend and comparable consolidated net profit, operating cash flow and year-end cash, regardless of streak length. Companies are grouped by the change from the prior year to the base year, and we compare the following year’s dividend. All three measures use the same company-years, but which group a company falls into differs by measure.
Percentage changes are calculated only when both years are positive. Values at or below zero in the base year, and recoveries from zero or below, form separate groups.
Restricting to companies with three or more consecutive increases leaves 1,364 company-years. Of 100 with net profit down 30% or more, the next year brought 65 increases, 19 no change and 16 cuts, a 35.0% stop rate, versus 20.4% among 971 with rising or flat profit. This does not establish a threshold at which dividends get cut.
Figure notes
Net profit attributable to owners of the parent. 6,814 consolidated, nonfinancial company-years. The right-hand figures show the share that cut the following year. Source: actuals recorded by Stock Club.
Cash flow from operating activities. Same companies and grouping as the net profit chart. Source: actuals recorded by Stock Club.
Year-end cash and cash equivalents from the cash flow statement. Cash is never zero or below, so the last two groups do not apply. Source: actuals recorded by Stock Club.
Show values and sample sizes
Net profit (attributable to owners of the parent)
- Change from prior year
- Rose or flat
- Company-years
- 3,510
- Increase
- 2,264 / 3,510 (64.5%)
- Unchanged
- 841 / 3,510 (24.0%)
- Cut (incl. to zero)
- 405 / 3,510 (11.5%)
- Streak stopped (unchanged + cut)
- 1,246 / 3,510 (35.5%)
Net profit (attributable to owners of the parent)
- Change from prior year
- Fell <30%
- Company-years
- 1,376
- Increase
- 726 / 1,376 (52.8%)
- Unchanged
- 470 / 1,376 (34.2%)
- Cut (incl. to zero)
- 180 / 1,376 (13.1%)
- Streak stopped (unchanged + cut)
- 650 / 1,376 (47.2%)
Net profit (attributable to owners of the parent)
- Change from prior year
- Fell ≥30%
- Company-years
- 1,078
- Increase
- 412 / 1,078 (38.2%)
- Unchanged
- 431 / 1,078 (40.0%)
- Cut (incl. to zero)
- 235 / 1,078 (21.8%)
- Streak stopped (unchanged + cut)
- 666 / 1,078 (61.8%)
Net profit (attributable to owners of the parent)
- Change from prior year
- Zero or below
- Company-years
- 479
- Increase
- 149 / 479 (31.1%)
- Unchanged
- 213 / 479 (44.5%)
- Cut (incl. to zero)
- 117 / 479 (24.4%)
- Streak stopped (unchanged + cut)
- 330 / 479 (68.9%)
Net profit (attributable to owners of the parent)
- Change from prior year
- Back above zero
- Company-years
- 371
- Increase
- 187 / 371 (50.4%)
- Unchanged
- 130 / 371 (35.0%)
- Cut (incl. to zero)
- 54 / 371 (14.6%)
- Streak stopped (unchanged + cut)
- 184 / 371 (49.6%)
Operating cash flow
- Change from prior year
- Rose or flat
- Company-years
- 3,010
- Increase
- 1,766 / 3,010 (58.7%)
- Unchanged
- 854 / 3,010 (28.4%)
- Cut (incl. to zero)
- 390 / 3,010 (13.0%)
- Streak stopped (unchanged + cut)
- 1,244 / 3,010 (41.3%)
Operating cash flow
- Change from prior year
- Fell <30%
- Company-years
- 1,212
- Increase
- 699 / 1,212 (57.7%)
- Unchanged
- 336 / 1,212 (27.7%)
- Cut (incl. to zero)
- 177 / 1,212 (14.6%)
- Streak stopped (unchanged + cut)
- 513 / 1,212 (42.3%)
Operating cash flow
- Change from prior year
- Fell ≥30%
- Company-years
- 1,339
- Increase
- 667 / 1,339 (49.8%)
- Unchanged
- 462 / 1,339 (34.5%)
- Cut (incl. to zero)
- 210 / 1,339 (15.7%)
- Streak stopped (unchanged + cut)
- 672 / 1,339 (50.2%)
Operating cash flow
- Change from prior year
- Zero or below
- Company-years
- 697
- Increase
- 303 / 697 (43.5%)
- Unchanged
- 259 / 697 (37.2%)
- Cut (incl. to zero)
- 135 / 697 (19.4%)
- Streak stopped (unchanged + cut)
- 394 / 697 (56.5%)
Operating cash flow
- Change from prior year
- Back above zero
- Company-years
- 556
- Increase
- 303 / 556 (54.5%)
- Unchanged
- 174 / 556 (31.3%)
- Cut (incl. to zero)
- 79 / 556 (14.2%)
- Streak stopped (unchanged + cut)
- 253 / 556 (45.5%)
Year-end cash
- Change from prior year
- Rose or flat
- Company-years
- 4,261
- Increase
- 2,465 / 4,261 (57.9%)
- Unchanged
- 1,222 / 4,261 (28.7%)
- Cut (incl. to zero)
- 574 / 4,261 (13.5%)
- Streak stopped (unchanged + cut)
- 1,796 / 4,261 (42.1%)
Year-end cash
- Change from prior year
- Fell <30%
- Company-years
- 2,135
- Increase
- 1,094 / 2,135 (51.2%)
- Unchanged
- 699 / 2,135 (32.7%)
- Cut (incl. to zero)
- 342 / 2,135 (16.0%)
- Streak stopped (unchanged + cut)
- 1,041 / 2,135 (48.8%)
Year-end cash
- Change from prior year
- Fell ≥30%
- Company-years
- 418
- Increase
- 179 / 418 (42.8%)
- Unchanged
- 164 / 418 (39.2%)
- Cut (incl. to zero)
- 75 / 418 (17.9%)
- Streak stopped (unchanged + cut)
- 239 / 418 (57.2%)
Notes: companies with 3+ increases, and equal-year weighting
Below are the 1,364 of the 6,814 company-years with three or more observed consecutive increases. “Streak stopped” = no change + cut. Rates are omitted for 14 zero-or-below profit cases and six recoveries. The zero-or-below operating CF group shows 6.1% cuts (6/99), below 12.7% (26/204) after a 30%+ fall, so worse is not always followed by more cuts.
Net profit (attributable to owners of the parent)
- Change from prior year
- Rose or flat
- Company-years
- 971
- Increase
- 773 / 971 (79.6%)
- Unchanged
- 109 / 971 (11.2%)
- Cut (incl. to zero)
- 89 / 971 (9.2%)
- Streak stopped (unchanged + cut)
- 198 / 971 (20.4%)
Net profit (attributable to owners of the parent)
- Change from prior year
- Fell <30%
- Company-years
- 273
- Increase
- 193 / 273 (70.7%)
- Unchanged
- 52 / 273 (19.0%)
- Cut (incl. to zero)
- 28 / 273 (10.3%)
- Streak stopped (unchanged + cut)
- 80 / 273 (29.3%)
Net profit (attributable to owners of the parent)
- Change from prior year
- Fell ≥30%
- Company-years
- 100
- Increase
- 65 / 100 (65.0%)
- Unchanged
- 19 / 100 (19.0%)
- Cut (incl. to zero)
- 16 / 100 (16.0%)
- Streak stopped (unchanged + cut)
- 35 / 100 (35.0%)
Net profit (attributable to owners of the parent)
- Change from prior year
- Zero or below
- Company-years
- 14
- Increase
- 6 (small n)
- Unchanged
- 4 (small n)
- Cut (incl. to zero)
- 4 (small n)
- Streak stopped (unchanged + cut)
- 8 (small n)
Net profit (attributable to owners of the parent)
- Change from prior year
- Back above zero
- Company-years
- 6
- Increase
- 5 (small n)
- Unchanged
- 0 (small n)
- Cut (incl. to zero)
- 1 (small n)
- Streak stopped (unchanged + cut)
- 1 (small n)
Operating cash flow
- Change from prior year
- Rose or flat
- Company-years
- 702
- Increase
- 540 / 702 (76.9%)
- Unchanged
- 95 / 702 (13.5%)
- Cut (incl. to zero)
- 67 / 702 (9.5%)
- Streak stopped (unchanged + cut)
- 162 / 702 (23.1%)
Operating cash flow
- Change from prior year
- Fell <30%
- Company-years
- 280
- Increase
- 214 / 280 (76.4%)
- Unchanged
- 31 / 280 (11.1%)
- Cut (incl. to zero)
- 35 / 280 (12.5%)
- Streak stopped (unchanged + cut)
- 66 / 280 (23.6%)
Operating cash flow
- Change from prior year
- Fell ≥30%
- Company-years
- 204
- Increase
- 146 / 204 (71.6%)
- Unchanged
- 32 / 204 (15.7%)
- Cut (incl. to zero)
- 26 / 204 (12.7%)
- Streak stopped (unchanged + cut)
- 58 / 204 (28.4%)
Operating cash flow
- Change from prior year
- Zero or below
- Company-years
- 99
- Increase
- 76 / 99 (76.8%)
- Unchanged
- 17 / 99 (17.2%)
- Cut (incl. to zero)
- 6 / 99 (6.1%)
- Streak stopped (unchanged + cut)
- 23 / 99 (23.2%)
Operating cash flow
- Change from prior year
- Back above zero
- Company-years
- 79
- Increase
- 66 / 79 (83.5%)
- Unchanged
- 9 / 79 (11.4%)
- Cut (incl. to zero)
- 4 / 79 (5.1%)
- Streak stopped (unchanged + cut)
- 13 / 79 (16.5%)
Year-end cash
- Change from prior year
- Rose or flat
- Company-years
- 914
- Increase
- 715 / 914 (78.2%)
- Unchanged
- 107 / 914 (11.7%)
- Cut (incl. to zero)
- 92 / 914 (10.1%)
- Streak stopped (unchanged + cut)
- 199 / 914 (21.8%)
Year-end cash
- Change from prior year
- Fell <30%
- Company-years
- 379
- Increase
- 278 / 379 (73.4%)
- Unchanged
- 63 / 379 (16.6%)
- Cut (incl. to zero)
- 38 / 379 (10.0%)
- Streak stopped (unchanged + cut)
- 101 / 379 (26.6%)
Year-end cash
- Change from prior year
- Fell ≥30%
- Company-years
- 71
- Increase
- 49 / 71 (69.0%)
- Unchanged
- 14 / 71 (19.7%)
- Cut (incl. to zero)
- 8 / 71 (11.3%)
- Streak stopped (unchanged + cut)
- 22 / 71 (31.0%)
Weighting 2019–2024 equally and requiring at least 30 observations in each year, cuts were 21.0% after a 30%+ profit fall versus 12.4% after rising or flat profit; operating CF gives 16.5% versus 13.5%. The 30%+ cash decline group does not meet the 30-per-year condition in all six years, so no rate is reported.
4. How did cash and dividends move at two actual companies?
Epson raised its dividend the year after profit and operating cash flow fell; Nissan paid nothing even as its cash grew. These are two examples, not rates across all companies.
Figure 8: Epson (6724): annual dividend per share
Fiscal years ended March 2022–2025
Epson’s annual dividend went JPY 62 → 72 → 74 → 74. Because 2023 included a JPY 10 commemorative dividend, the ordinary dividend did not rise every year.
Figure 9: Epson (6724): performance trend (Stock Club screen)
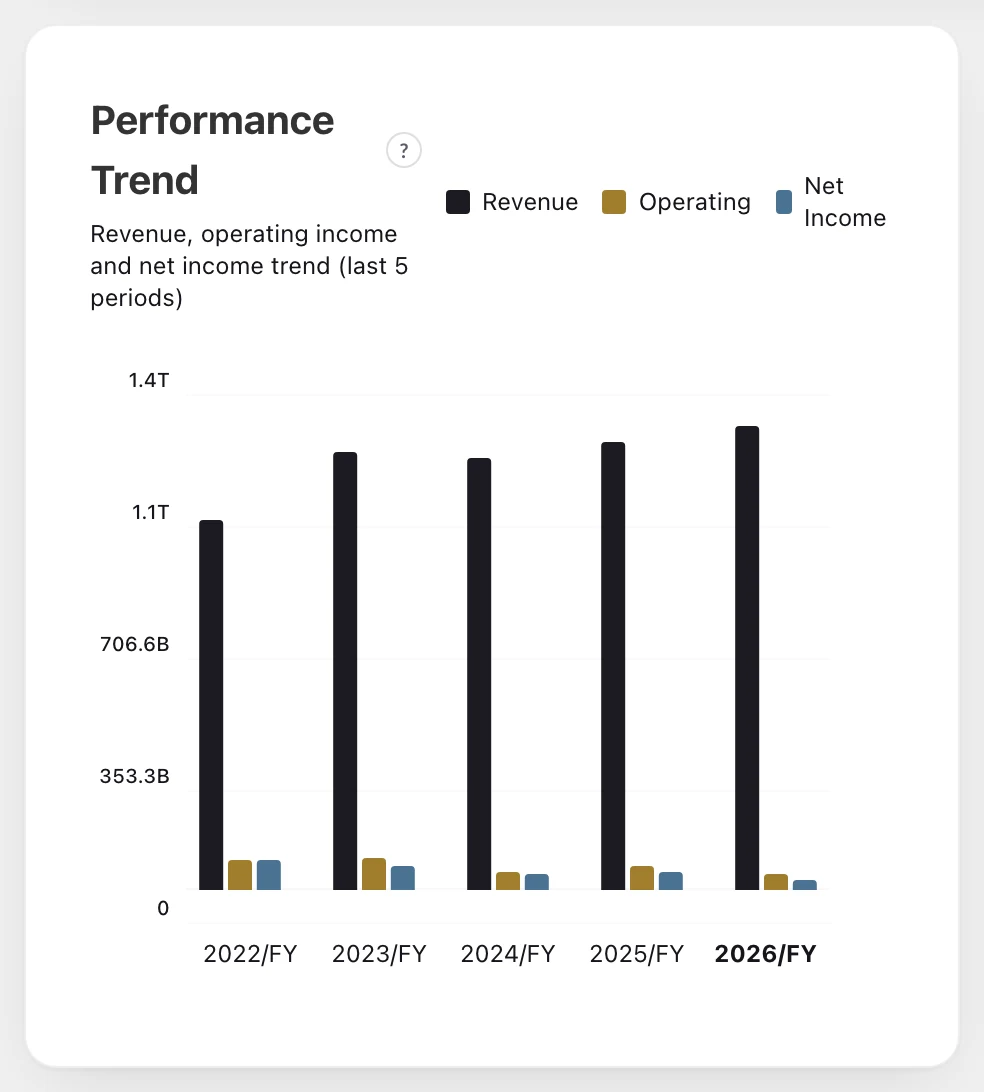
Stock Club: Epson income statement, performance trend. Revenue, operating profit and net profit for the latest five years (March FY2022–2026); this article covers up to March FY2025. Captured October 17, 2026, without login.
Net profit fell from JPY 92.3 billion in March FY2022 to JPY 75.0 billion in FY2023 (down 18.7%) and JPY 52.6 billion in FY2024.
Figure 10: Epson (6724): cash flow trend (Stock Club screen)
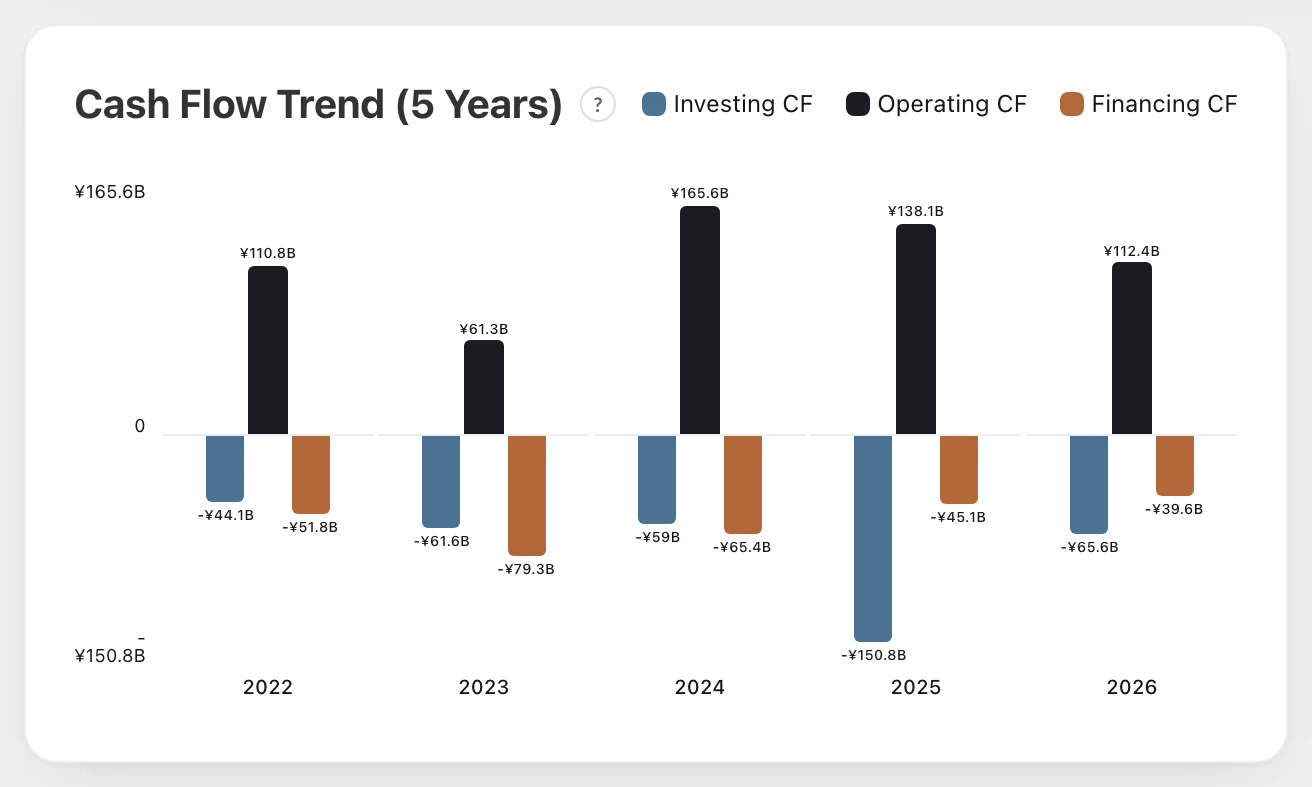
Stock Club: Epson cash flow, five-year cash flow trend. The black bars are operating CF. Captured October 17, 2026, without login.
Operating CF dropped to JPY 61.3 billion in March FY2023 (down 44.7%), and year-end cash fell 20.2% to JPY 267.4 billion. Even so, the annual dividend rose from JPY 72 to 74 the next year.
Figure 11: Nissan (7201): annual dividend per share
Fiscal years ended March 2022–2025
Nissan’s annual dividend went JPY 5 → 10 → 20 → 0. After two increases, it paid no dividend for March FY2025.
Figure 12: Nissan (7201): performance trend (Stock Club screen)
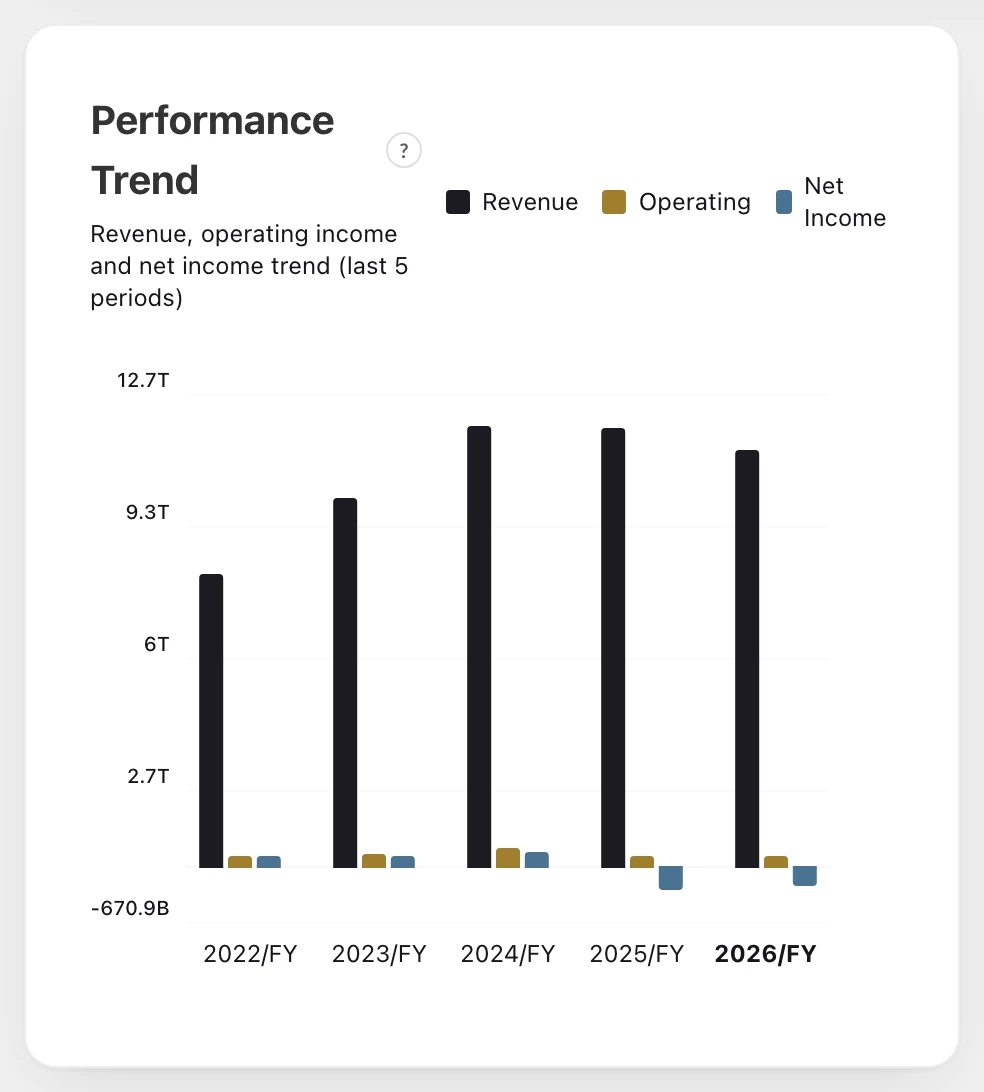
Stock Club: Nissan income statement, performance trend for the latest five years (March FY2022–2026); this article covers up to March FY2025. Captured October 17, 2026, without login.
Net profit went from JPY 426.7 billion in March FY2024 to a net loss of JPY 670.9 billion in FY2025.
Figure 13: Nissan (7201): cash flow trend (Stock Club screen)
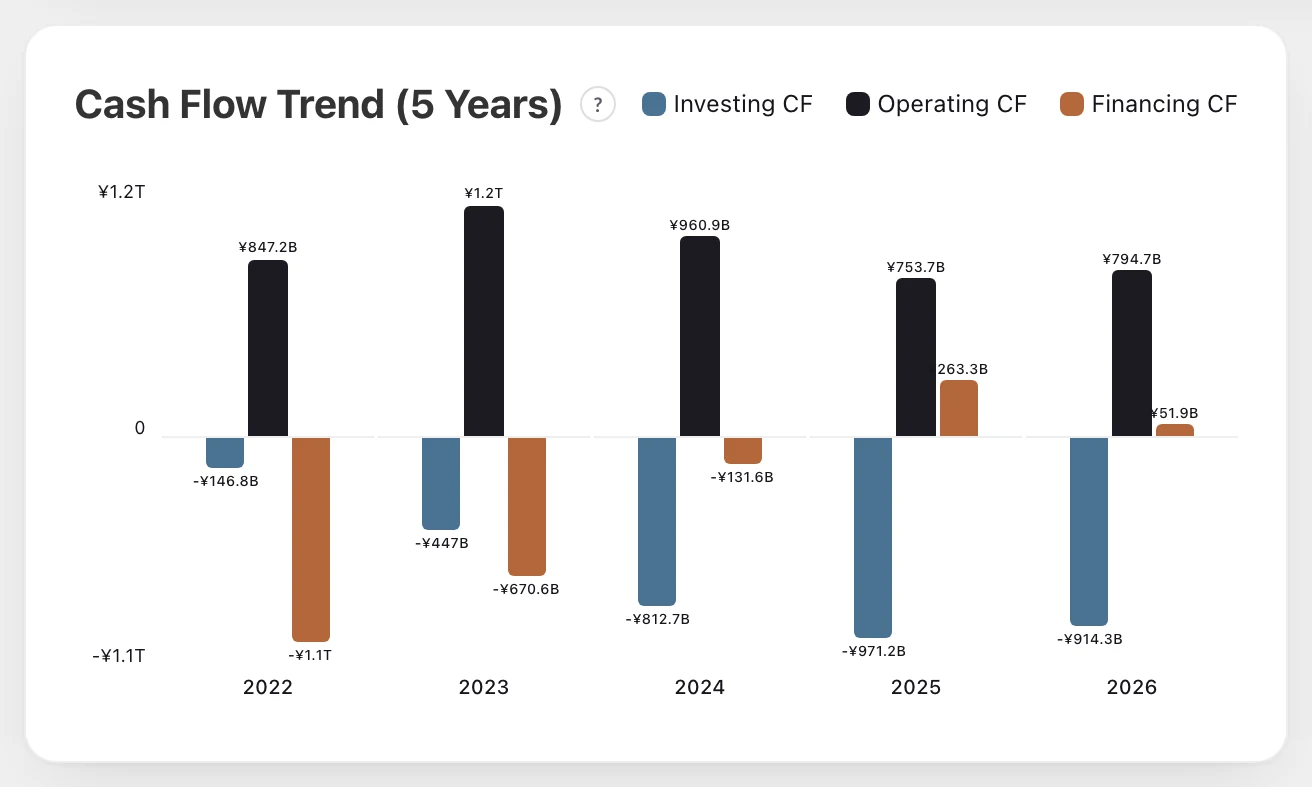
Stock Club: Nissan cash flow, five-year cash flow trend. The black bars are operating CF. Nissan’s consolidated cash flow includes its sales finance and leasing business. Captured October 17, 2026, without login.
Operating CF fell to JPY 753.7 billion in March FY2025, yet year-end cash rose 3.4% to JPY 2,197.5 billion. A company can stop paying dividends even while cash rises. The 2025 figures are not treated as conditions known in 2024.
Data and notessample, counts, method and caveats
We follow Epson and Nissan through the March financial years 2022–2025, checked against their own disclosures. These two companies were chosen to show how cash and dividends moved; they do not show how often this happens across all companies.
Figure notes
March FY2022–2025. The JPY 72 in 2023 is JPY 62 ordinary plus JPY 10 commemorative. Source: Epson dividend information (below).
March FY2022–2025. The JPY 5 in 2022 resumed payments after a year without dividends and is not counted as an increase. Source: Nissan earnings releases (below).
Show values and sample sizes
Epson
- March FY
- 2022
- Annual DPS (JPY)
- 62
- Net profit (JPY million)
- 92,288
- Operating CF (JPY million)
- 110,801
- Year-end cash (JPY million)
- 335,239
Epson
- March FY
- 2023
- Annual DPS (JPY)
- 72
- Net profit (JPY million)
- 75,043
- Operating CF (JPY million)
- 61,311
- Year-end cash (JPY million)
- 267,380
Epson
- March FY
- 2024
- Annual DPS (JPY)
- 74
- Net profit (JPY million)
- 52,616
- Operating CF (JPY million)
- 165,570
- Year-end cash (JPY million)
- 328,481
Epson
- March FY
- 2025
- Annual DPS (JPY)
- 74
- Net profit (JPY million)
- 55,177
- Operating CF (JPY million)
- 138,075
- Year-end cash (JPY million)
- 267,000
Nissan
- March FY
- 2022
- Annual DPS (JPY)
- 5
- Net profit (JPY million)
- 215,533
- Operating CF (JPY million)
- 847,187
- Year-end cash (JPY million)
- 1,792,692
Nissan
- March FY
- 2023
- Annual DPS (JPY)
- 10
- Net profit (JPY million)
- 221,900
- Operating CF (JPY million)
- 1,221,051
- Year-end cash (JPY million)
- 2,014,387
Nissan
- March FY
- 2024
- Annual DPS (JPY)
- 20
- Net profit (JPY million)
- 426,649
- Operating CF (JPY million)
- 960,899
- Year-end cash (JPY million)
- 2,126,206
Nissan
- March FY
- 2025
- Annual DPS (JPY)
- 0
- Net profit (JPY million)
- -670,898
- Operating CF (JPY million)
- 753,687
- Year-end cash (JPY million)
- 2,197,513
The table uses JPY million as in the disclosures; charts convert to JPY 100 million. Nissan’s 2022 payment resumed after no dividend and is outside the streak count; two increases in 2023–2024 were followed by no dividend in 2025. Epson’s 2023 total is JPY 62 ordinary + JPY 10 commemorative. Current policies are not applied retrospectively as reasons.
Notes: why these two companies, and sources
Two companies and eight financial years chosen to show contrasting paths; they are not representative or a measure of frequency. Nissan’s consolidated cash flow includes sales finance and leasing, unlike Epson. We do not substitute a common free-cash-flow measure or infer causes of cuts from changes that happened at the same time.
Supplement: did dividend increases rise around the TSE request?
The share raising dividends had already reached 55.4% in 2022, before the request, and stayed at 58.6–62.7% afterwards. The difference cannot be attributed to the request alone.
Figure 14: Share of companies raising dividends around the TSE request (1,555 March-year-end companies)
Sample: 1,555 Prime/Standard companies with March year-ends (FY Mar-2023 excluded as the boundary)
The share raising dividends went from 28.7% in 2021 to 55.4% in 2022 before the request, and was 58.6–62.7% in 2024–2026 after it. High shares continued, but the rise began before the request.
Market classifications and book-value multiples as of 2023 could not be reconstructed, so no comparison by price-to-book group is made. Earnings and company mix also changed, so the difference cannot be attributed to the request.
Data and notessample, counts, method and caveats
Here we follow 1,555 March-year-end companies selected from current Prime and Standard classifications, with comparable dividends in six periods around the request. This group is separate from sections 1 and 2. The March 31, 2023 request covered all Prime and Standard companies, was not limited to those trading below 1x book value, and did not ask for dividend increases alone. TSE announcement
Figure notes
1,555 March-year-end companies selected from market classifications recorded as of October 4, 2026, with the same denominator in all six periods (confirmed zero dividends included). March FY2023 is excluded as the boundary year. Starts and resumptions are not counted as increases. Source: actuals recorded by Stock Club.
Show values and sample sizes
2020
- Increases
- 532
- n
- 1,555
- Share
- 34.2%
2021
- Increases
- 447
- n
- 1,555
- Share
- 28.7%
2022
- Increases
- 862
- n
- 1,555
- Share
- 55.4%
2024
- Increases
- 912
- n
- 1,555
- Share
- 58.6%
2025
- Increases
- 974
- n
- 1,555
- Share
- 62.6%
2026
- Increases
- 975
- n
- 1,555
- Share
- 62.7%
5. What should you check for your own holdings?
- Look beyond the number of increases: when a streak ended, was it a hold or a cut?
- Read net profit, operating CF and year-end cash separately, comparing the same financial years.
- Separate ordinary from special or commemorative dividends, and check the company’s shareholder return policy in its own disclosures.
Notes: scope, definitions and limitssample, definitions, limits
Information cutoff: October 4, 2026. Confirmed or revised annual total dividends are compared on a split-adjusted common share basis. We use regular financial periods (350–380 days) with the same FY-end month and do not fill missing values with zero. “Year” means the calendar year of the FY end, not the announcement year.
Yearly results separate all companies comparable in each year (24,611 company-years in total) from the 2,177 companies with data for all eight years; the latter is selected on continued data availability. Starting from currently recorded companies omits delisted companies and favors survivors.
Next-year comparisons use 15,139 company-years from 3,056 companies in base years 2019–2024, with a dividend in the base year and comparable prior, base and following years. Streaks count only history observed through the base year and do not bridge gaps or resumptions, so they may undercount.
The profit, operating CF and cash charts use 6,814 company-years with all three measures, including 1,364 with three or more consecutive increases. Groups were fixed before tabulation. Groups with fewer than 30 observations show counts only in the notes, which also report equal-year-weighted results. Repeated companies, year, sector and size differences, and multiple comparisons still matter.
Cash flow and cash were checked against source values, JPY units and consolidation scope. Net profit passed parent-attribution and EPS share-count checks, but the currency and units of every profit source were not independently audited. This does not fully reconstruct the information and revisions available at the time; it shows retrospective relationships, not causal effects, forecasts or trading recommendations.
The TSE supplement is a separate group of 1,555 March-year-end companies (including 31 no longer listed) with six comparable periods, selected from current Prime and Standard classifications. It does not reconstruct 2023 market classifications or book-value groups and is not combined with the companies in sections 1 and 2.
Sources
Aggregates use dividend and financial actuals recorded by Stock Club; chart values were recomputed from saved source rows. This is not an audit of every primary disclosure. The two company examples were checked against the sources below.
- Epson: dividends, including the 2023 commemorative payment
- Epson: net profit
- Epson: operating CF and year-end cash
- Nissan: March FY2023 earnings release (2022–2023), PDF pp. 1, 14, 15, 19
- Nissan: March FY2025 earnings release (2024–2025), PDF pp. 1, 13, 14, 18
This article is for information only and is not a recommendation to buy or sell any security. Check the latest company disclosures for exact figures and terms.