
CSVSBI Securities · Rakuten Securities
Enter on this site
Register accounts and holdings directly on StockClub. You can also import them in bulk from your broker’s CSV file.

ASSET MANAGEMENT
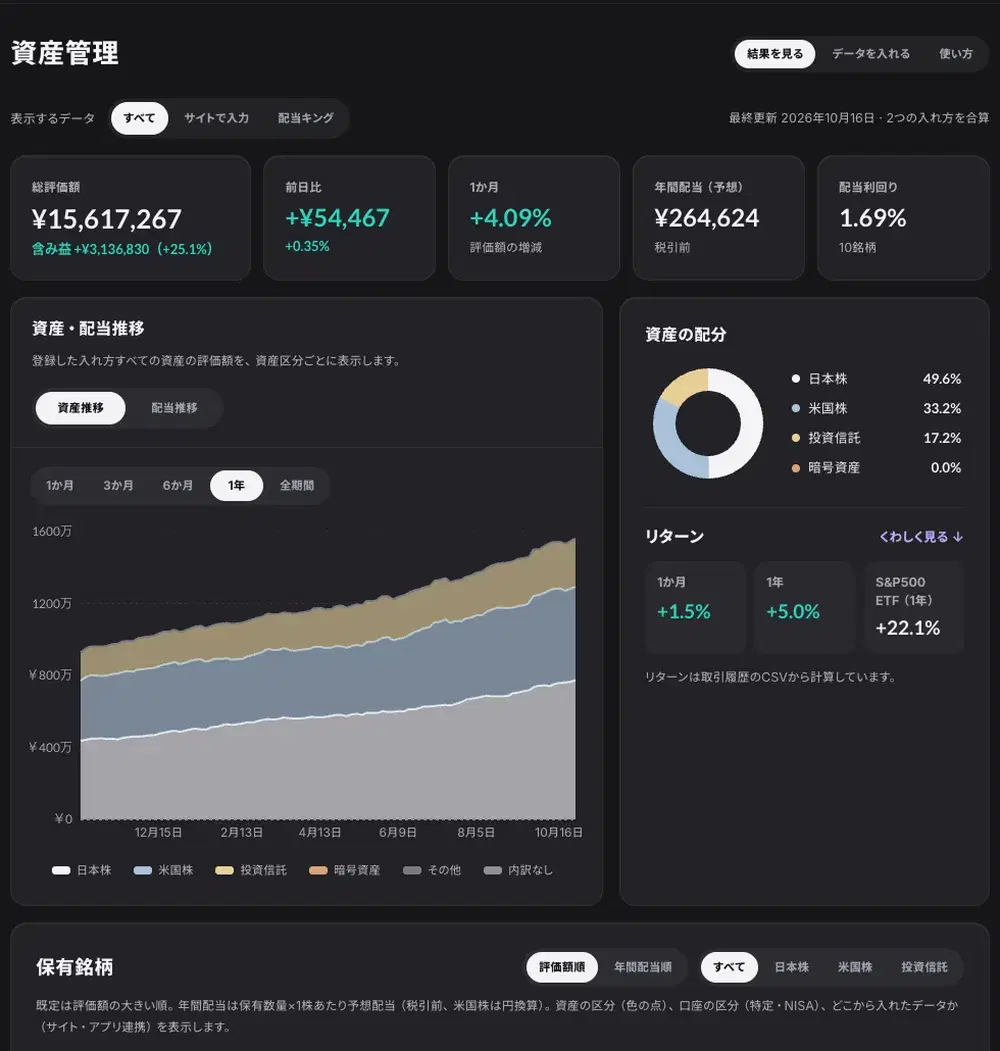
Register the stocks you own from broker CSV files, or by linking the Dividend King and Finorra apps. See valuation, gains, annual dividends, allocation and returns with StockClub prices and dividends.
Asset Management is available from a free membership. Linking apps has conditions on each app’s side.
You can combine them. The results are added up.
Register accounts and holdings directly on StockClub. You can also import them in bulk from your broker’s CSV file.



Show the holdings you registered in Dividend King with StockClub prices and dividends. For Gold members of the app.
About Dividend King linkage ↓ Finorra
Check the accounts and holdings synced to Finorra with your usual StockClub account. US stock valuations and dividends on one screen.
About Finorra linkage ↓See the holdings you registered in Dividend King by StockClub price, dividend and sector, on one screen. You can manage them in the app and on StockClub.
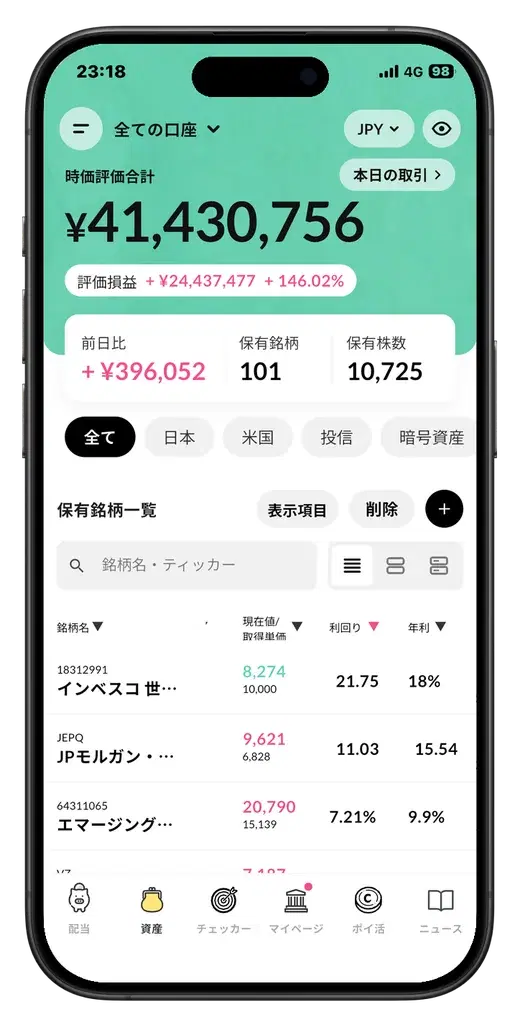
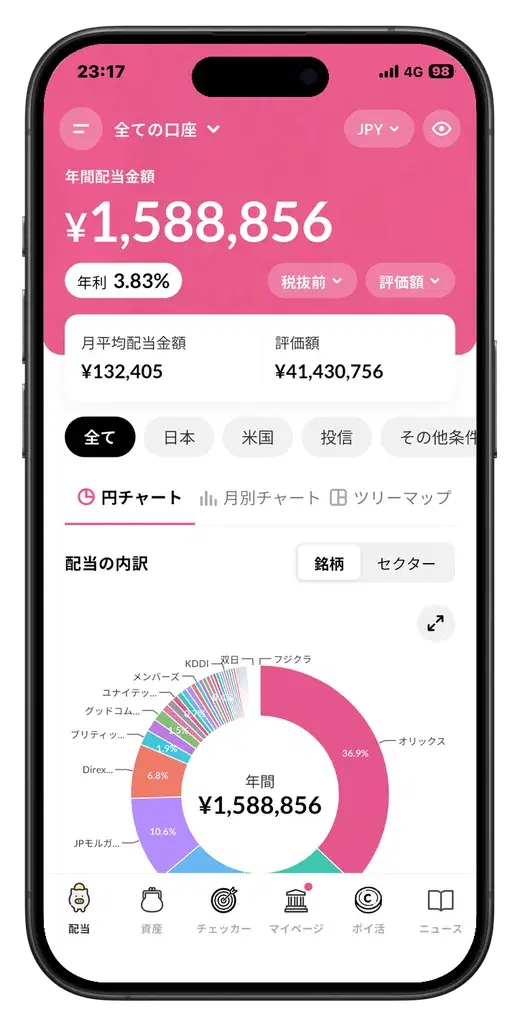
Review valuations, gains and losses, and annual dividends in one place, with allocation pie charts and heatmaps.
Add, edit, or remove holdings, and import SBI Securities or Rakuten Securities CSV files to update symbols, quantities, and average acquisition prices in bulk.
Use transaction-history CSV files from SBI Securities or Rakuten Securities to review asset trends, gains and losses, and benchmark comparisons.
View accounts and holdings synced from Finorra using your usual StockClub account. Review US stock valuations, dividends, and portfolio composition in one place.
Finorra is a separate contract from your StockClub plan.
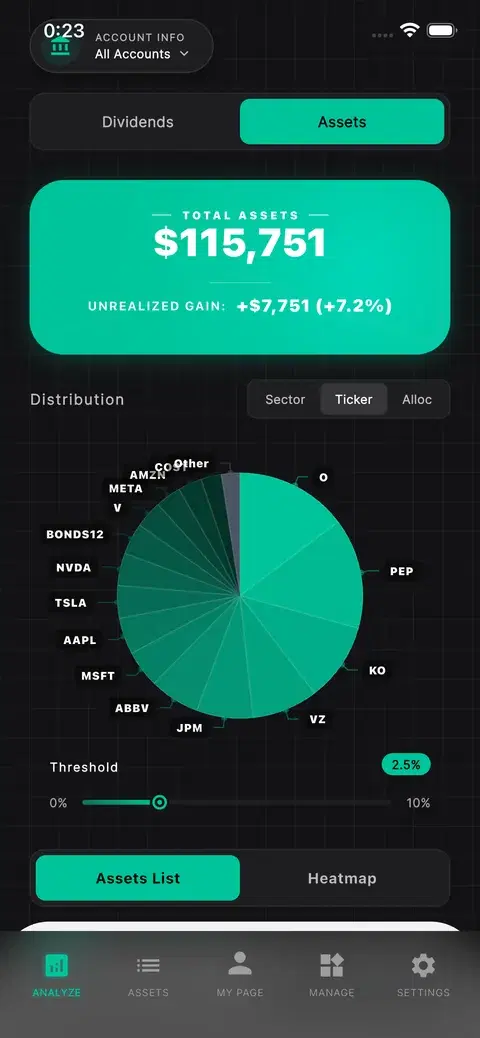
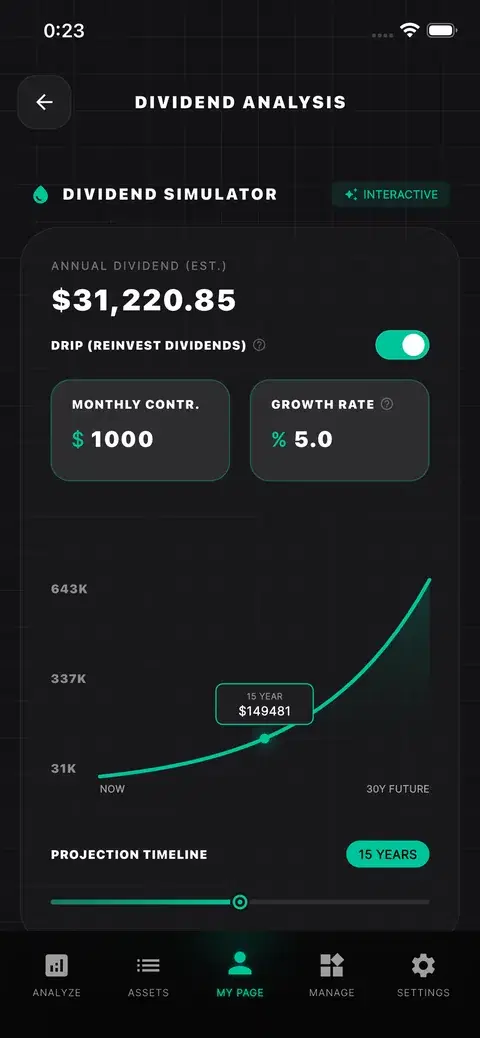

See quantities, average costs, valuations, and gains or losses in a holdings list. Show or hide individual accounts to focus on the assets you want to review.
Switch between price and dividend views to review annual dividends and yields for each holding. You can also switch to after-tax dividends for holdings with a tax rate set.
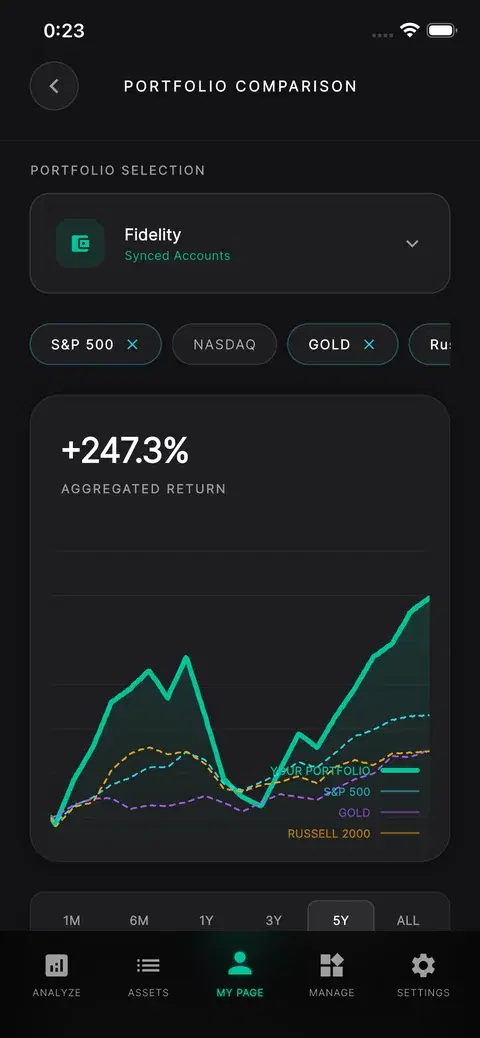
Use pie charts to review holdings weights and dividend composition. The price view also offers a sector heatmap to help you understand portfolio concentration and price movements.
Per holding and in total. US stocks are converted to yen and added up.
The share of Japanese stocks, US stocks and funds, and the account type (taxable or NISA).
Calculates asset trends and comparisons with the S&P 500 and others from your transaction-history CSV.
Sign up with your email address or Google account. It costs nothing.