

U-NEXT HOLDINGS FY2026 Earnings In-Depth Analysis: Record Revenue for 8 Consecutive Years and 83% Recurring Ratio; First Year of Mid-Term Plan Overcomes Energy Headwinds with Record Profits in Three Other Segments

Sentiment Analysis

1. Overall Earnings: Record Revenue of 469.9 Billion Yen, Driven by a Solid Foundation of Recurring Revenue
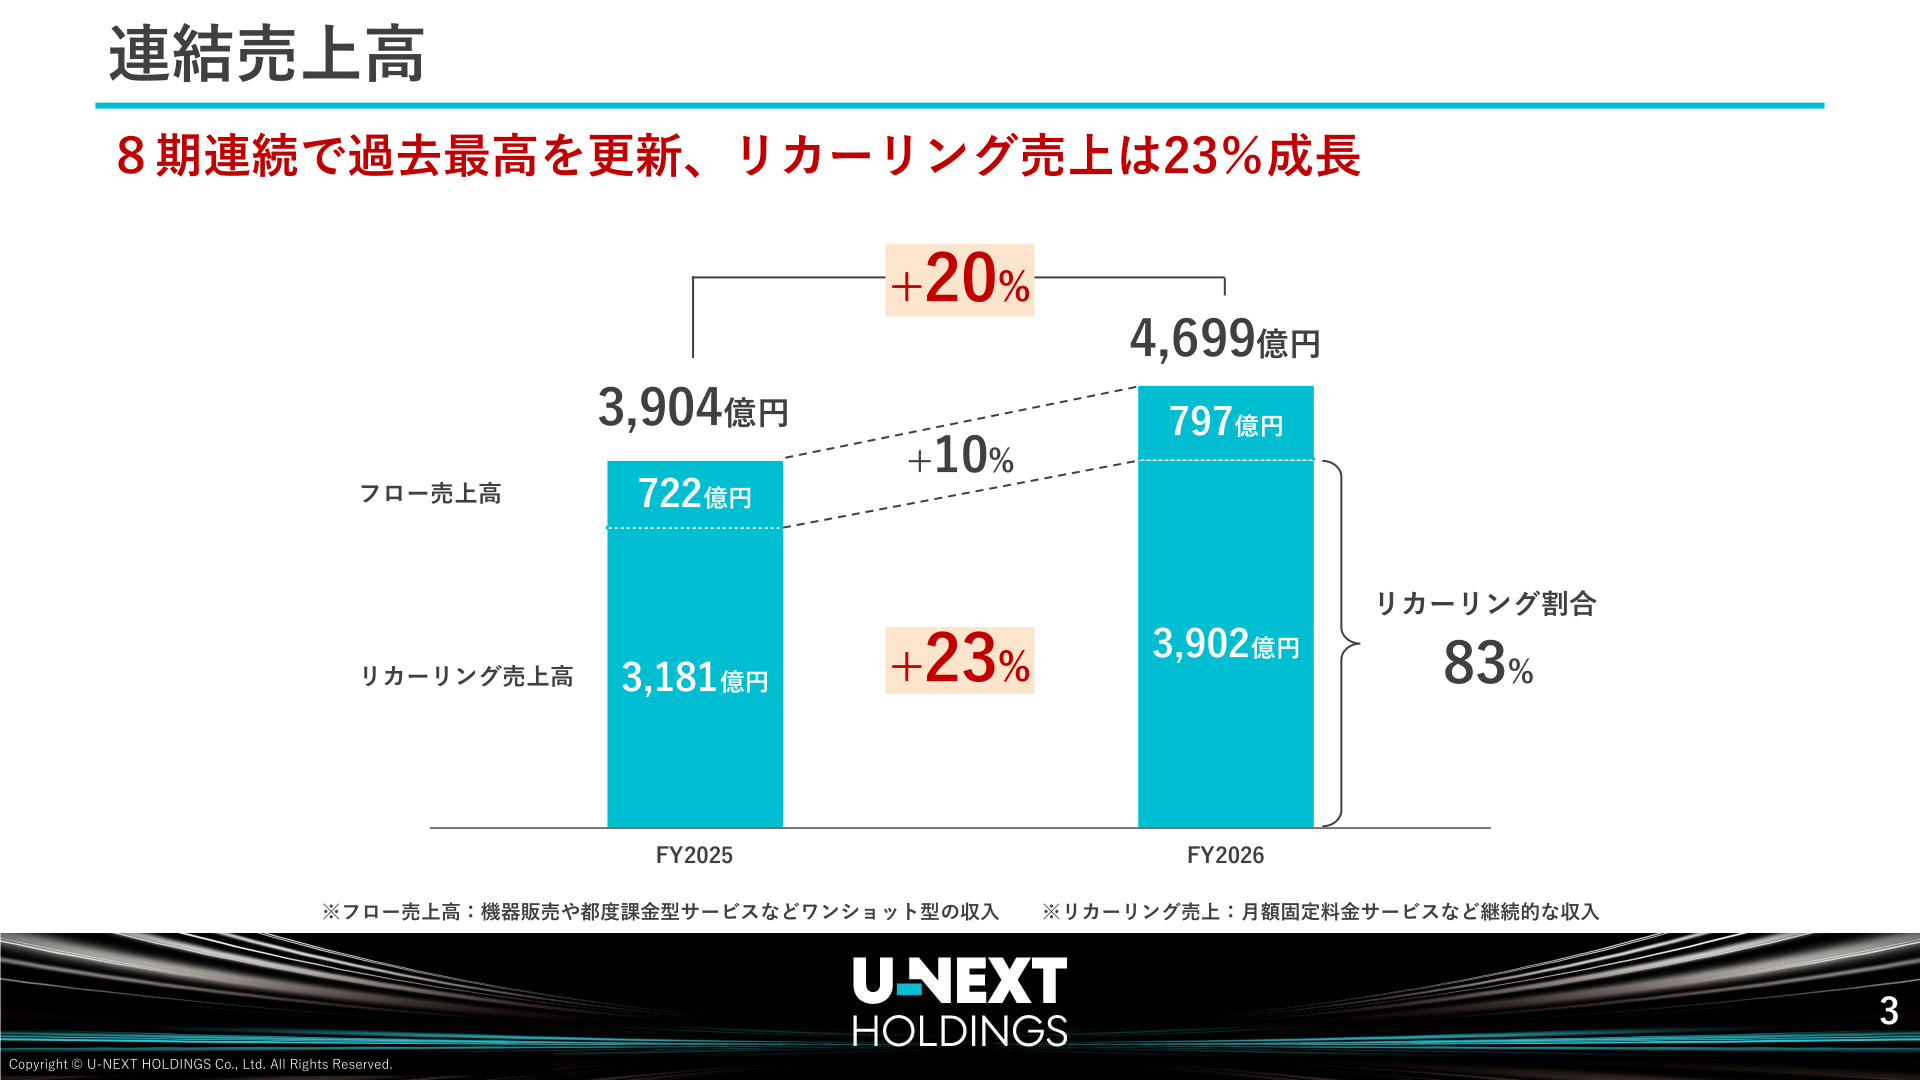
U-NEXT HOLDINGS Co., Ltd. reported consolidated financial results for the fiscal year ended August 2026, with revenue increasing 20% year-on-year to 469.957 billion yen , marking a record high for the eighth consecutive year . This significantly exceeded the initial full-year forecast of 424 billion yen, achieving a progress rate of 111%. Meanwhile, operating profit declined 4% year-on-year to 30.255 billion yen (90% progress against the 33.5 billion yen forecast), ordinary profit fell 9% to 28.169 billion yen, and profit attributable to owners of parent decreased 19% to 14.959 billion yen (a 14% decrease to 18.711 billion yen after goodwill adjustments).
The primary reason for profit falling short of initial expectations was a significant downward pressure on the "Communications & Energy Business" due to soaring power procurement costs triggered by geopolitical risks (Middle East issues). However, even amidst these headwinds, the group's core strength— stock-type revenue (recurring revenue)—surged 23% year-on-year to 390.2 billion yen , reaching 83% of the total revenue mix.
[Slide Commentary: Revenue Trends and Recurring Ratio (P3)]
As shown in the slide above, the company is deepening its qualitative shift from "one-shot type (flow revenue) such as equipment sales" to "continuous income (recurring revenue) such as monthly fixed-fee services." While flow revenue remained solid, up 10% year-on-year to 79.7 billion yen, the net increase of 72.1 billion yen in recurring revenue—from 318.1 billion yen to 390.2 billion yen—has solidified a stable cash-generating structure less susceptible to economic cycles or temporary demand fluctuations. This high stock ratio of 83% serves as a robust foundation that keeps total company revenue on a double-digit growth trajectory even during periods of rapid cost inflation.
2. Profit Structure Breakdown: Temporary Energy Decline vs. Record Profits in Other Segments
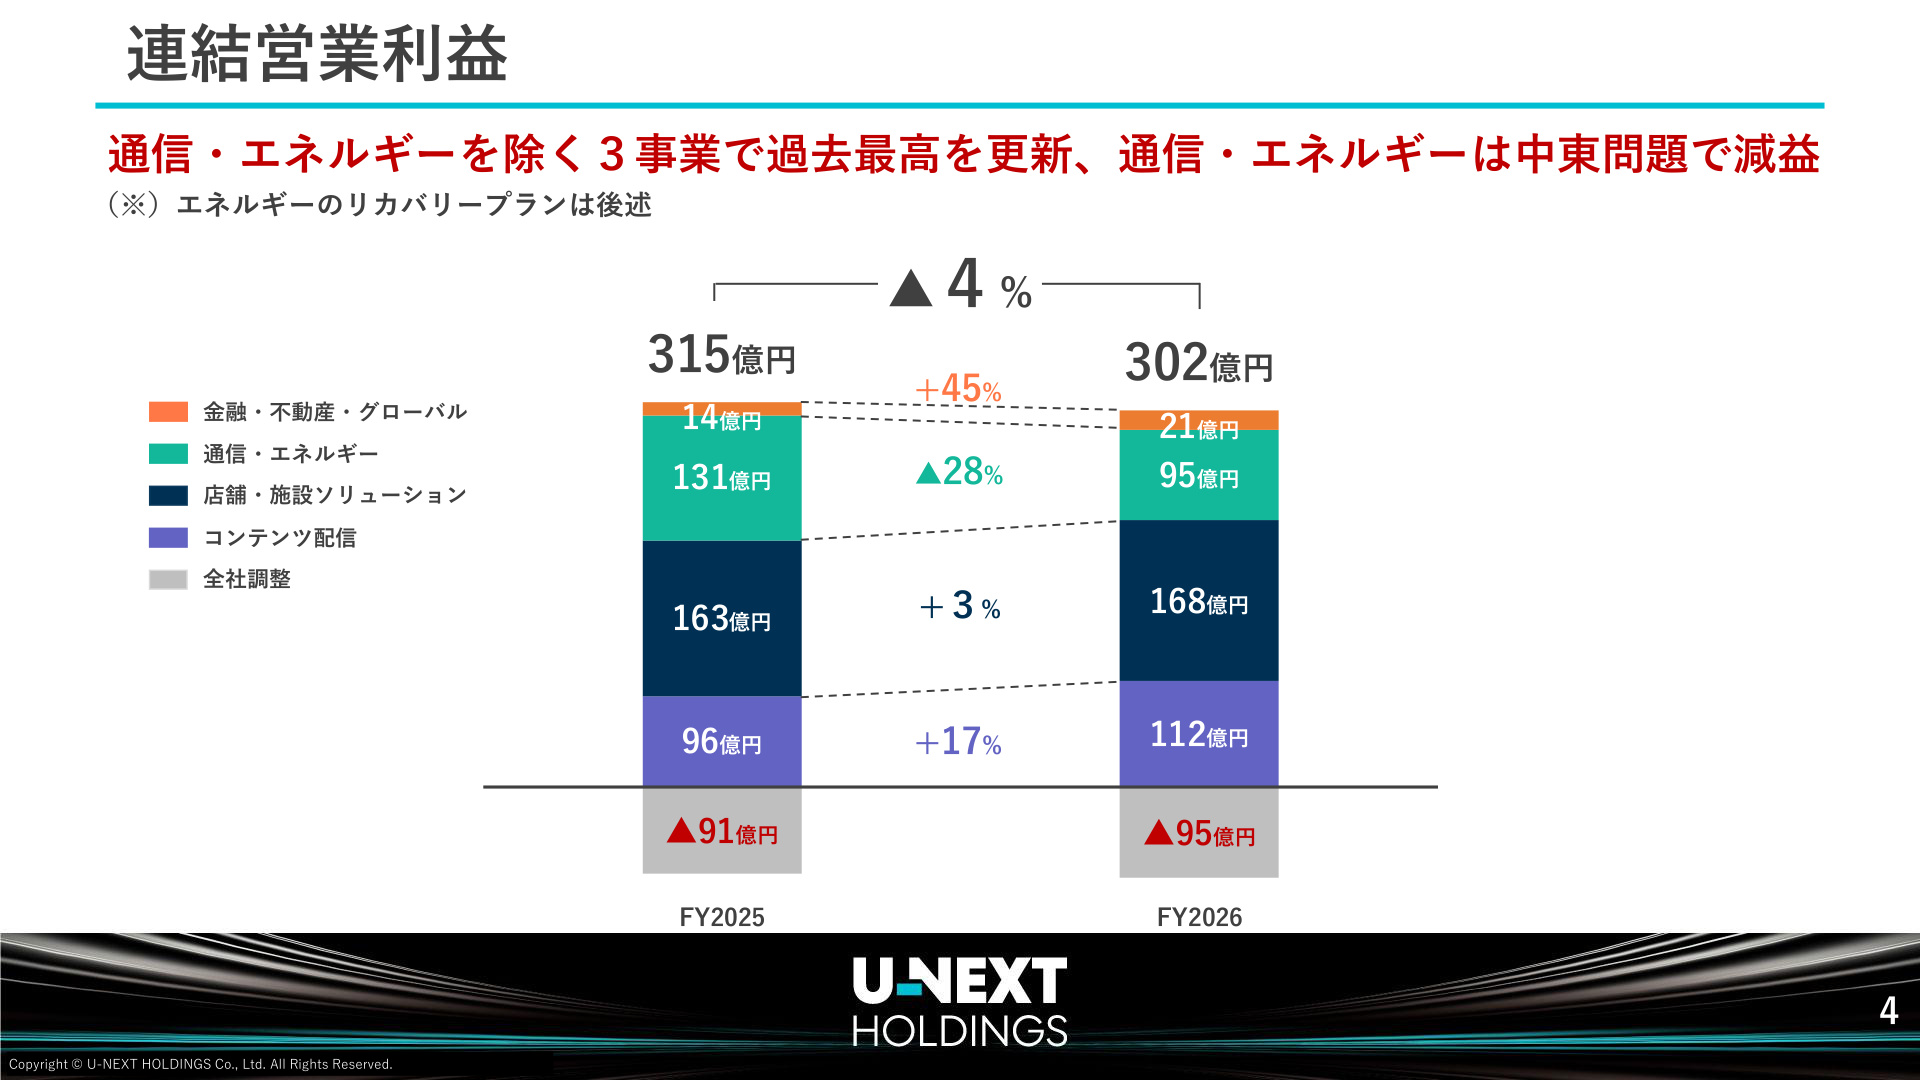
A detailed examination of the factors behind the year-on-year and forecast-relative shortfall in operating profit reveals a clear contrast within the group. By segment, all three major segments excluding the "Communications & Energy Business" (Content Distribution, Store & Facility Solutions, and Finance, Real Estate & Global) achieved record-high profits.
[Slide Commentary: Segment Breakdown of Consolidated Operating Profit (P4)]
This slide vividly illustrates the true state of profits for the fiscal year ended August 2026. The operating profit of the "Communications & Energy Business" was hit hard by the surge in power market prices and increased procurement costs following the escalation of tensions in the Middle East, forcing a significant 28% year-on-year decline (down 3.6 billion yen) from 13.1 billion yen in the previous year to 9.5 billion yen.
However, the other three pillars absorbed this intense headwind. The "Store & Facility Solutions Business" achieved 16.8 billion yen, a 3% year-on-year increase, despite the loss of special demand related to the new banknote issuance (a 1.6 billion yen negative profit impact) that occurred in the previous year. The "Content Distribution Business" surged 17% year-on-year to 11.2 billion yen due to an expanded member base and higher unit prices, while the "Finance, Real Estate & Global Business" grew 45% year-on-year to 2.1 billion yen. Even including corporate adjustments (down 9.5 billion yen), the group's underlying earning power maintains a very strong growth trend, excluding the deterioration in the energy business.
Pro-forma Operating Profit Adjusting for One-time Factors
The "Pro-forma Operating Profit" disclosed in the financial materials (P5), which adjusts for the 1.6 billion yen banknote-related special demand in the previous year and the temporary external environment deterioration in the energy business during the current period (approximately 6.8 billion yen in profit impairment), shows a 20% year-on-year increase (from 23.2 billion yen to 27.8 billion yen). This demonstrates that on a core business basis, excluding temporary market turmoil, the entire group achieved double-digit profit growth.
3. Trends by Major Segment and Deep Dive into Business KPIs
(1) Content Distribution Business: Surpassing 5.4 Million Users and 130 Billion Yen in ARR
The Content Distribution Business, which operates the video streaming service "U-NEXT," saw revenue increase 13% year-on-year to 144.46 billion yen , with operating profit up 17% to 11.276 billion yen. The number of paying users reached 5.40 million, a net increase of 450,000 (+9.2%) from the end of the same period last year. Furthermore, ARR (Annual Recurring Revenue) , which indicates the total recurring revenue of the service, increased 10% year-on-year to 130.361 billion yen , and the monthly customer unit price (MRR basis) remained stable at 2,012 yen, showing a slight increase.
Notably, the advertising and promotion expense ratio relative to revenue declined by 1.0 percentage point from 9.8% in the same period last year to 8.8% (P24). The revenue leverage from scale expansion is functioning steadily, improving acquisition efficiency. Additionally, the company has concluded a comprehensive strategic partnership with NBCUniversal , a major global media company. Starting in October 2026, it will launch "Universal+" exclusively in Japan, and is laying the groundwork to further enhance its competitiveness as a platform through collaborative projects with Universal Studios Japan and the global distribution of Japanese content via the "Peacock" network.
(2) Store & Facility Solutions Business: M&A Integration and Capturing Automation/DX Demand
Revenue increased 14% year-on-year to 110.614 billion yen , and operating profit grew 3% to 16.849 billion yen. This was driven by the contribution of the acquisition and subsidiary conversion of Xing Inc., which handles the commercial karaoke equipment "JOYSOUND" (acquisition cost of 17.5 billion yen), flow revenue from external construction, and the accumulation of core store-oriented DX products.
The number of store solution contracts increased by 100,000 (+8.3%) from 1.204 million at the end of the previous fiscal year to 1.304 million. Against the backdrop of labor shortages, the introduction of multifaceted solutions such as automatic payment machines for restaurants and lodging facilities (No. 1 domestic market share), paid mobile POS (No. 1 domestic market share), AI cameras, and serving robots is accelerating.
(3) Communications & Energy Business: 25.3% Increase in Contracts, but Profit Adjustment Phase
Although revenue increased 24% year-on-year to 199.459 billion yen , operating profit fell 28% year-on-year to 9.533 billion yen , significantly below the initial forecast (15.3 billion yen). The combined number of fiber-optic and power contracts increased 25.3% year-on-year to 654,000 (+130,000). Since the customer base itself is expanding rapidly, the focus will be on executing a recovery plan to normalize profitability through the review of fuel cost adjustment system operations and the optimization of the procurement portfolio.
(4) Finance, Real Estate & Global Business: Significant 45% Growth in Operating Profit
Revenue increased 118% year-on-year to 24.277 billion yen , and operating profit grew 45% year-on-year to 2.156 billion yen. In addition to M&A for the succession of the cashless payment business and the new consolidation of subsidiaries, existing businesses such as rent guarantees and small-amount short-term insurance performed steadily, with the number of core product contracts increasing 11% year-on-year to 457,000.
4. Progress of the Mid-Term Management Plan (FY2030 Goal) and Financial Strategy
The company is promoting a long-term mid-term management plan ending in the fiscal year ending August 2030, with the fiscal year ended August 2026 being the first year. Despite unexpected market fluctuations such as the profit decline in the energy business, overall business progress and financial discipline remain within the plan's assumptions.
[Slide Commentary: Summary of Progress in the First Year of the Mid-Term Management Plan (P18)]
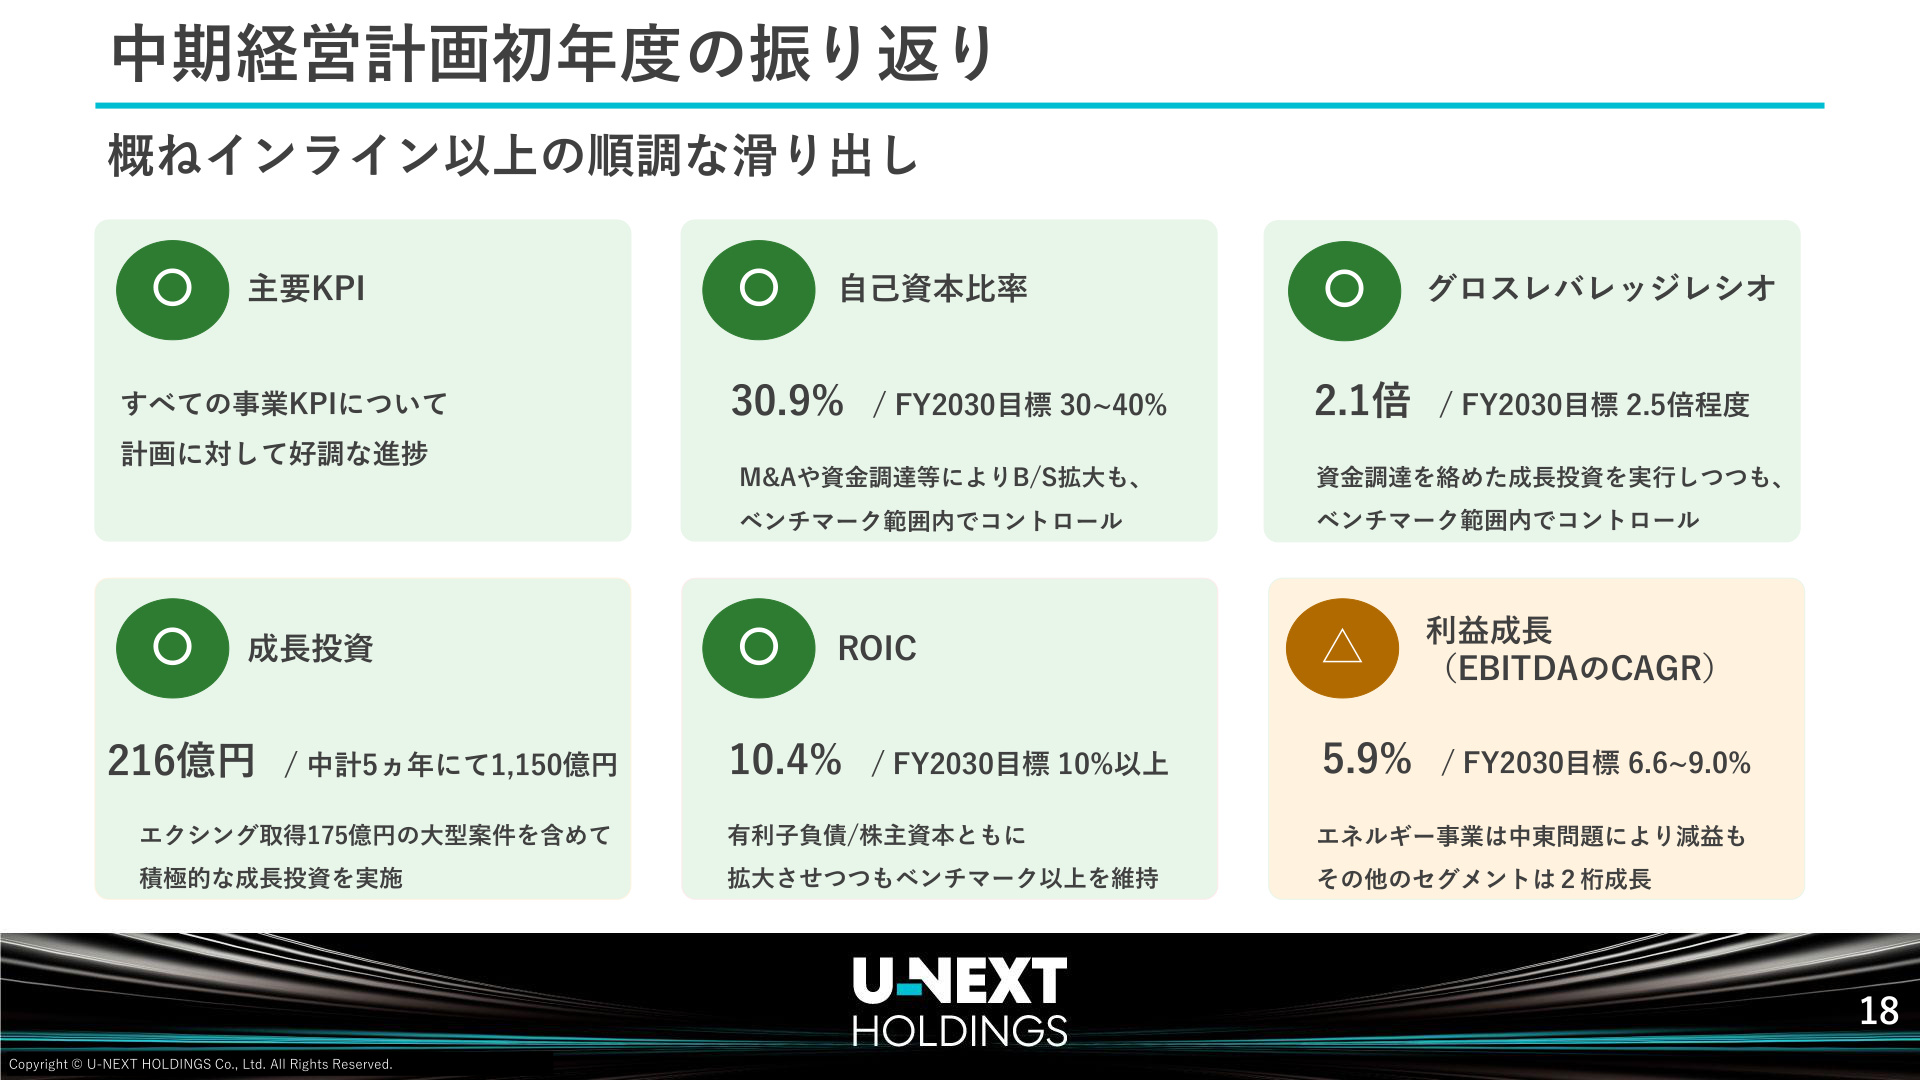
This slide comprehensively shows the achievement level of the mid-term plan's KPIs and the control status of financial health.
- Progress of Business KPIs (Rating: Good) : Major KPIs in all business segments, such as 5.4 million streaming members and 1.3 million store solution contracts, are performing well against the plan.
- Execution of Aggressive Growth Investment (Rating: Good) : Out of the 115 billion yen growth investment framework planned for the five-year mid-term period, 21.6 billion yen (including 17.5 billion yen for the Xing acquisition) was flexibly invested in the first year.
- Solid Capital Efficiency and Financial Health (Rating: Good) : Although interest-bearing debt increased to 97.8 billion yen (+29 billion yen from the end of the previous fiscal year) due to large-scale investments and M&A, the equity ratio is 30.9% (mid-term plan target 30–40%) and the gross leverage ratio is 2.1x (mid-term plan target approx. 2.5x), strictly controlled within the safety benchmark range. Furthermore, ROIC (Return on Invested Capital) recorded 10.4% , maintaining the target value of 10% or higher.
- Profit Growth Rate Challenges (Rating: Fair) : The EBITDA growth rate was +5.9% in CAGR terms, slightly below the mid-term plan target (6.6–9.0%). However, as mentioned above, this is due to temporary factors in the energy business, and the other three segments achieved double-digit profit growth.
Cash Flow and Shareholder Returns
Regarding cash flow, cash flows from operating activities were a positive 23.744 billion yen (up 3.072 billion yen year-on-year), while cash flows from investing activities, including M&A and capital expenditures, resulted in expenditures of 44.241 billion yen. These investment expenditures were covered by financing activities (cash flows from financing activities +22.132 billion yen), primarily through borrowing. Regarding the dividend policy, the company implemented a dividend payout ratio of 20.5% (total annual dividend of 3 billion yen), continuing a stable return stance in line with the mid-term plan target (payout ratio of 20–30%).
5. Conclusion: Future Focus Points
The financial results for the fiscal year ended August 2026 proved that the depth of the business foundation has further increased through the expansion of revenue to 469.9 billion yen and the achievement of an 83% recurring ratio. While facing the clear challenge of a downward trend in the energy business due to external factors, the diversification of revenue sources—such as the effects of the NBCUniversal partnership in content distribution, synergies from store DX and karaoke integration, and the expansion of peripheral areas like cashless payments—is functioning as a support. Going forward, the pace of profit recovery through improvements in energy business procurement and the full-scale monetization of M&A projects will determine the growth speed of the entire group.
This content is not intended as investment advice or a recommendation. Any opinions expressed are solely the personal views of each article.