

Kohnan Shoji Q2 FY2027 Financial Results: Achieving Revenue and Profit Growth Driven by PRO Format Expansion and Strategic Investments

Sentiment Analysis

Introduction
Major home improvement retailer Kohnan Shoji Co., Ltd. (Securities Code: 7516) has announced its financial results for the second quarter of the fiscal year ending February 2027. As the company actively pursues upfront investments under its 4th Medium-Term Management Plan (FY2026–FY2028) to "build the foundation for the future," the first half of the fiscal year saw significant year-on-year growth in both revenue and profit at all levels, exceeding initial plans. This performance was supported by robust demand for petroleum-derived industrial products, air conditioning-related materials, and seasonal summer goods.
This report provides a detailed analysis based on disclosed materials, covering 10 key topics ranging from performance highlights and profit variance factors to progress by business format and product category, financial position, and long-term growth strategies centered on the PRO format.
1. Consolidated Financial Highlights: Strong Results Exceeding Plans Across All Profit Lines
For the first half of the fiscal year, consolidated net sales were 277.82 billion yen (up 8.4% year-on-year) , operating profit was 17.662 billion yen (up 20.1% year-on-year) , ordinary profit was 16.435 billion yen (up 19.7% year-on-year) , and profit attributable to owners of parent was 10.364 billion yen (up 18.8% year-on-year) .
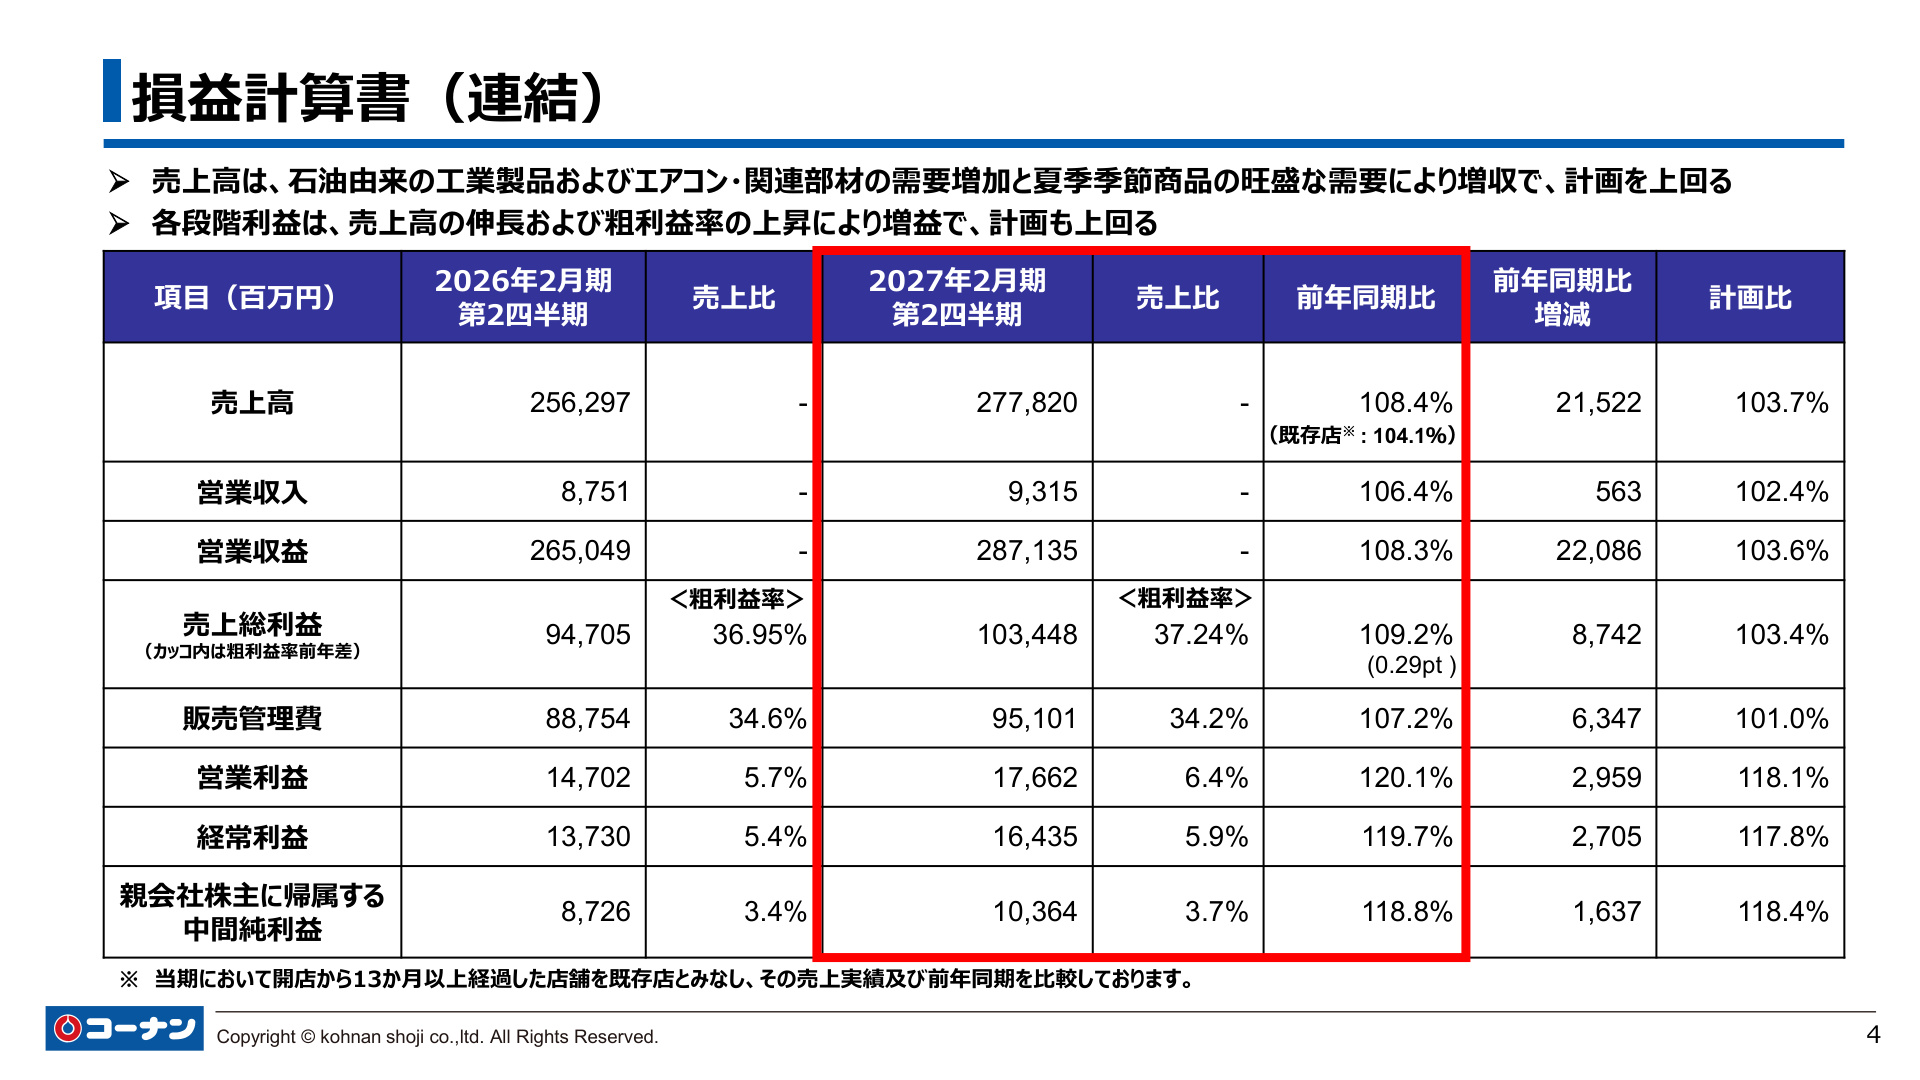
As shown in this income statement slide, net sales reached 103.7% of the plan, and operating profit reached 118.1%, indicating a pace significantly ahead of the initial full-year forecast. The primary drivers of revenue growth were increased demand for air conditioning and seasonal goods due to the extreme heat, as well as sustained demand for materials and tools from PRO customers. Furthermore, the gross profit margin improved to 37.24% (+0.29pt year-on-year) , allowing the company to absorb the increase in selling, general and administrative (SG&A) expenses associated with business expansion and record an operating profit margin of 6.4% (+0.7pt year-on-year) .
Looking at the quarterly trends (March–May, June–August), operating profit in the first quarter saw a strong start with a 42.8% year-on-year increase, and the second quarter alone maintained a growth trend with net sales at 104.9% of the previous year.
2. Analysis of Operating Profit Variance: Price Control and Revenue Growth Absorb Higher SG&A Expenses
An analysis of the 2.959 billion yen year-on-year increase in operating profit reveals a healthy profit structure where growth factors outweigh cost increases.
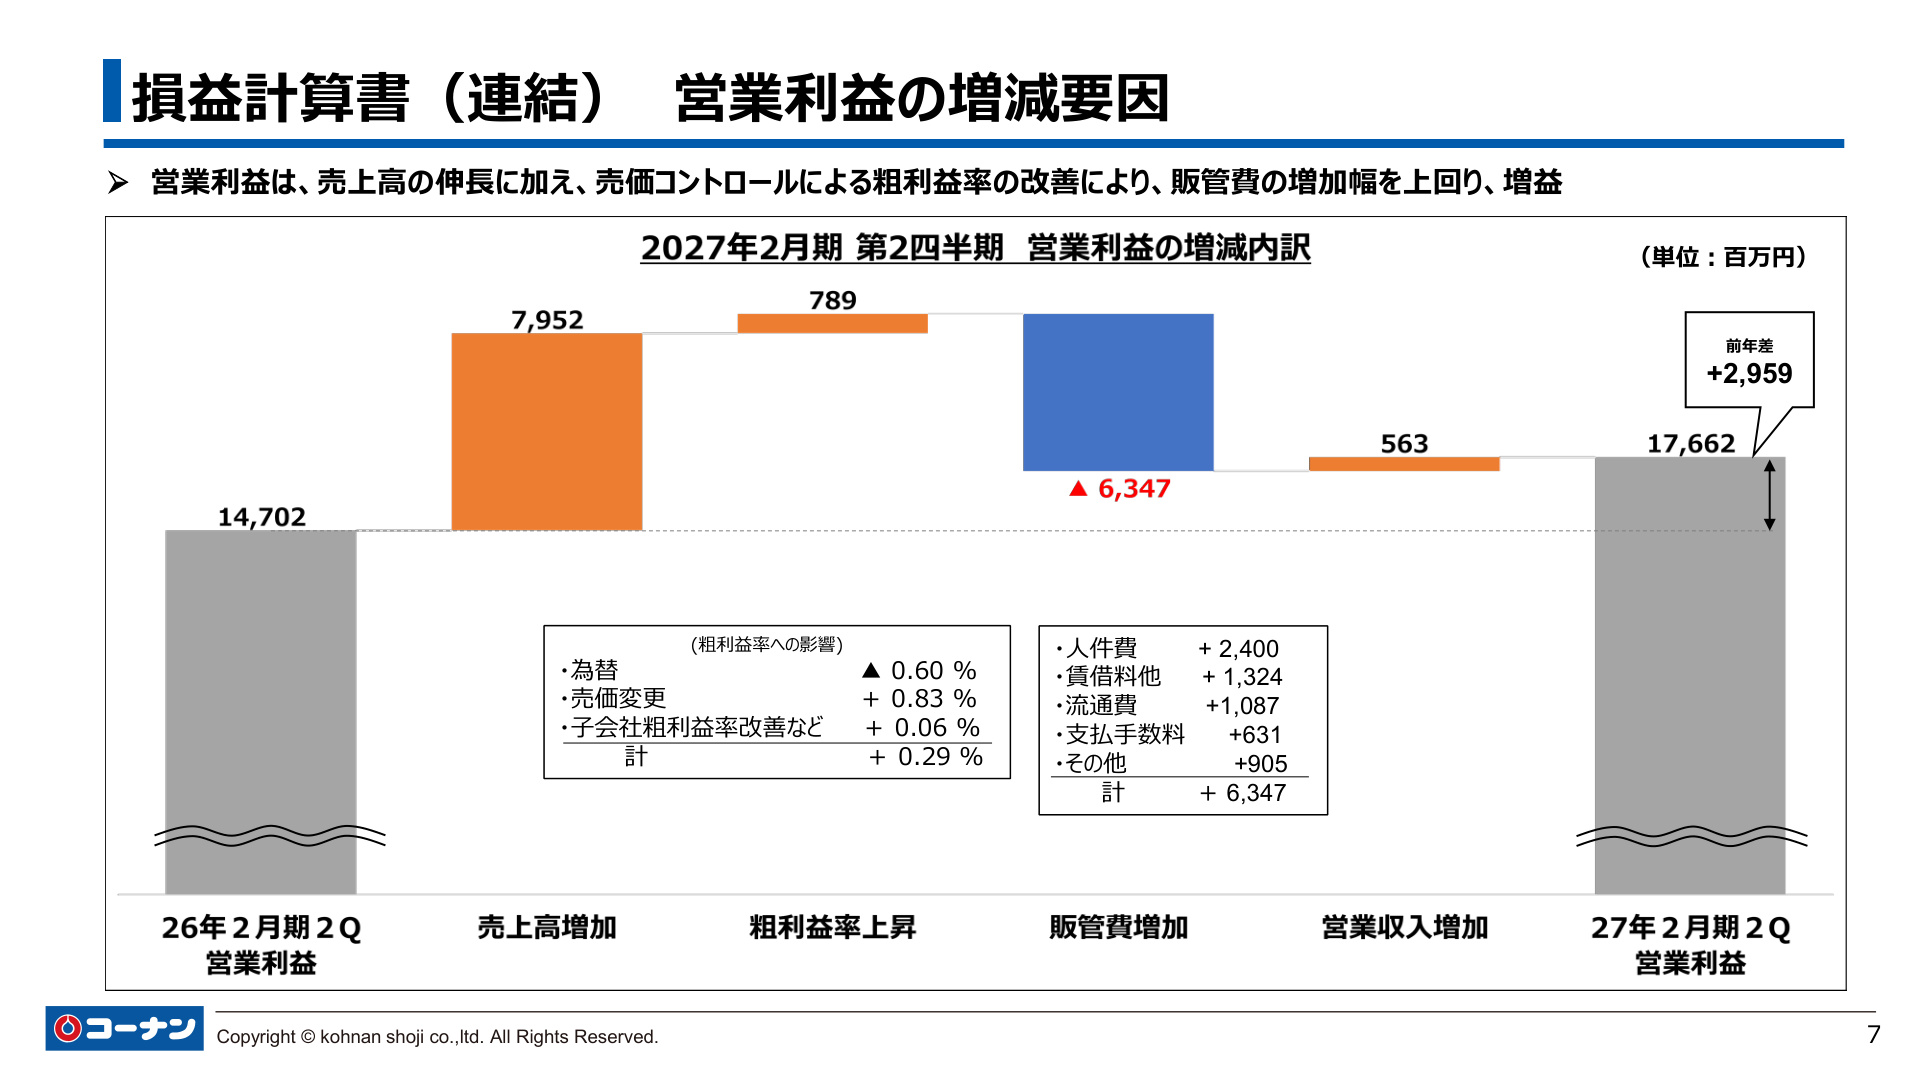
As shown in the slide above, the largest contributor to profit growth was the increase in net sales (+7.952 billion yen) . Additionally, the negative impact of foreign exchange rates (a 0.60% impact on the gross profit margin) was offset by agile price adjustments (+0.83%) and improved gross margins at subsidiaries (+0.06%), creating a gross profit margin improvement factor of +789 million yen . The increase in other operating revenue (+563 million yen) also contributed to the results.
On the expense side, SG&A expenses increased by 6.347 billion yen , primarily due to personnel costs (+2.4 billion yen), rent and other expenses (+1.324 billion yen), and distribution costs (+1.087 billion yen). However, due to the revenue growth effect, the consolidated SG&A expense ratio decreased from 34.6% in the same period last year to 34.2% (-0.4pt) , indicating that fixed cost burdens are being appropriately controlled through sales growth.
3. Existing Store Trends: Driven by Higher Average Spending per Customer, Outperforming Industry Averages
Regarding existing store performance, consolidated existing store sales were up 4.1% year-on-year , significantly outperforming the +1.5% average of nine listed home improvement retailers.
In terms of breakdown, while the number of customers remained nearly flat at -0.1% , growth was driven by a 4.2% increase in average spending per customer . In addition to appropriate product price revisions, the acquisition of bulk-buying demand and the promotion of larger-volume products contributed to the rise in average spending. By business format, while general home centers (HC) saw a 2.9% increase in existing store sales, the PRO format showed exceptionally high growth at +6.9% .
4. Performance by Business Format: A Dual-Pillar Structure of General HC and PRO Formats
Consolidated net sales by business format (at the store level) show solid performance in both segments:
- HC Format : Net sales of 182.417 billion yen (up 4.7% year-on-year), gross profit margin of 38.65% (+0.04pt), operating profit margin of 7.2% (+0.3pt)
- PRO Format : Net sales of 83.657 billion yen (up 12.0% year-on-year), gross profit margin of 34.03% (+0.29pt), operating profit margin of 7.4% (+0.6pt)
The PRO format not only achieved double-digit revenue growth but also demonstrated higher profitability than the HC format, with an operating profit margin of 7.4% (compared to 7.2% for HC), driven by appropriate product pricing in response to rising raw material costs and the expansion of private brand (PB) products.
5. Trends in Group Subsidiaries: Expansion of the PRO Business Centered on Ken-Depot
In terms of sales and gross margin performance by subsidiary, Ken-Depot , which operates a membership-based wholesale business for construction materials for professionals, remained strong with net sales of 29.575 billion yen (up 8.3% year-on-year) and a gross profit margin of 31.40% (+0.67pt). The PB sales ratio also rose to 22.5%.
Kyushu-based HI Hirose recorded net sales of 12.865 billion yen (up 3.6% year-on-year, with HC/PRO up 6.4%). Furthermore, the overseas business, Kohnan Vietnam , grew due to the impact of new store openings, with net sales of 2.32 billion yen (up 14.0% year-on-year) and a gross profit margin of 35.96% (+0.74pt), indicating progress in domestic and international site development.
6. Sales by Product Category and Strengthening of PB Development Capabilities
Consolidated net sales by product category are as follows:
- Home Improvement (DIY, PRO goods, gardening, renovation) : 133.202 billion yen (up 7.9% year-on-year, 47.9% of total sales)
- Housekeeping (household goods) : 89.867 billion yen (up 12.8% year-on-year, 32.3% of total sales)
- Pets/Leisure : 37.261 billion yen (up 1.8% year-on-year, 13.4% of total sales)
In terms of company-wide PB product development , approximately 2,300 SKUs were newly developed by the end of the second quarter. Consolidated PB sales reached 85.655 billion yen, with the sales ratio expanding to 35.1% (+0.2pt year-on-year) . Differentiated products that combine functionality and affordability, such as the "Handy Turbo Fan" and the "Agura-no-kakeru Chair" (cross-legged chair), which were featured in TV commercials, have gained strong support.
7. Financial Foundation and Strategic Capital Alliances/Capital Investments
As of the end of the second quarter of the fiscal year ending February 2027, total assets were 540.132 billion yen (an increase of 35.338 billion yen from the end of the previous fiscal year), and total net assets were 185.883 billion yen (an increase of 12.034 billion yen). The equity ratio is 34.3% , and the D/E ratio (interest-bearing debt ÷ net assets) is 1.26x , maintaining the level seen at the end of the previous fiscal year.
Capital investments totaled approximately 33.9 billion yen , reaching a progress rate of approximately 75.3% against the annual plan of 45 billion yen. Of this, approximately 24.9 billion yen was allocated to investments in Alenza Holdings and Valor Holdings (investment in affiliates and investment securities) with an eye toward industry restructuring and synergy creation, while the majority of the remaining 9 billion yen was invested in new store openings and renovations.
8. Full-Year Forecast for FY2027 and Progress Status
The full-year consolidated earnings forecast remains unchanged from the initial plan:
- Operating Revenue : 543.5 billion yen (up 4.6% year-on-year)
- Net Sales : 525 billion yen (up 4.6% year-on-year)
- Operating Profit : 23 billion yen (up 2.7% year-on-year)
- Ordinary Profit : 21 billion yen (up 1.2% year-on-year)
- Profit Attributable to Owners of Parent (Full-year forecast) : 12.5 billion yen (up 1.9% year-on-year)
At the end of the interim period, the progress rate against the full-year plan is 52.9% for net sales, 76.8% for operating profit, 78.3% for ordinary profit, and 82.9% for profit attributable to owners of parent, showing a very high level of progress across all profit items. The second-half plan is based on cautious assumptions, anticipating a year-on-year decline in profit (second-half operating profit plan: 5.337 billion yen).
9. Store Opening Strategy and Area Strategy: Concentrated Expansion of the PRO Format
In terms of store openings, the strengthening of the high-profitability PRO format network is clear.
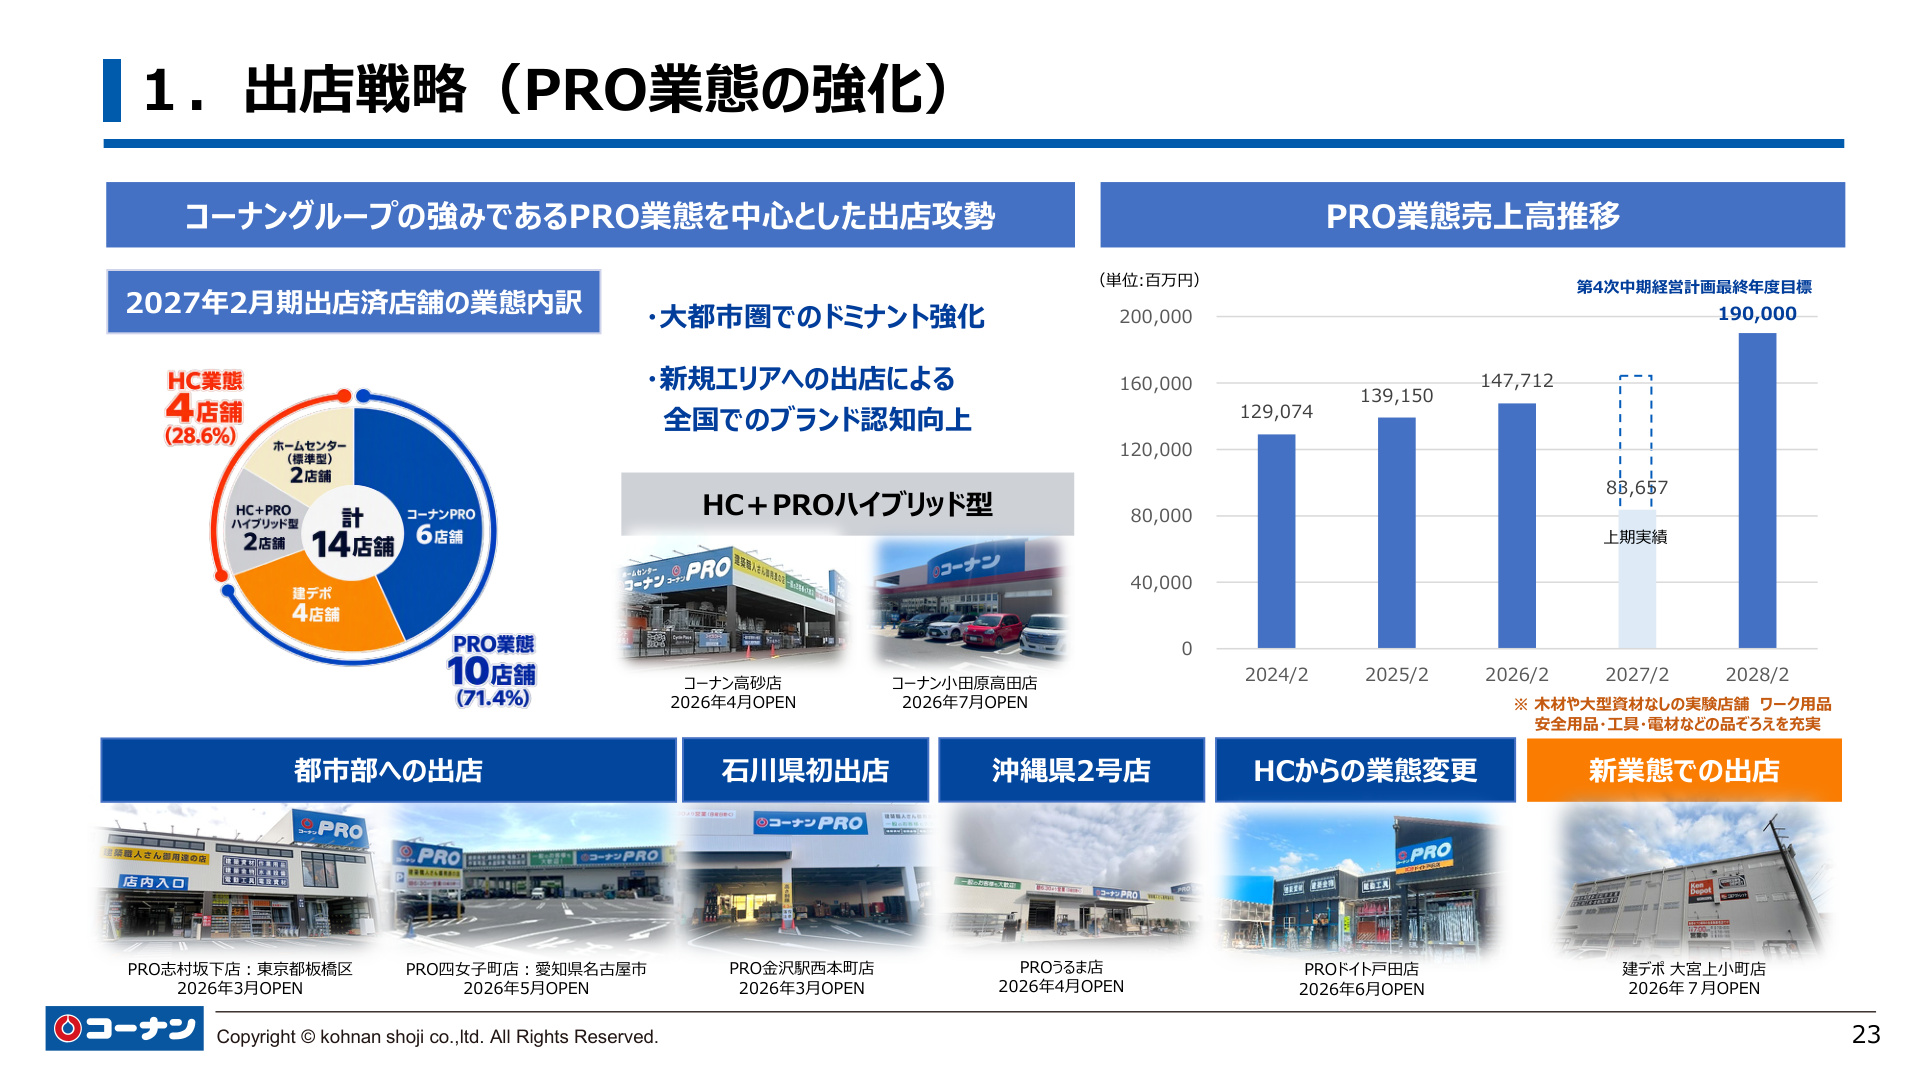
As shown in the slide above, of the 14 new stores opened by the second quarter, 10 stores (71.4%) are PRO format (6 Kohnan PRO stores, 4 Ken-Depot stores). While strengthening the dominant position in major metropolitan areas (such as the PRO Shimura-Sakashita store in Itabashi-ku, Tokyo), the company is also accelerating the development of new areas, such as its first store in Ishikawa Prefecture and its second store in Okinawa Prefecture. By the end of the fiscal year ending February 2027, the total number of PRO stores in the group is expected to reach 270 (a total including 167 Kohnan PRO stores, 100 Ken-Depot stores [including FC], and 3 HI Hirose PRO stores).
In terms of regional sales composition, Kinki accounts for 42.2% and Kanto for 29.7%, with these two major commercial areas accounting for over 70% of total sales. PRO store openings in these high-density areas support efficient logistics and sales operations.
10. Multi-faceted Strategies Supporting the Medium-Term Management Plan (Food, Renovation, DX, Logistics)
As key measures of the Medium-Term Management Plan, the following structural reforms and deepening strategies are underway:
- Food Strategy (Foodspot) : In stores that introduced "Foodspot," which enhances food and frozen/refrigerated sections, the number of customers in the food department increased significantly compared to before the renovation (178%–309%), and the total number of customers visiting the target stores also increased by approximately 10% .
- Renovation Strategy : Renovation sales in the first half grew to 105.4% year-on-year . High-unit-price products such as exterior wall painting (up 126.1%) and solar power/storage batteries (up 120.0%) drove growth.
- Fan Engagement/Digital Strategy : The number of members of the official app "Kohnan Plus" has surpassed 1.6 million (105% of the plan). The average spending per member is 3,970 yen, which is 1,051 yen higher than the average for all customers, contributing to improved customer engagement.
- Logistics Strategy : The company is promoting efficiency in anticipation of the "2024 problem" by consolidating operations at the HI Hirose Chikushino base in the Kyushu region, reviewing operations at the Osaka Bay and Kaizuka centers, and implementing regular autonomous truck transport.
Summary
Kohnan Shoji's financial results for the second quarter of the fiscal year ending February 2027 achieved significant revenue and profit growth by accurately capturing the solid demand for materials and tools and seasonal factors. The company is steadily laying the groundwork to solidify its long-term growth foundation through store expansion centered on the PRO format, an increase in the PB ratio, and capital alliances with Alenza HD and Valor HD. While maintaining a cautious plan for the second half, the results confirm a high rate of progress and a robust business portfolio.
This content is not intended as investment advice or a recommendation. Any opinions expressed are solely the personal views of each article.