

Nomura Co., Ltd. Q2 FY2026 Earnings Deep Dive: Record-High Backlog Positions Company for Mid-Term Plan Success Despite Rebound from Large-Scale Projects

Sentiment Analysis
Introduction: Overview of Financial Results and Purpose of This Report
Nomura Co., Ltd. (TSE Prime: 9716), a leading Japanese company in the space display industry, has released its financial results for the second quarter of the fiscal year ending February 2027 (Q2 FY2026).
For the first half of the fiscal year, the company reported a year-on-year decline in both revenue and profit at all levels. This was primarily due to the reactionary decline following the large-scale, one-off demand seen in the same period last year (related to the Expo 2025 Osaka, Kansai and major urban redevelopment projects). However, demand remains extremely robust, driven by the need for renovations and new construction of hotels and lodging facilities due to the inbound tourism recovery, as well as demand for PR facilities aimed at enhancing corporate brand value.
As a result, cumulative orders received in the first half reached a record high of 91.971 billion yen , and the order backlog also hit a record high of 88.844 billion yen . This report provides a detailed analysis of the disclosure materials, covering current profit trends, performance by sector, the structure of the record-breaking order portfolio, and progress on the 2026-2028 Mid-Term Management Plan and capital allocation policy.
1. Q2 FY2026 Earnings Highlights and Profit Structure Analysis
Revenue and Profit Decline Due to Rebound from Previous Year's Large-Scale Demand
Consolidated financial results for the first half of FY2026 are as follows:
- Net Sales : 73.322 billion yen (down 9.0% YoY, down 7.212 billion yen)
- Gross Profit : 14.766 billion yen (down 9.7% YoY, down 1.586 billion yen)
- Operating Profit : 5.261 billion yen (down 23.7% YoY, down 1.633 billion yen)
- Ordinary Profit : 5.426 billion yen (down 22.8% YoY, down 1.601 billion yen)
- Net Income Attributable to Owners of Parent : 3.412 billion yen (down 23.2% YoY, down 1.030 billion yen)
In the same period of the previous year (Q2 FY2025), sales surged to 80.534 billion yen due to the concentration of pavilion-related construction for the Expo 2025 Osaka, Kansai and large-scale complex redevelopment projects in the Tokyo metropolitan area. The current period reflects the reactionary decline from these factors.
Maintaining a Gross Profit Margin in the 20% Range Despite Rising Labor Costs
While the construction and interior design industry continues to face soaring labor costs and high prices for materials and energy, Nomura’s gross profit margin remains at a high level of 20.1% (down 0.2 percentage points from 20.3% in the same period last year). This success is attributed to the steady implementation of appropriate price pass-throughs and profitability improvement measures for each project.
Factors Behind SG&A Expenses and Operating Profit Waterfall
Selling, General and Administrative (SG&A) expenses totaled 9.504 billion yen (up 0.5% YoY, up 46 million yen). A breakdown shows that personnel expenses rose to 5.846 billion yen (up 1.0% YoY, up 59 million yen) due to an increase in headcount and improved compensation. Conversely, other expenses were contained at 3.657 billion yen (down 0.3% YoY, down 12 million yen) due to a decrease in depreciation. With the decline in net sales, the SG&A-to-sales ratio rose to 12.9% (up 1.2 percentage points YoY) .
The breakdown of the year-on-year change in operating profit (down 1.633 billion yen) is as follows:
- Decrease in gross profit due to lower net sales: down 1.464 billion yen
- Impact of lower gross profit margin (down 0.2P): down 123 million yen
- Impact of increased personnel expenses: down 59 million yen
- Profit boost from reduced expenses: up 12 million yen
It is clear that the decline in operating profit is primarily due to the drop in gross profit resulting from the decline in the top line, rather than a significant deterioration in the gross profit margin.
2. Trends in Net Sales and Gross Profit Margin by Market Sector
Structural changes in demand are clearly reflected in the net sales by market sector for the current period.
- Specialty Stores : Net Sales 20.156 billion yen (down 4.3% YoY) / Gross Profit Margin 19.7% (+1.2P)
- Department Stores & Mass Retailers : Net Sales 1.959 billion yen (up 7.8% YoY) / Gross Profit Margin 26.5% (+3.0P)
- Commercial Complexes : Net Sales 6.769 billion yen (down 26.9% YoY) / Gross Profit Margin 20.3% (down 4.8P)
- PR & Sales Promotion : Net Sales 8.262 billion yen (up 9.9% YoY) / Gross Profit Margin 21.7% (+2.1P)
- Museums & Art Galleries : Net Sales 4.367 billion yen (up 1.4% YoY) / Gross Profit Margin 18.7% (+2.1P)
- Leisure Facilities : Net Sales 14.104 billion yen (up 22.7% YoY) / Gross Profit Margin 16.8% (down 4.5P)
- Exhibitions & Events : Net Sales 1.645 billion yen (down 84.8% YoY) / Gross Profit Margin 25.2% (+2.9P)
- Other Markets : Net Sales 16.058 billion yen (up 12.8% YoY) / Gross Profit Margin 21.8% (+3.1P)
Revenue growth was driven by the "PR & Sales Promotion" market, where corporate showrooms and visitor facilities remain strong; the "Leisure Facilities" market, which benefited from hotel renovations and theme park decorations due to inbound demand; and the "Other Markets" sector, which saw an increase in office projects. Conversely, the "Commercial Complexes" (down 26.9%) and "Exhibitions & Events" (down 84.8%) markets, which had a concentration of large-scale projects in the same period last year, were the primary factors for the decline in revenue.
3. Rapid Expansion of Orders Received and Backlog: Future Growth Drivers
In this quarterly report, the most important data for assessing future performance is the trend in orders received and the order backlog .
Slide Commentary: Why This Slide is the Most Important Indicator
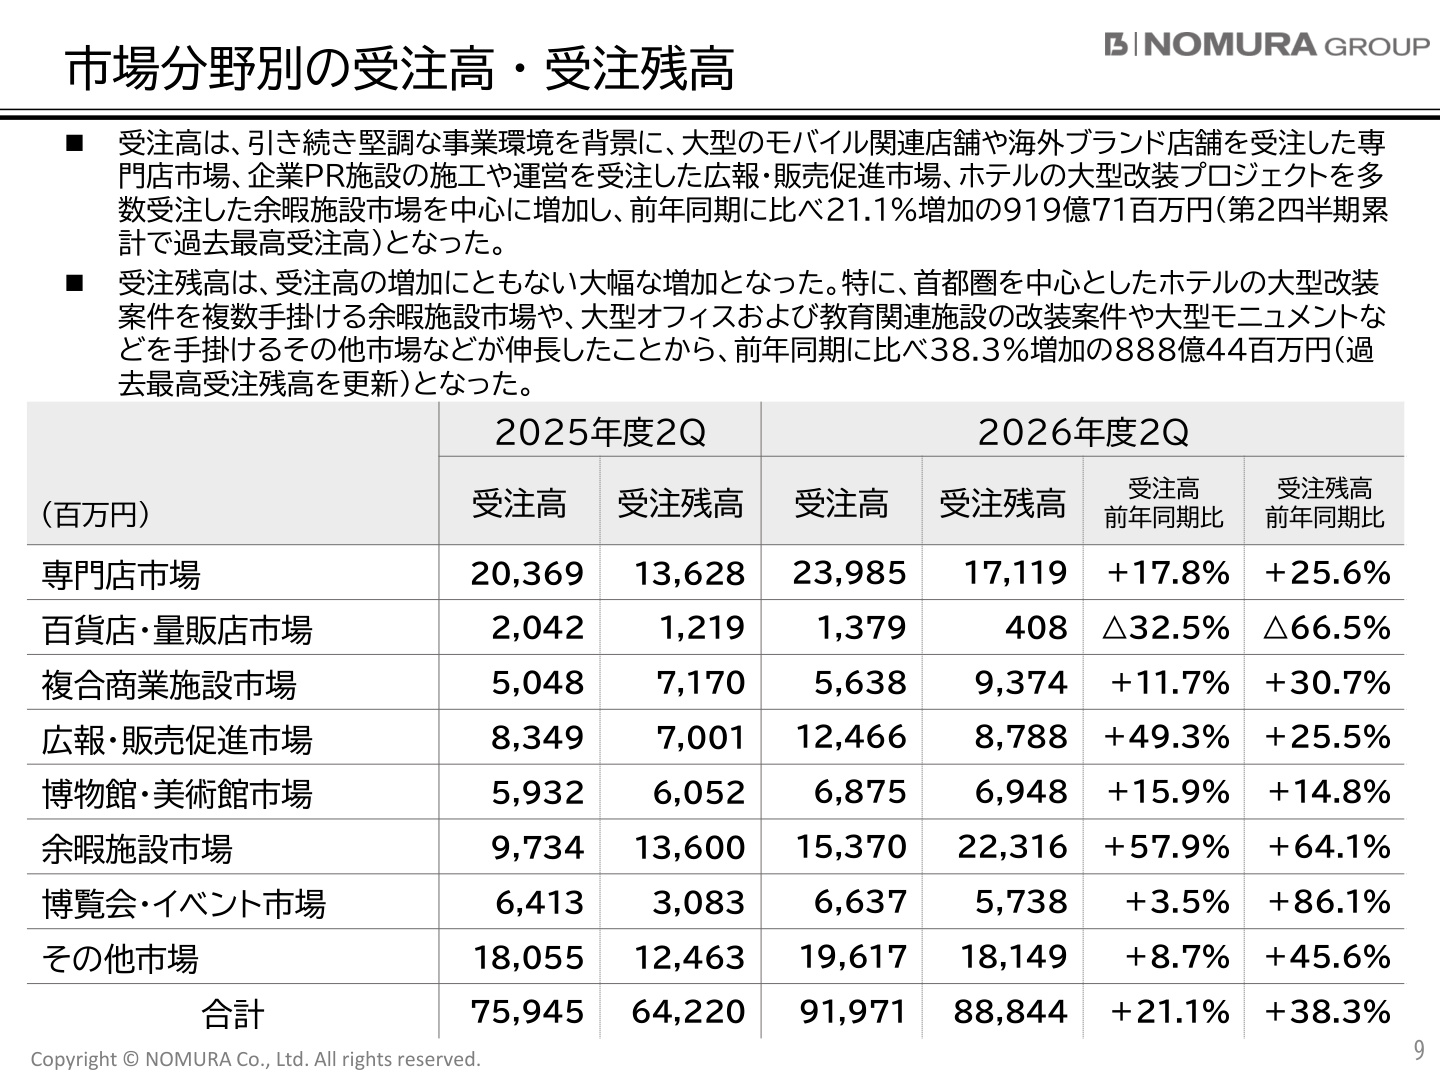
As shown in the slide above (p9), orders received in the first half of FY2026 reached 91.971 billion yen (up 21.1% YoY) , marking a record high for the first half . Furthermore, the order backlog at the end of the period was 88.844 billion yen (up 38.3% YoY) , which also significantly updated the record high for the order backlog .
While the current income statement shows a decline in revenue and profit, these order trends indicate that the company's business activities are extremely robust and the potential sales pipeline is expanding rapidly. A detailed look at the sectors reveals the following characteristics:
- Leisure Facilities : Orders 15.370 billion yen ( up 57.9% ), Backlog 22.316 billion yen ( up 64.1% )
- Driven by the acquisition of multiple large-scale hotel renovation projects, primarily in the Tokyo metropolitan area.
- PR & Sales Promotion : Orders 12.466 billion yen ( up 49.3% ), Backlog 8.788 billion yen ( up 25.5% )
- Significant growth in contracts for the construction and operation of corporate PR facilities.
- Specialty Stores : Orders 23.985 billion yen ( up 17.8% ), Backlog 17.119 billion yen ( up 25.6% )
- Steady orders for large mobile-related stores and overseas luxury brand stores.
- Other Markets : Orders 19.617 billion yen ( up 8.7% ), Backlog 18.149 billion yen ( up 45.6% )
- Secured renovation projects for large offices and educational facilities, as well as large monuments.
The order backlog is accumulating across almost all sectors, creating a structure that is expected to contribute to sales recognition from the second half onward.
4. Full-Year FY2026 Earnings Forecast and Financial Soundness
Full-Year Earnings Plan Remains Unchanged from Initial Forecast
Nomura has maintained its full-year earnings forecast and annual dividend forecast for FY2026 as initially planned.
- Net Sales : 168.000 billion yen (up 3.3% YoY)
- Operating Profit : 13.400 billion yen (up 4.5% YoY)
- Ordinary Profit : 13.600 billion yen (up 4.5% YoY)
- Net Income : 9.250 billion yen (up 1.3% YoY)
- Earnings Per Share (EPS) : 82.89 yen
- Annual Dividend : 44.00 yen (Interim 22.00 yen, Year-end 22.00 yen)
The progress rate against the first-half results is 43.6% for net sales and 39.3% for operating profit. As mentioned above, with a record-high order backlog of over 88.8 billion yen, the company expects to achieve its full-year plan as construction and completion proceed smoothly through the second half. While citing the continuation of inbound demand and steady private investment as underlying conditions, the company stated it will continue to monitor changes in the procurement environment due to the situation in the Middle East.
Financial Position and Cash Flow
- Balance Sheet (B/S) : Total assets decreased by 3.8% from the end of the previous fiscal year to 91.743 billion yen. Contract assets and accounts receivable decreased in line with the reduction in ongoing projects. Total liabilities were 30.912 billion yen (down 7.2% from the end of the previous fiscal year), and total net assets were 60.831 billion yen (down 1.9% from the end of the previous fiscal year).
- Cash Flow (C/F) : Cash flow from operating activities was a positive 9.791 billion yen (compared to 3.450 billion yen in the same period last year), showing a significant increase in cash generation. As a result, the balance of cash and cash equivalents at the end of the quarter reached 42.023 billion yen.
5. Strategic Pillars and Goals of the Mid-Term Management Plan 2026-2028
As social environments change, five areas of demand are rising: "renovation (enhancing existing facility value)," "experiential consumption," "inbound tourism," "high value-added services," and "securing corporate human resources." The company has positioned these as growth opportunities.
Slide Commentary: Growth Roadmap Outlined in the Mid-Term Management Plan 2026-2028
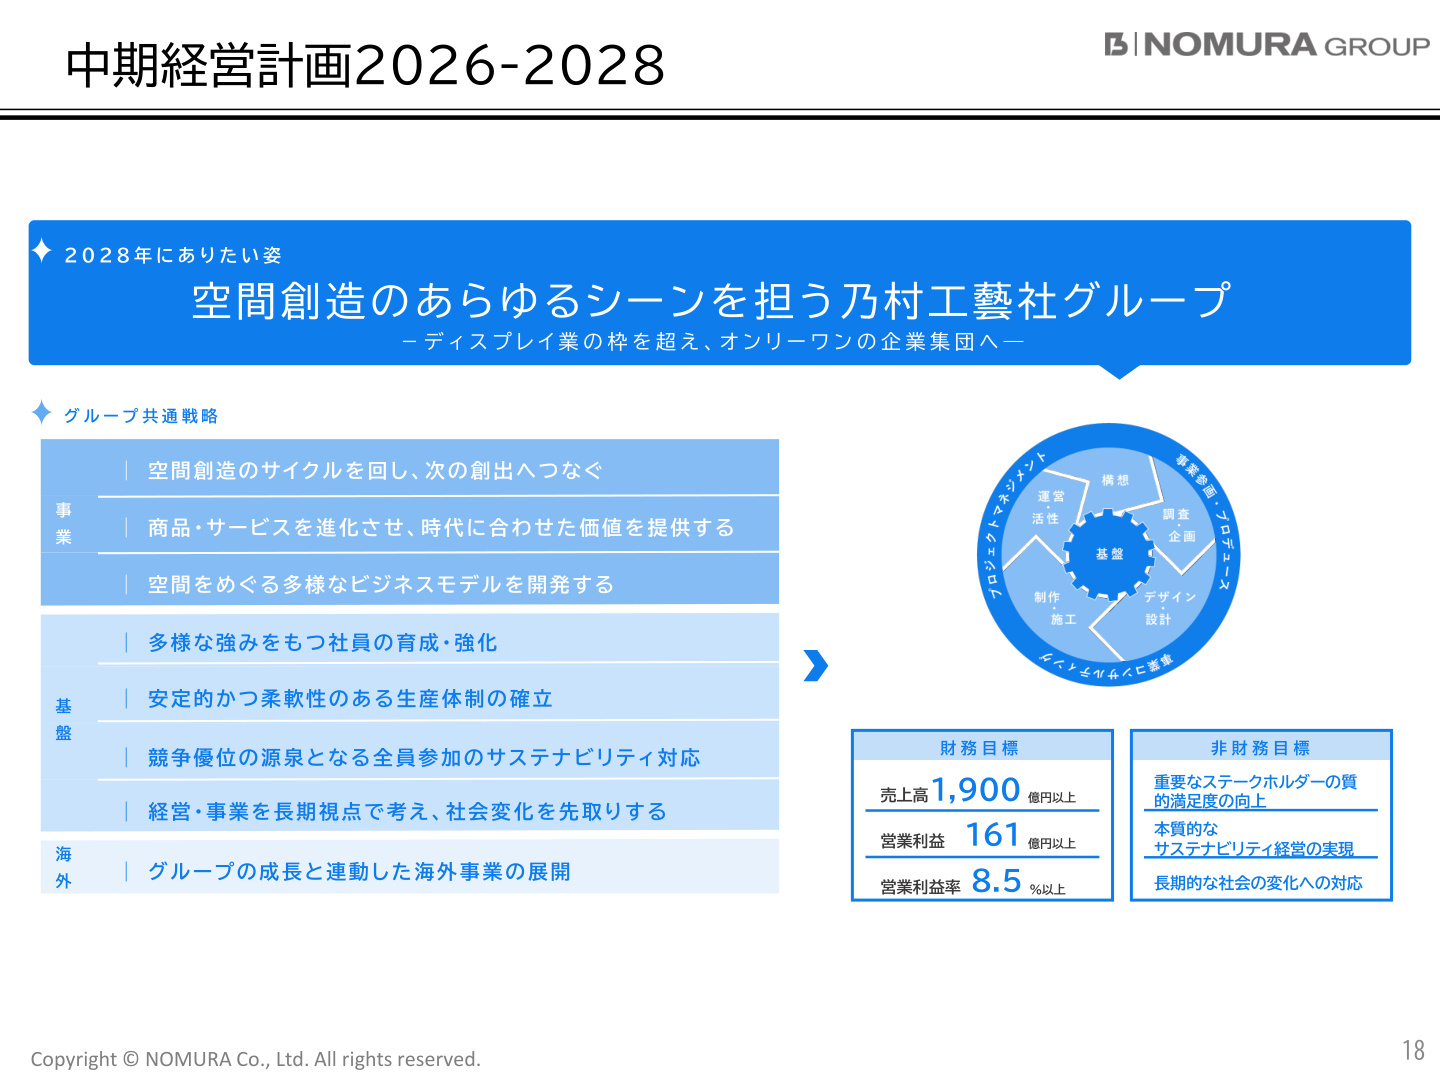
The slide above (p18) shows the overall picture and numerical targets of the Mid-Term Management Plan 2026-2028 leading up to FY2028.
As its "vision for 2028," the company aims to be: "The Nomura Group that handles every scene of space creation — transcending the boundaries of the display industry to become a one-of-a-kind corporate group." It is shifting from the traditional contracting model of "designing, building, and handing over spaces" to a cyclical business model that involves the company from research and planning to operation and revitalization, and even business participation and production.
The financial targets supporting this strategy are as follows:
- Net Sales: 190 billion yen or more
- Operating Profit: 16.1 billion yen or more
- Operating Profit Margin: 8.5% or more
In non-financial terms, the company aims to "improve qualitative satisfaction for stakeholders" and "realize essential sustainability management," with a policy of balancing the sophistication of space value with the stabilization and flexibility of the production system.
Specific examples include the "Villa Mom" postpartum care hotel (responsible for design, construction, and service concept) and the "Happy Lawson Town Ikeda Fushiodai Store" as a community development hub (responsible for one-stop services from research and planning to architecture, landscape, and construction), demonstrating that value creation beyond the scope of contracting is becoming a reality.
6. Capital Allocation and Proactive Shareholder Return Policy
In its capital allocation policy for enhancing corporate value, both growth investment and shareholder returns have been significantly expanded.
Slide Commentary: Dramatic Shift in Capital Allocation
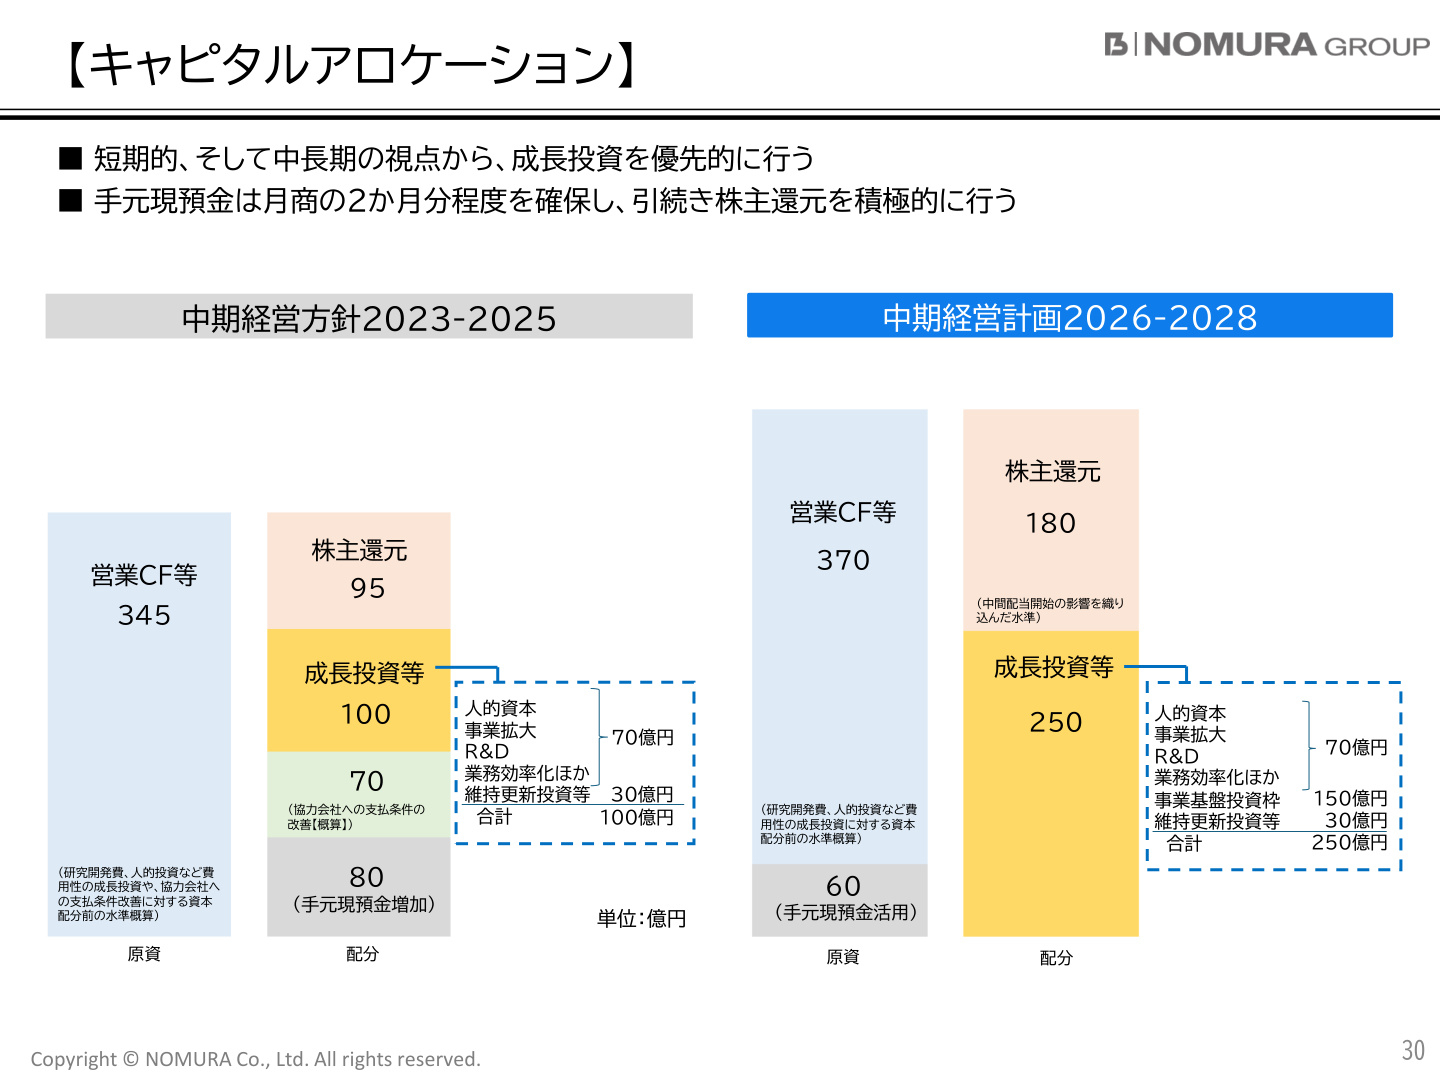
The slide above (p30) compares the use of cash in the previous Mid-Term Management Policy (2023-2025) with the current Mid-Term Management Plan (2026-2028).
During the 2026-2028 period, the company expects a total cash-in of 43 billion yen, consisting of 37 billion yen from operating cash flow and 6 billion yen from existing cash and deposits . This allocation plan represents a dynamic shift compared to the previous plan:
- Expansion of Growth Investment (Surging from 10 billion yen to 25 billion yen)
- New business foundation investment framework: 15 billion yen
- Human capital, business expansion, R&D, and operational efficiency: 7 billion yen
- Maintenance and renewal investment: 3 billion yen
- Expansion of Shareholder Returns (Doubling from 9.5 billion yen to 18 billion yen)
- Planning for a significant increase in returns, backed by the ability to generate operating cash flow and incorporating the impact of starting interim dividends.
Criteria for Shareholder Return Policy
As a basic dividend policy, the company has adopted a generous return standard: "The higher of either a DOE (Dividend on Equity) of 7% or more, or a payout ratio of 50% or more." In FY2025, the company achieved a DOE of 8.1% and a payout ratio of 51.3% (42.0 yen per year), and for FY2026, it plans to increase the dividend to 44.0 yen per year (equivalent to a payout ratio of 53.1%).
7. Conclusion
Although Nomura's Q2 FY2026 earnings showed a temporary decline in revenue and profit due to the rebound from the previous year's large-scale demand, the following key points demonstrate the robustness and growth potential of its business foundation:
- Defense of Profitability : Maintained a gross profit margin of 20.1% even in an inflationary environment.
- Record-High Order Pipeline : Achieved 91.9 billion yen in orders and an 88.8 billion yen backlog in the first half, providing a solid foundation for performance in the second half and beyond.
- Clear Growth Story : Accelerating the expansion of the space business and foundation investments to achieve 190 billion yen in sales and 16.1 billion yen in operating profit under the 2026-2028 Mid-Term Plan.
- Strengthened Shareholder Returns : Adopting a high standard of either a 7% DOE or 50% payout ratio, with a significant increase in return amounts accompanying the expansion of operating cash flow.
The focus moving forward will be on how the abundant order backlog is completed and recognized as sales, overcoming the current reactionary decline.
This content is not intended as investment advice or a recommendation. Any opinions expressed are solely the personal views of each article.