


Gift Holdings FY2026 Q3 Earnings Deep Dive: Strong Same-Store Sales and Manufacturing Efficiency Drive Significant Profit Growth; Full-Year Guidance Revised Upward

StockClub
Published: Sep 14, 2026, 10:19 AM
Sentiment Analysis

Gift Holdings Inc. (Securities Code: 9279) reported strong growth in both revenue and profit for the first nine months of the fiscal year ending October 2026 (3Q cumulative). The company achieved net sales of 32.27 billion yen (+23.6% YoY) , operating profit of 3.718 billion yen (+56.5% YoY) , ordinary profit of 3.719 billion yen (+56.4% YoY) , and net profit attributable to owners of the parent of 2.457 billion yen (+55.9% YoY) . This performance was driven by aggressive domestic and international store openings, robust same-store growth, and improved profit margins resulting from enhanced manufacturing efficiency and optimized ingredient procurement.
This report extracts key topics from the disclosed earnings presentation materials to provide a detailed analysis of performance trends, profit structure, overseas expansion, full-year outlook, and progress on the medium-term management plan.
1. Key Performance Highlights and KPI Trends
Performance indicators for the third quarter cumulative period are trending ahead of the company's medium-to-long-term targets, demonstrating high levels of both growth and profitability.
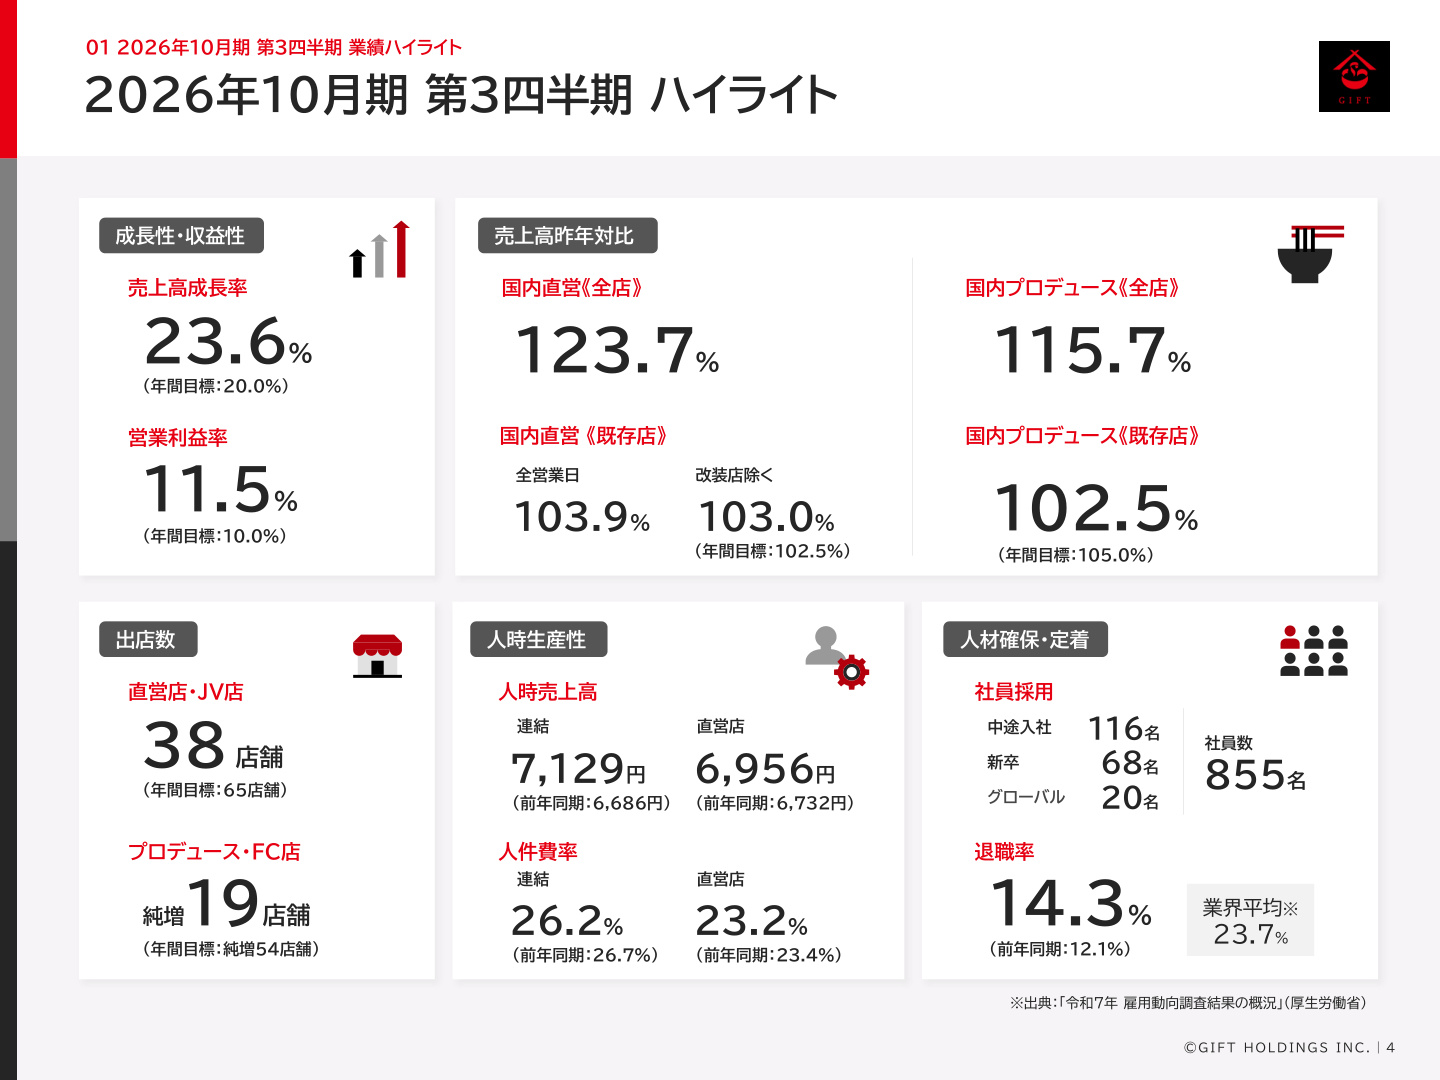
The slide above serves as a critical dashboard illustrating the company's growth drivers and operational health. Key points include:
- Growth and Profitability : The sales growth rate reached 23.6% (annual target: 20.0%), and the operating profit margin stood at 11.5% (annual target: 10.0%), both exceeding their respective goals.
- Domestic Same-Store Sales : Total sales for all domestic directly-operated stores were 123.7% of the previous year, while same-store sales (excluding renovated stores) reached 103.0% (103.9% on a full-business-day basis). Domestic produce stores also performed well at 102.5% .
- Store Opening Progress : The company recorded a net increase of 38 stores for directly-operated and JV stores (annual target: 65) and 19 stores for produce/FC stores (annual target: 54).
- Labor Productivity : Consolidated sales per labor hour improved to 7,129 yen (up from 6,686 yen in the same period last year), while directly-operated stores reached 6,956 yen (up from 6,732 yen). The labor cost ratio decreased to 26.2% on a consolidated basis (down from 26.7%) and 23.2% for directly-operated stores (down from 23.4%), confirming improved productivity.
- Talent Acquisition and Retention : The company hired 116 mid-career, 68 new graduate, and 20 global employees, bringing the total headcount to 855 . The turnover rate remains at 14.3% , significantly lower than the accommodation and food service industry average of 23.7%.
2. Quarterly Performance Trends and Profit Structure Analysis
Despite seasonal fluctuations inherent in the food service industry, the company has consistently expanded its sales scale quarter by quarter.
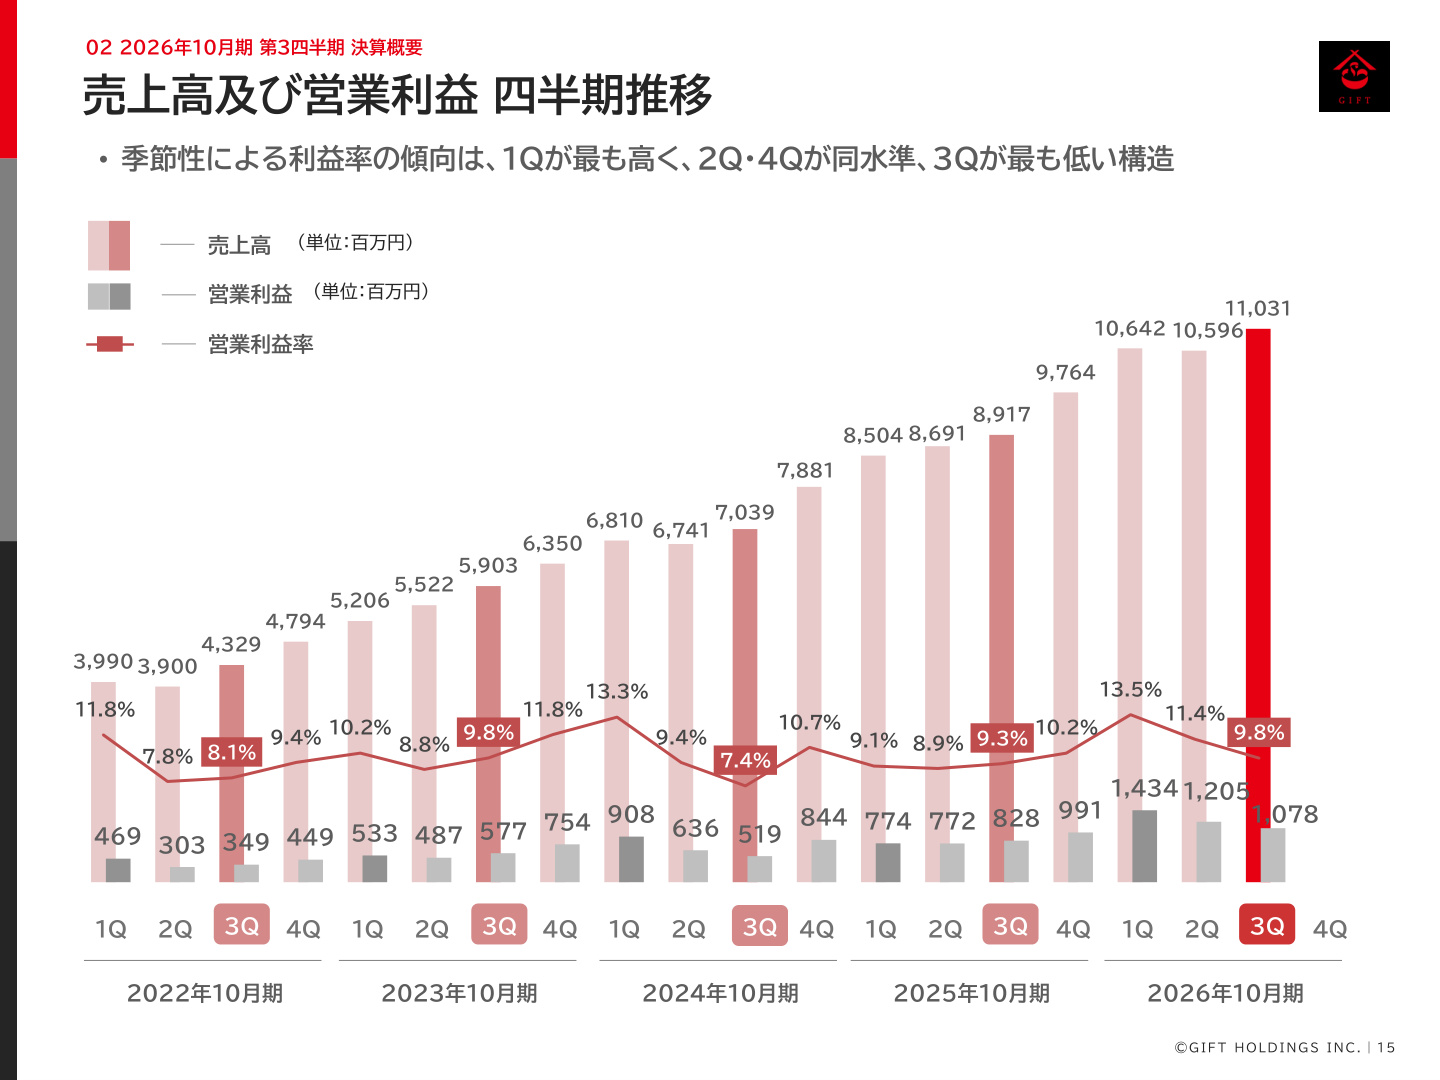
As shown in the quarterly trend graph, the company's profit structure typically sees the highest margins in Q1, similar levels in Q2 and Q4, and relatively lower margins in Q3 due to summer seasonality . However, this fiscal year, following an operating profit of 1.434 billion yen in Q1 (13.5% margin) and 1.205 billion yen in Q2 (11.4% margin), the company secured 11.031 billion yen in sales and 1.078 billion yen in operating profit (9.8% margin) in Q3 alone , despite the seasonal headwinds. Surpassing 11 billion yen in quarterly sales underscores the cumulative effect of store network expansion and same-store sales growth.
Factors Affecting Operating Profit (Q3 standalone vs. YoY)
Operating profit for Q3 (three months) increased from 828 million yen in the same period last year to 1.078 billion yen (+30.2%) .
- Positive Factors : Contribution from new stores (+173 million yen), same-store customer traffic (+86 million yen), reduced store operating costs (+48 million yen), higher same-store average spend (+42 million yen), Produce (PD) business impact (+31 million yen), and reduced impact from renovation closures (+17 million yen).
- Negative Factors : Increased corporate expenses (-100 million yen), higher new store opening costs (-29 million yen), and overseas business (-19 million yen). The structure effectively absorbs corporate strengthening and upfront costs for new stores through increased customer traffic and spending at existing locations.
3. Domestic Store Strategy: Strengthening Existing Stores and Operational Improvements
Progress on the following initiatives is underway for domestic directly-operated stores:
- Extended Hours and Enhanced QSCA : Extended operating hours (including late-night) and continuous improvements in QSCA (Quality, Service, Cleanliness, Atmosphere) have driven customer traffic.
- Increase in Average Sales per Store : The monthly average sales per existing directly-operated store have trended 38% higher compared to the latter half of 2022.
- IH Equipment Installation and Renovations : The installation of IH equipment, aimed at standardizing soup quality and improving the work environment, is expected to be largely completed this fiscal year. Opportunity losses due to renovation closures have decreased significantly compared to the same period last year (full-year impact expected to shrink from -63 million yen to -45 million yen).
- Reduction in Cost of Sales : Due to increased production volume at in-house factories (economies of scale) and optimized ingredient procurement routes, the gross profit margin improved to 67.9% (+1.2pt) from 66.7% in the same period last year.
4. Overseas Expansion Progress and Regional Trends
As of the end of Q3 FY2026, the total number of overseas stores reached 47 (an increase of 11 from the end of the previous fiscal year) , consisting of 11 directly-operated, 25 FC, 9 PD, and 2 JV stores.
- China (7 directly-operated stores) : Promoting expansion into shopping malls. While opening costs are incurred upfront, the domestic success model is being accepted due to the affinity for noodle culture, and profitability per store is trending upward.
- Switzerland (2 JV stores) : Maintaining stable, high profitability driven by high average spend amidst inflation. The second store opened at the end of June.
- USA (3 directly-operated stores) : The third New York store is performing steadily. At the New Jersey store, the shift from self-service to full-service has increased the tip ratio, reducing the burden on labor costs, while efforts to boost sales continue.
- Canada (1 directly-operated store) : Currently in the initial cost-accounting phase following the new opening, with efforts focused on increasing brand awareness and improving operations.
5. Upward Revision of Full-Year Earnings Forecast and Shareholder Returns (Dividend Increase)
Reflecting strong progress, the company revised its full-year consolidated earnings forecast upward (announced August 24, 2026).
| Item | FY2025 Actual | FY2026 Initial Forecast | FY2026 Revised Forecast | YoY Change | vs. Initial Forecast |
|---|---|---|---|---|---|
| Net Sales | 35,878 million yen | 43,000 million yen | 43,900 million yen | +22.4% | +2.1% |
| Operating Profit | 3,367 million yen | 4,300 million yen | 5,000 million yen | +48.5% | +16.3% |
| Ordinary Profit | 3,374 million yen | 4,260 million yen | 4,970 million yen | +47.3% | +16.7% |
| Net Profit | 2,185 million yen | 2,550 million yen | 3,020 million yen | +38.2% | +18.4% |
Progress rates against the revised full-year forecast at the end of Q3 are extremely high: 73.5% for net sales, 74.4% for operating profit, 74.8% for ordinary profit, and 81.4% for net profit. The plan for the second half remains unchanged, anticipating upfront investments for future growth in Q4.
Dividend Increase
Reflecting strong performance, the year-end dividend forecast has been increased by 1.5 yen, from 6.5 yen to 8.0 yen . Combined with the 6.5 yen interim dividend, the annual dividend is planned at 14.5 yen (adjusted for stock splits, up from 11.0 yen in the previous year). This results in an expected dividend payout ratio of 19.2% (targeting the 20% level).
6. Medium-Term Management Plan (FY2026–FY2028) Roadmap
The company has formulated a medium-term management plan to accelerate overseas expansion while leveraging organic growth in its domestic business.
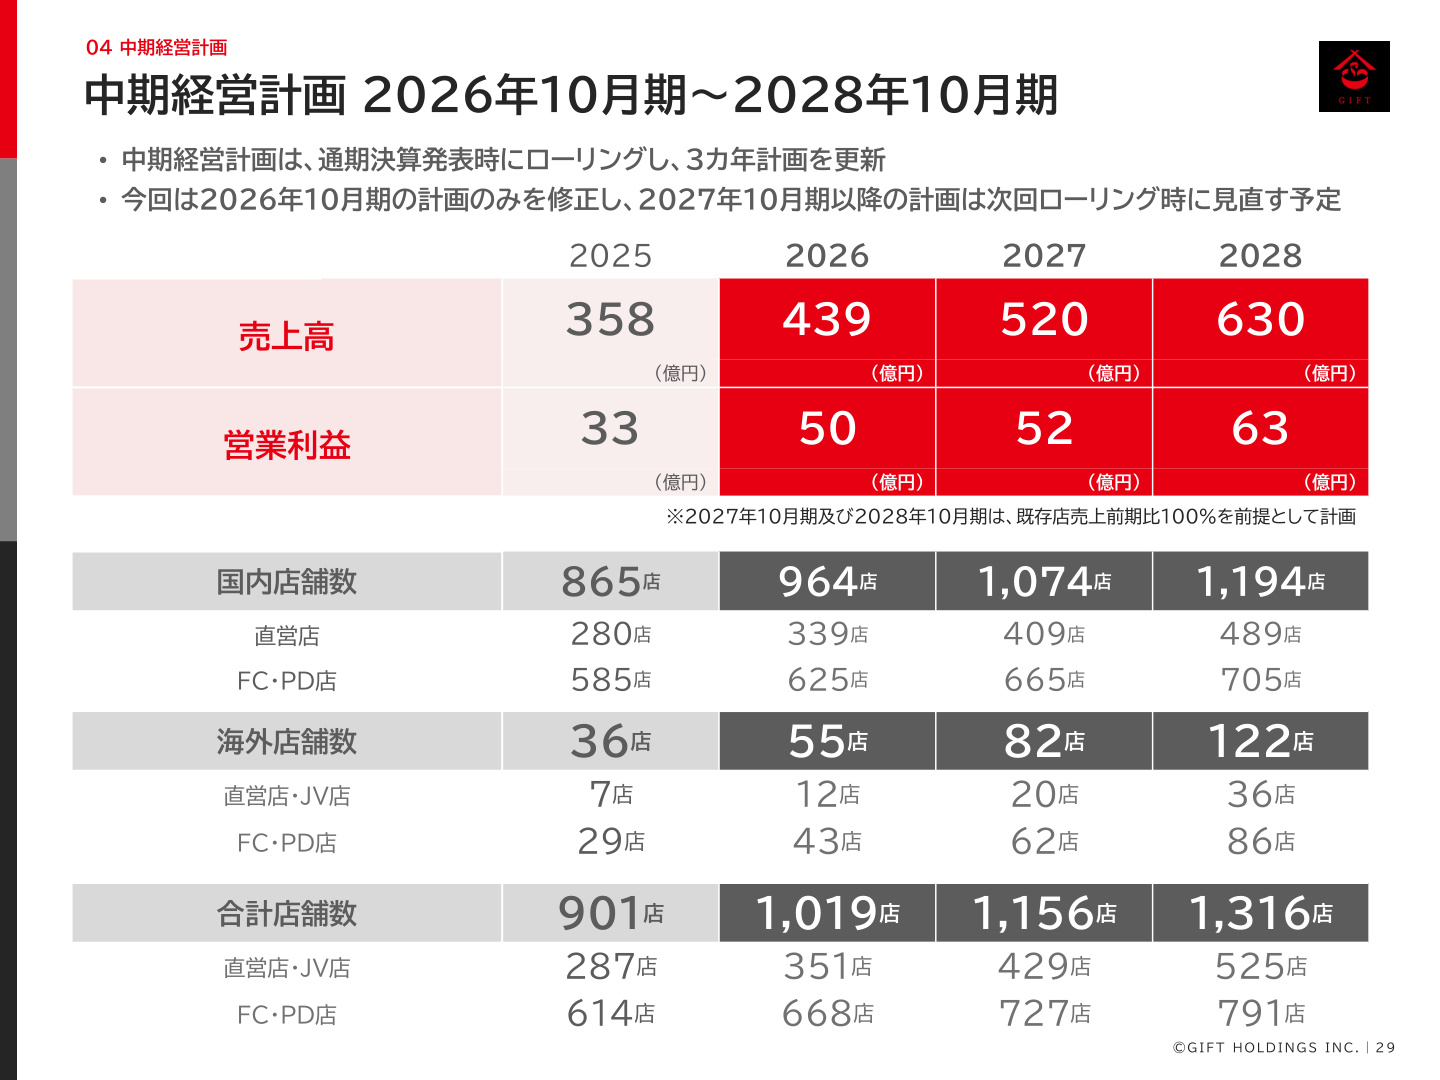
As shown in the slide above, the following targets have been set for the fiscal year ending October 2028:
- FY2028 Financial Targets : 63 billion yen in net sales , 6.3 billion yen in operating profit (10.0% operating profit margin).
- Store Expansion Plan :
- Domestic Stores : 865 (FY2025) → 964 (FY2026) → 1,074 (FY2027) → 1,194 (FY2028) (489 directly-operated, 705 FC/PD).
- Overseas Stores : 36 (FY2025) → 55 (FY2026) → 82 (FY2027) → 122 (FY2028) (36 directly-operated/JV, 86 FC/PD).
- Total Stores : 1,316 stores (525 directly-operated/JV, 791 FC/PD).
- Management KPI Targets : Sales growth rate of 20% or more , operating profit margin of 10% or more , ROE (based on net profit) of 20% or more , and dividend payout ratio of 20% or more .
Summary
Gift Holdings' Q3 FY2026 earnings demonstrate high profitability with an operating profit margin of 11.5%, driven by the recovery in same-store customer traffic and average spend, steady progress in store openings, and reduced cost of sales through economies of scale in manufacturing. The company is on track to achieve its full-year operating profit target of 5 billion yen and continues to expand its business foundation toward the medium-to-long-term goal of 1,316 stores and 63 billion yen in sales.
This content is not intended as investment advice or a recommendation. Any opinions expressed are solely the personal views of each article.