


AB & Company Q3 FY2026 Earnings Deep Dive: 57.7% Surge in Operating Profit Driven by Higher Unit Prices and M&A Synergies

StockClub
Published: Sep 14, 2026, 10:19 AM
Sentiment Analysis
1. Executive Summary
AB & Company Co., Ltd. (Securities Code: 9251), operator of the nationwide "Agu." hair salon chain, reported significant year-on-year growth in both revenue and profit for the third quarter of the fiscal year ending October 2026 (Q3 YTD). Profitability has improved substantially, driven by the contribution of salon acquisitions completed in the previous fiscal year, increased customer unit prices resulting from menu revisions across both directly-operated and franchise (FC) salons, and the optimization of depreciation expenses following a review of the useful lives of fixed assets.
[Q3 YTD Performance Highlights]
- Revenue : ¥16.577 billion (+16.8% YoY)
- Operating Profit : ¥2.082 billion (+57.7% YoY)
- Adjusted EBITDA : ¥2.415 billion (+36.0% YoY)
- Profit Before Tax : ¥1.881 billion (+53.3% YoY)
- Profit for the Period : ¥1.258 billion (+53.8% YoY)
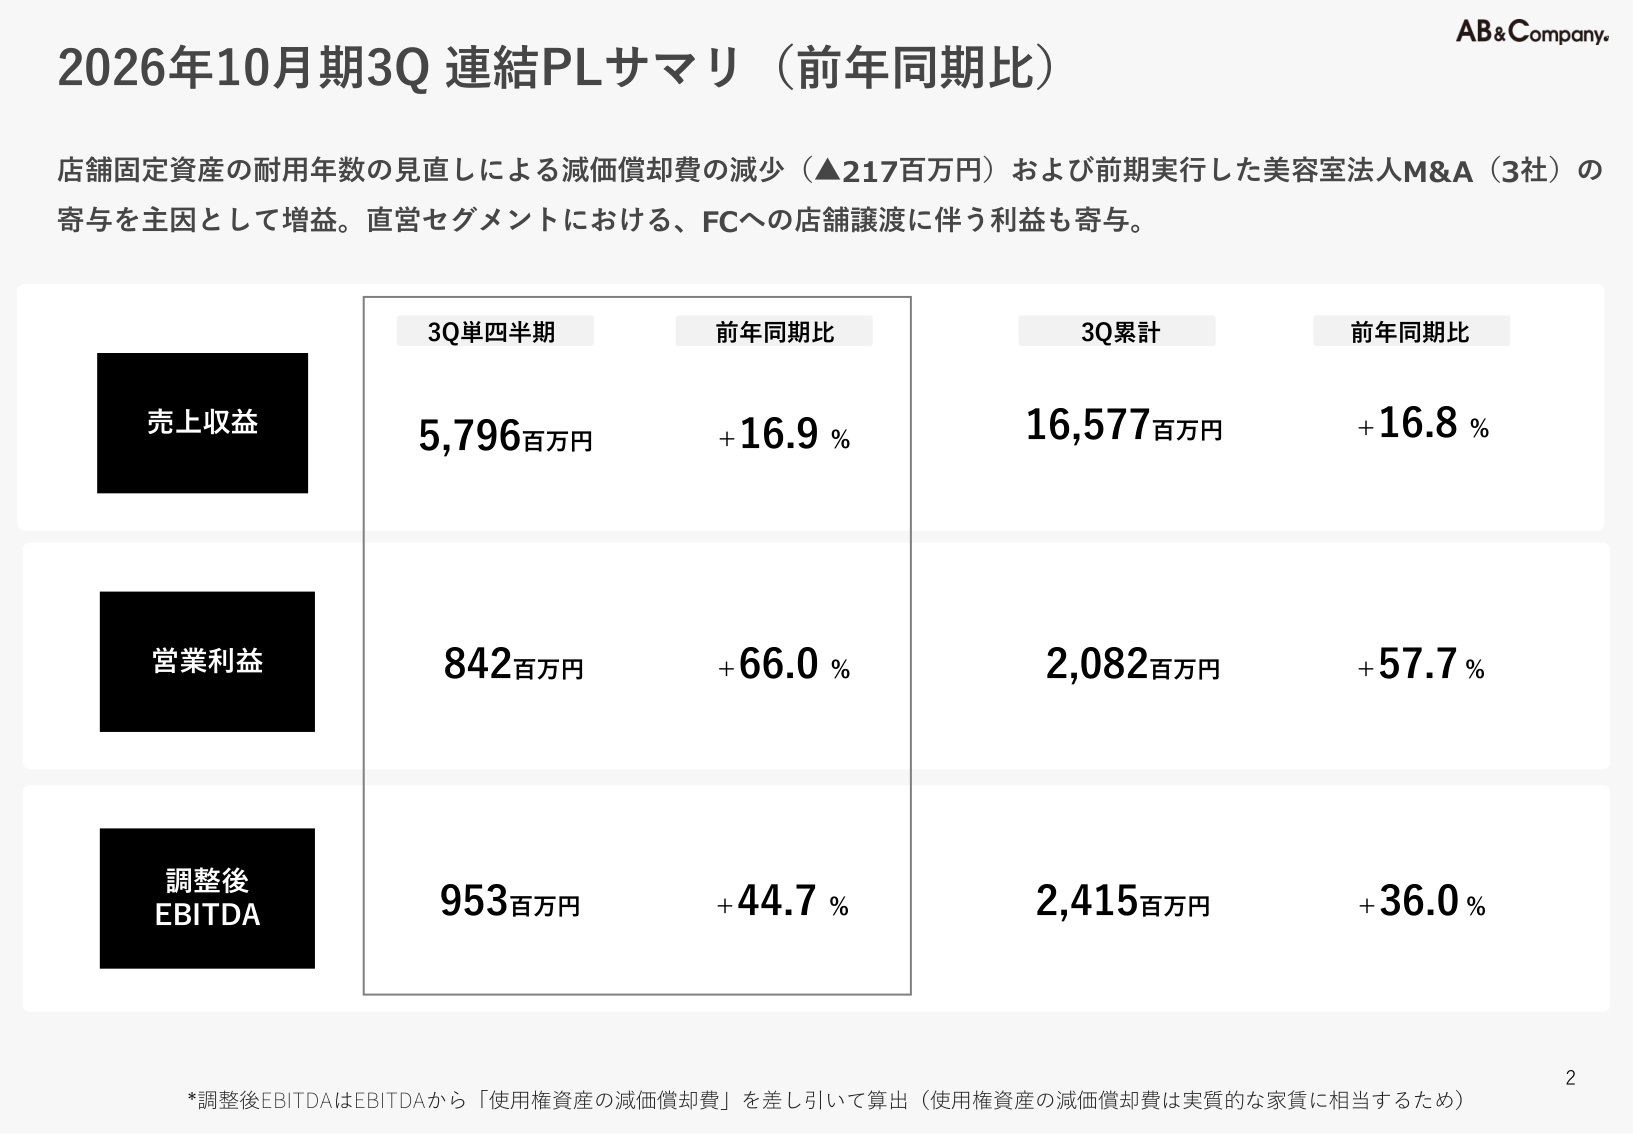
On a standalone Q3 basis, revenue grew by 16.9% YoY to ¥5.796 billion, while operating profit surged by 66.0% to ¥842 million. These figures underscore both top-line expansion and a successful transition toward a leaner, more profitable business structure.
2. Deep Dive into Consolidated Performance and Quarterly Trends
Structural Drivers of Revenue and Profit Growth
As shown in the slide above, Q3 YTD operating profit recorded a robust +57.7% YoY increase . The primary drivers for this growth are as follows:
- M&A Contributions : Revenue and profit growth fueled by the integration of three salon operators (est, Arose, and SENSE) acquired in the previous fiscal year.
- Review of Fixed Asset Useful Lives : A change in the estimated useful life of assets (from 7 to 9 years) resulted in a ¥217 million reduction in depreciation expenses .
- Gains on Transfer of Salons to FC : Recognition of gains (other income) from the transfer of stores from the directly-operated segment to the franchise segment.
- Upward Trend in Customer Unit Prices : Successful partial revisions to service menus and pricing, leading to improved gross profit margins.
Quarterly trends confirm that operating profit has jumped from ¥507 million in Q3 FY2025 to ¥842 million in the current Q3, signaling that the company’s profit-generating capacity has reached a new stage.
3. Progress Against Full-Year Forecasts
Profit Metrics Exceed 80% Progress Toward Full-Year Targets
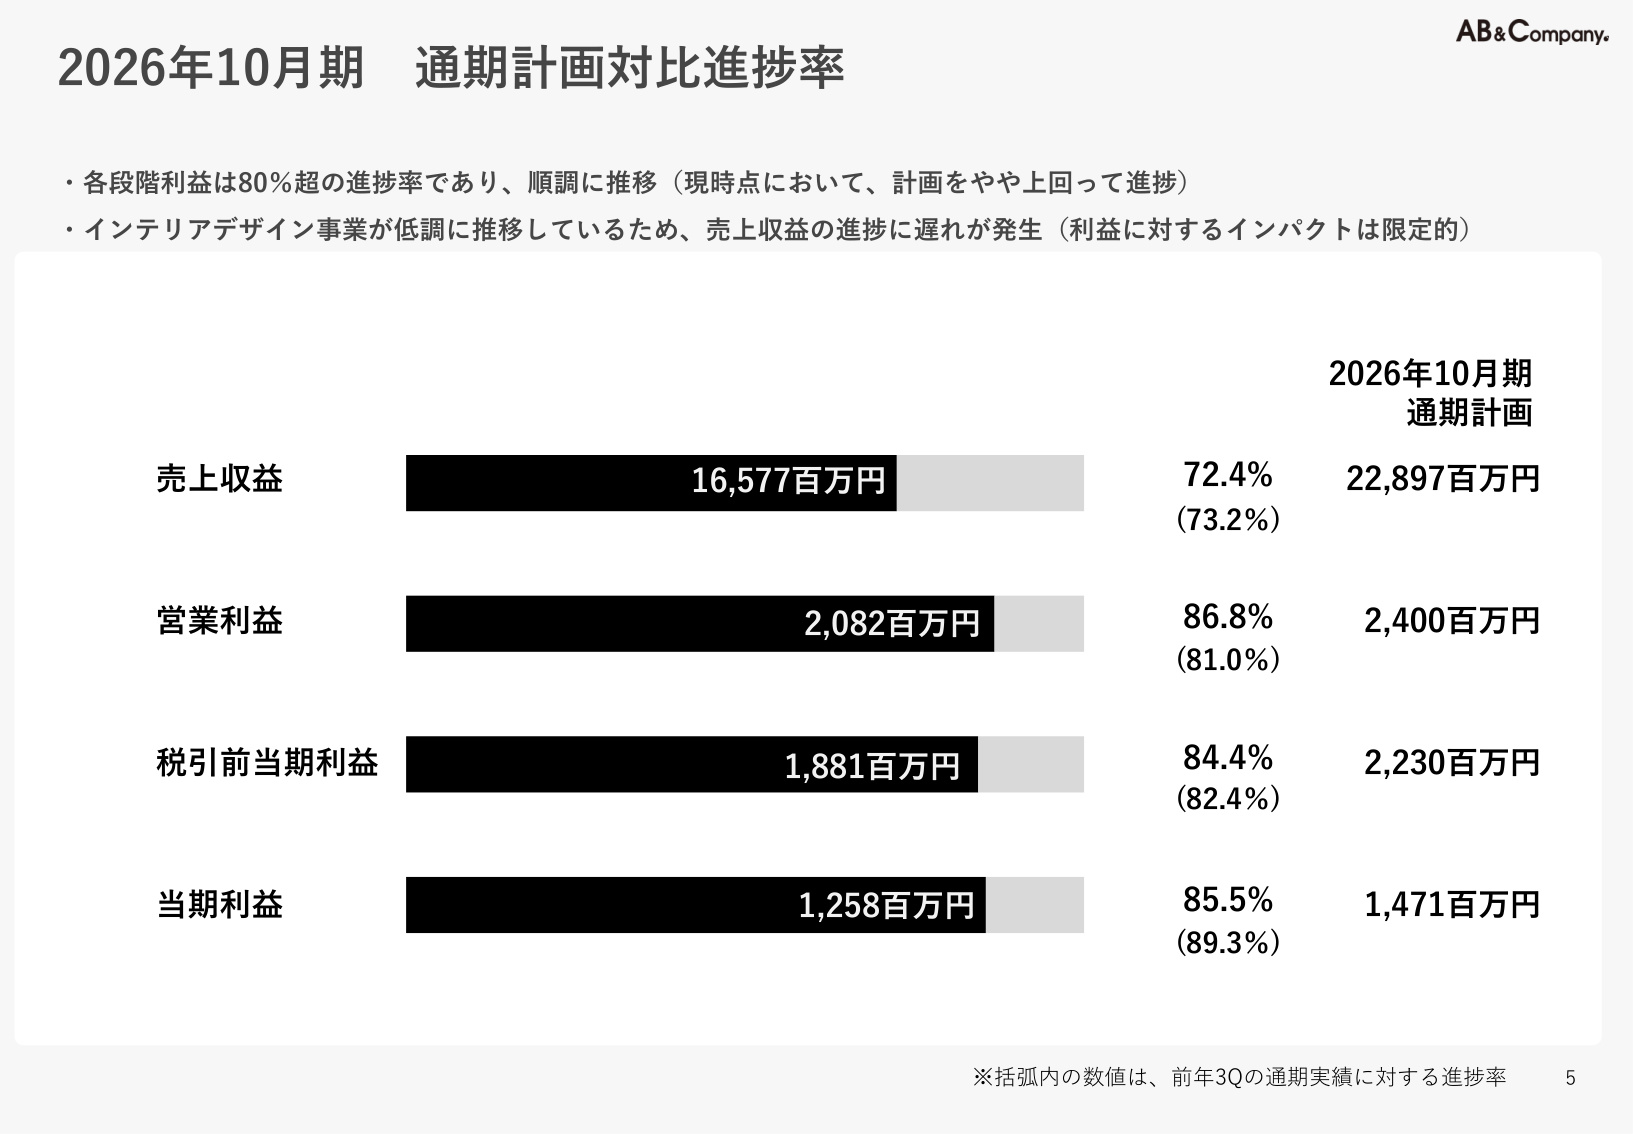
Progress against the full-year plan (Revenue: ¥22.897 billion, Operating Profit: ¥2.4 billion, Profit Before Tax: ¥2.23 billion, Profit for the Period: ¥1.471 billion) is as follows:
- Revenue Progress : 72.4% (vs. 73.2% in the same period last year)
- Operating Profit Progress : 86.8% (vs. 81.0% in the same period last year)
- Profit Before Tax Progress : 84.4% (vs. 82.4% in the same period last year)
- Profit for the Period Progress : 85.5% (vs. 89.3% in the same period last year)
While revenue is slightly behind schedule (72.4%) due to sluggish performance in the interior design business, the impact on overall profit is limited. With the core salon operations and FC business maintaining high profitability, the operating profit progress rate has reached 86.8% , which the company views as "progressing steadily, slightly ahead of plan."
4. Key KPIs and Store Development Trends
Growth in Customer Unit Prices and Store Expansion
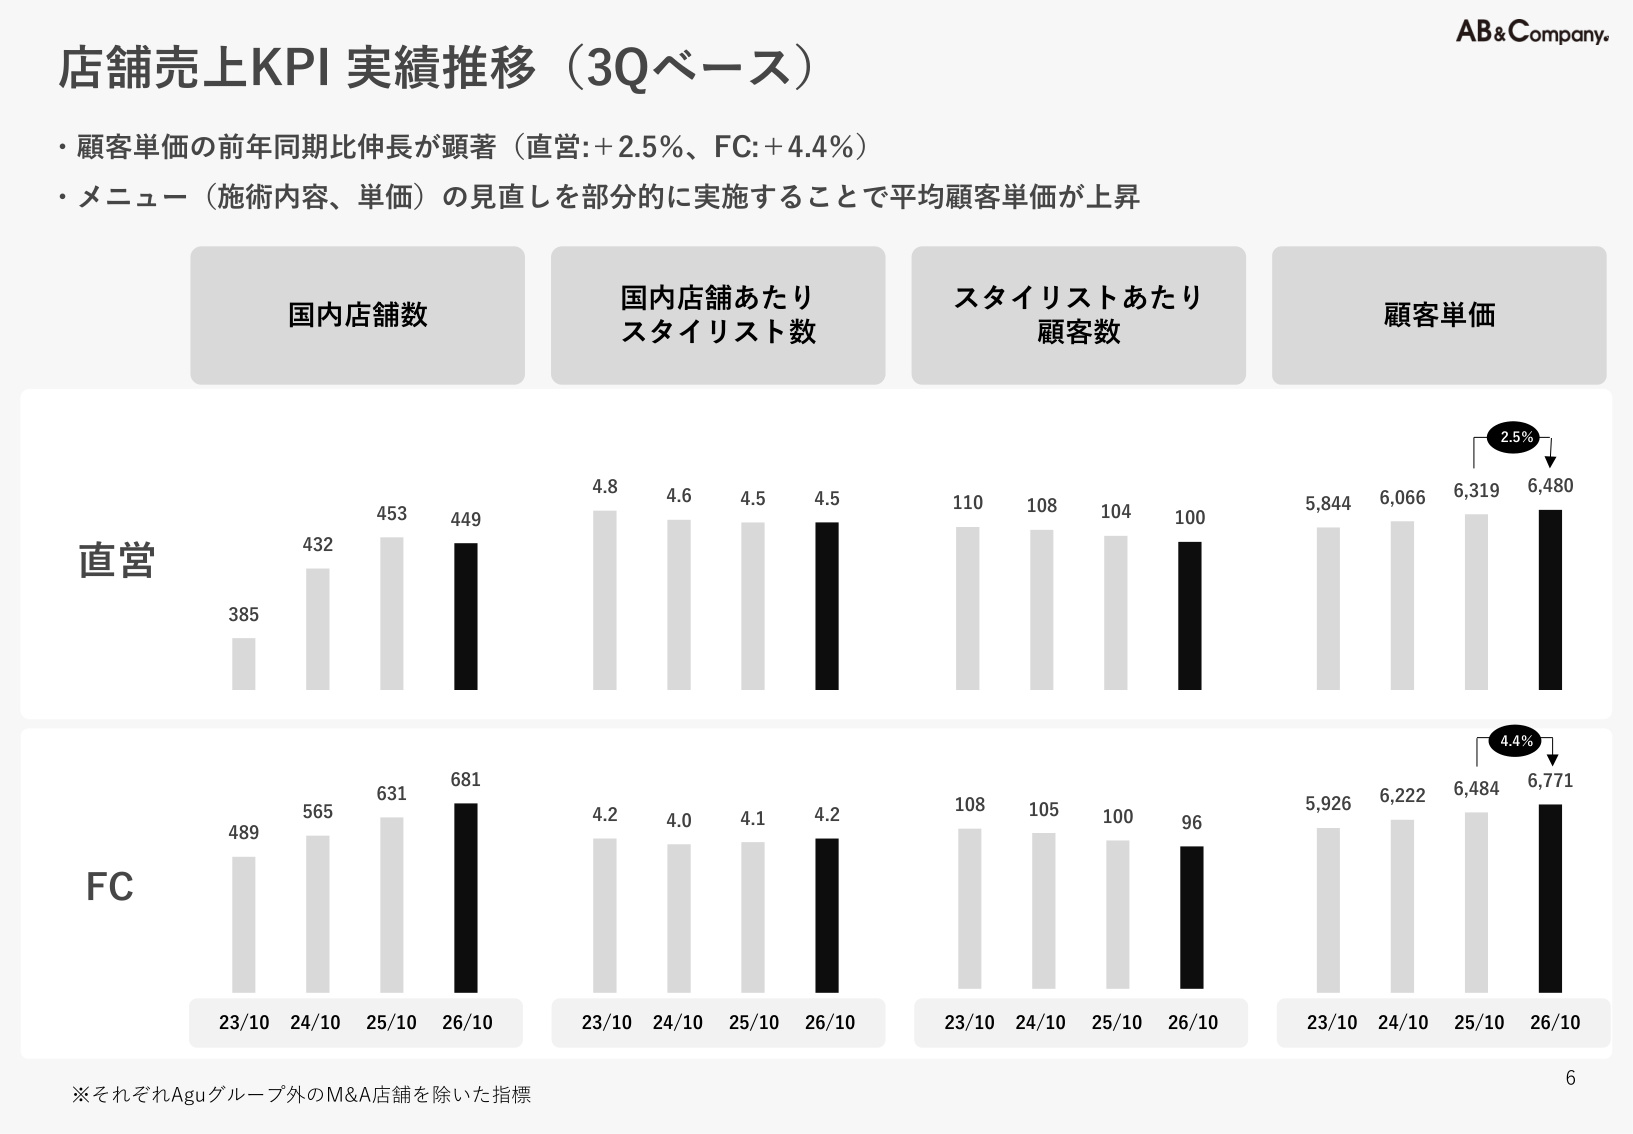
In the KPIs underlying store operations, the sustained growth in customer unit prices is particularly noteworthy.
- Customer Unit Price (Direct) : FY23/10: ¥5,844 → FY24/10: ¥6,066 → FY25/10: ¥6,319 → FY26/10: ¥6,480 (+2.5% YoY)
- Customer Unit Price (FC) : FY23/10: ¥5,926 → FY24/10: ¥6,222 → FY25/10: ¥6,484 → FY26/10: ¥6,771 (+4.4% YoY)
Partial revisions to menus and service offerings have established a consistent upward trend in unit prices for both direct and FC salons. The number of customers per stylist remains stable at a high level (100 for direct, 96 for FC), reflecting continued operational efficiency.
Domestic Store Count Trends
The total number of domestic stores reached 1,130 (449 direct, 681 FC). While the net increase of 4 stores in Q3 was relatively modest, the company expects the pace of new store openings to recover in Q4 .
Same-store sales remain resilient at around 100% YoY, while the all-store base maintains a cruising speed in the high 100% range (generally 105%–110%).
5. Segment Analysis
① Directly-Operated Salon Business (Core Growth Driver)
- Revenue : ¥13.918 billion (+20.1% YoY)
- Segment Profit : ¥618 million (Significant increase from ¥25 million in the same period last year)
- Profit Adjusted for Management Fees : ¥1.028 billion (+141.1% YoY)
Driven by M&A contributions, reduced depreciation burdens, and gains from transferring stores to FC (¥244 million in other income), the segment profit margin improved sharply from 0.2% in the previous year to 4.4% .
② Franchise Business (Highly Stable Revenue Base)
- Revenue : ¥2.411 billion (+9.7% YoY)
- Segment Profit : ¥991 million (+13.9% YoY)
- Segment Profit Margin : 41.1% (Maintaining high levels)
With steady accumulation of royalties and support fees, and supported by a gross profit margin of 91.5% , this segment continues to deliver stable revenue and profit growth.
③ Interior Design Business (Store Interior & Construction)
- Revenue : ¥1.329 billion (-17.7% YoY)
- Segment Profit/Loss : -¥28 million (vs. ¥38 million profit in the same period last year)
Orders were soft across all areas—direct-operated (-27.1%), FC (-28.0%), and other industries (-5.1%)—resulting in a revenue decline and a loss. However, the gross profit margin is showing signs of improvement at 24.8%, and the business is expected to recover slightly toward Q4.
6. Financial Position, Cash Flow, and Conclusion
Financial Highlights (IFRS)
- Total Assets : ¥30.084 billion (+¥3.006 billion from end of previous FY)
- Cash and Cash Equivalents : ¥2.939 billion (+¥676 million from end of previous FY)
- Total Equity : ¥9.404 billion (Retained earnings increased to ¥5.152 billion)
Cash Flow Status
- Operating CF : +¥2.298 billion (Increased from ¥1.869 billion in the same period last year due to higher profit before tax)
- Investing CF : -¥449 million (Acquisition of tangible fixed assets, etc.)
- Financing CF : -¥1.172 billion (Dividend payments of ¥854 million due to policy change, lease liability repayments of ¥1.461 billion, and net increase in borrowings of ¥1.157 billion)
With robust operating cash flow, the company maintains a sound structure capable of balancing shareholder returns (increased dividends) with active business investment and debt repayment.
Conclusion
AB & Company’s Q3 FY2026 results were strong, reflecting the successful combination of business scale expansion via M&A, strengthened existing store profitability through higher unit prices, and cost optimization via the review of asset useful lives. With the operating profit progress rate reaching 86.8%, the company is well-positioned to meet its full-year targets, supported by an expected recovery in store openings and a bottoming out of the interior design business in Q4.
This content is not intended as investment advice or a recommendation. Any opinions expressed are solely the personal views of each article.