

![[Luckland] FY2026 Q2 Earnings Analysis: Navigating External Headwinds, Second-Half Recovery Strategies, and Mid-Term Management Plan Progress](https://news-images.stock-club.net/market_news/images/9612/140120260831528245/slide_eyecatch_en_882d2707.webp)
[Luckland] FY2026 Q2 Earnings Analysis: Navigating External Headwinds, Second-Half Recovery Strategies, and Mid-Term Management Plan Progress

StockClub
Published: Aug 31, 2026, 09:53 AM
Sentiment Analysis
Introduction
This report provides a multi-faceted analysis of the FY2026 Q2 (interim) financial results for Luckland Co., Ltd. (Securities Code: 9612), a company specializing in the planning, design, construction, and maintenance of commercial spaces. We examine the company's performance, segment-specific trends, improvements in financial health, and the progress of its mid-term management plan based on the latest earnings presentation materials.
1. FY2026 Q2 Consolidated Financial Highlights
For the first half of the fiscal year, consolidated net sales, operating profit, and ordinary profit fell below both the previous year's levels and the initial forecasts. Conversely, interim net profit attributable to owners of the parent exceeded initial projections, largely due to the impact of tax-effect accounting.
The slide above summarizes the key financial figures for the second quarter. The variances between actual results, the previous year's figures, and initial forecasts are as follows:
- Net Sales : 22,657 million yen (down 12.5% YoY, 89.4% of initial forecast)
- Operating Profit : 823 million yen (down 49.7% YoY, 70.7% of initial forecast)
- Operating Profit Margin : 3.6% (down 2.7 pt YoY)
- Ordinary Profit : 879 million yen (down 44.5% YoY, 73.0% of initial forecast)
- Interim Net Profit Attributable to Owners of the Parent : 665 million yen (down 30.7% YoY, 109.4% of initial forecast)
External Environment and Impact on Performance
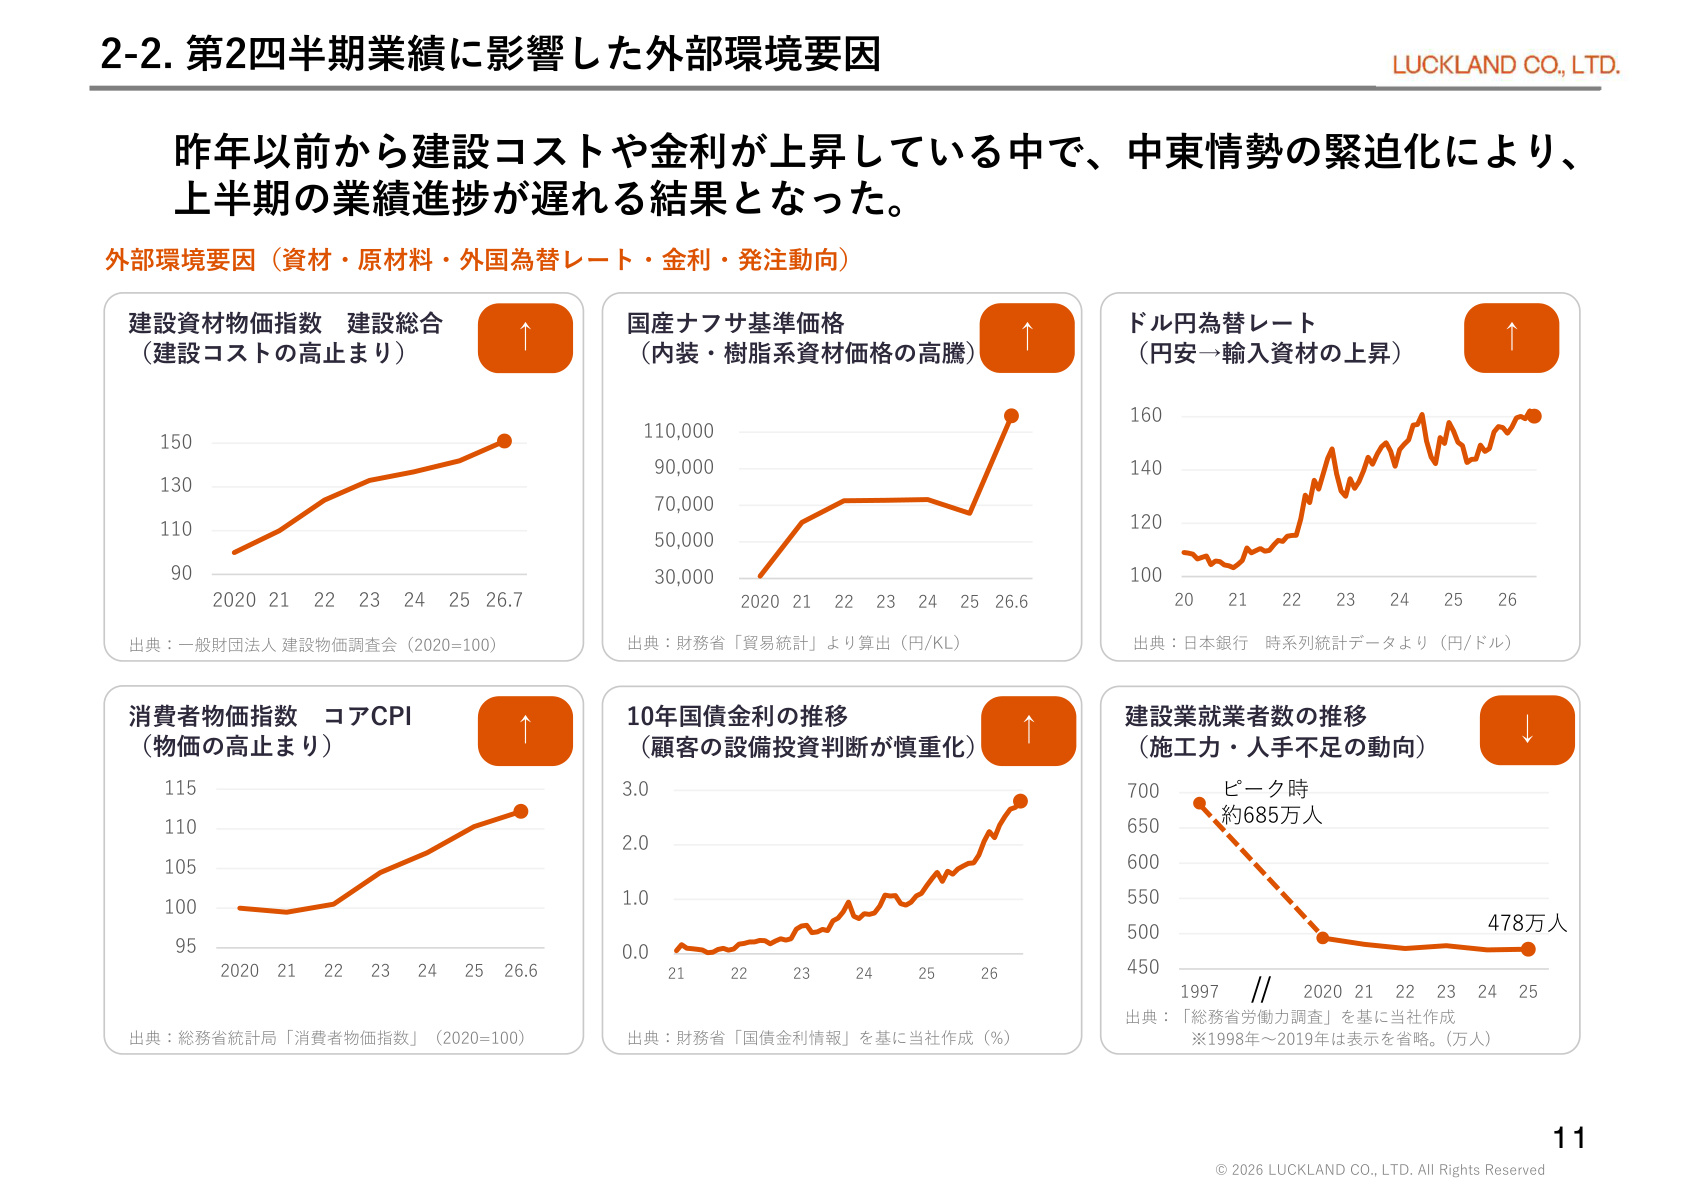
The shortfall in first-half performance is attributed to the following complex external factors:
- Escalating Tensions in the Middle East : Concerns over raw materials and logistics led customers to postpone investment decisions and delay construction schedules.
- High Construction Costs and Material Prices : Rising costs of imported materials due to high domestic naphtha benchmark prices and a weak yen.
- Upward Trend in Domestic Interest Rates : Rising 10-year JGB yields prompted more cautious capital investment decisions among some clients.
- Decline in Construction Workforce : Continued labor shortages and capacity constraints across the construction industry.
These factors caused the postponement of revenue recognition for projects originally expected in the first half to the second half, serving as the primary driver for the decline in sales.
Analysis of Operating Profit Variance
The 814 million yen decrease in operating profit (from 1,637 million yen in the same period last year to 823 million yen) is broken down as follows:
- Decrease due to lower sales : -543 million yen
- Decrease due to higher cost of sales ratio : -389 million yen
- Increase in personnel expenses (SG&A) : -12 million yen
- Reduction in other SG&A expenses : +130 million yen
While the inability to absorb fixed costs due to lower sales and the pressure on margins from high material prices weighed on profits, these were partially offset by the containment of other SG&A expenses.
2. Segment Trends
In terms of sales by business segment, the core commercial space-related sectors struggled, while the construction business showed growth.
The sales and year-on-year growth rates for each segment are as follows:
- Store Facility Construction : 14,006 million yen (down 14.1% YoY)
- Commercial Facility Construction : 3,547 million yen (down 20.7% YoY)
- Food Factory & Logistics Warehouse Construction : 850 million yen (down 27.8% YoY)
- Maintenance Business : 1,150 million yen (down 17.4% YoY)
- Environmental Business (formerly Energy Saving/CO2 Reduction) : 33 million yen (down 15.8% YoY)
- Construction Business : 3,068 million yen (up 22.8% YoY)
While the commercial facility, store, and food logistics sectors saw revenue declines due to customer investment restraint and project revisions, the Construction Business achieved a significant 22.8% increase in revenue due to a concentration of project completions in the current period, providing support for overall sales.
3. Financial Health Improvement and Risk Reduction Measures
During this period, the company implemented fundamental measures to strengthen its balance sheet.
- Improvement in Equity Ratio : The ratio improved by +9.3 pt to 53.2% , up from 43.9% at the end of the previous fiscal year. This was driven by an increase in net assets to 13,837 million yen (up 725 million yen from year-end) and a reduction in total assets to 25,822 million yen, achieved through the compression of current liabilities (from 15,644 million yen to 11,030 million yen).
- Transfer of Long-term Accounts Receivable : On June 30, 2026, the company completed the transfer of long-term accounts receivable from a specific client (balance of 1,472 million yen) to a debt guarantee company for 869 million yen . Having recorded a 599 million yen provision for doubtful accounts as an extraordinary loss in FY2025, the transfer of the remaining receivables eliminates future collection uncertainty and credit risk, while reducing administrative burdens.
4. Progress of Mid-Term Management Plan (2026–2028) and Structural Reform
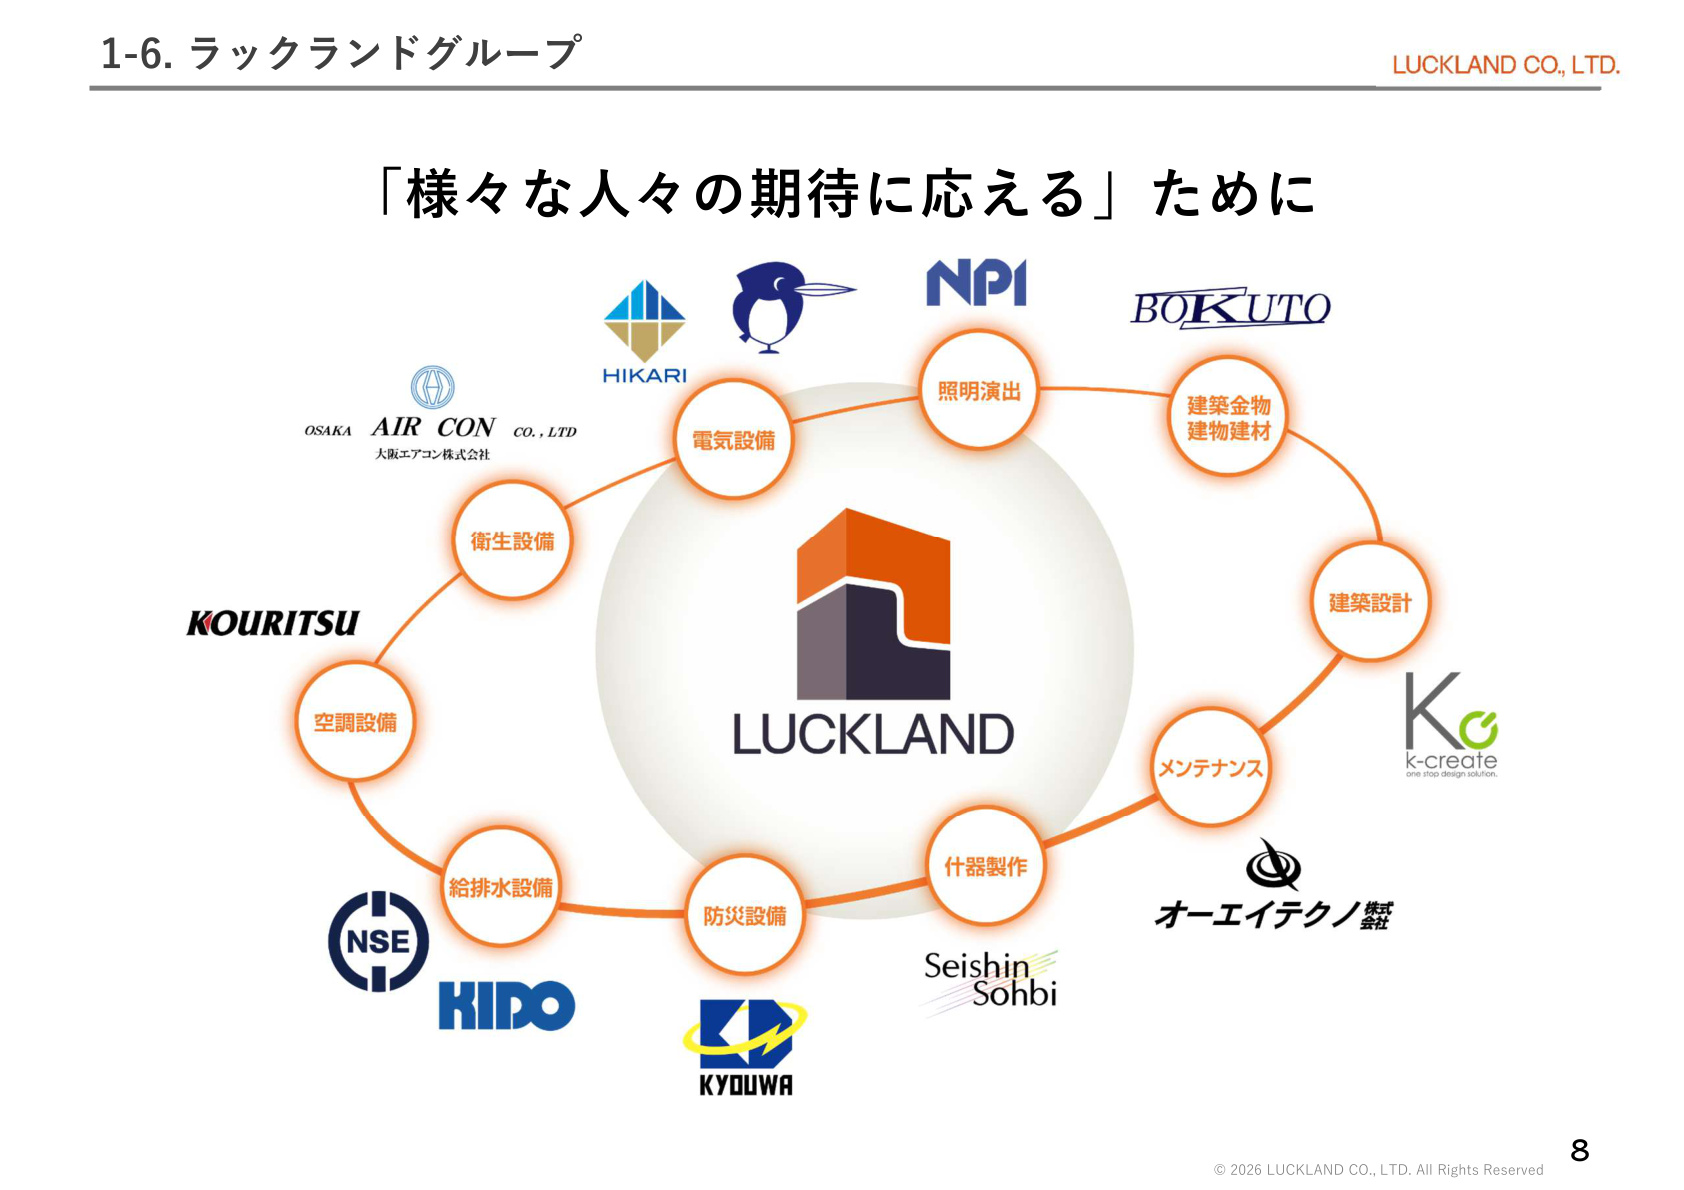
Luckland has designated the three-year period from FY2026 to FY2028 as the " Foundation Building Phase for a Leap Forward ," promoting reforms across four areas: business, finance, human resources, and DX.
This slide highlights key indicators showing the growth trajectory and management goals leading up to the final year of the mid-term plan.
Mid-Term Plan Targets and Shareholder Return Policy
- Net Sales Targets :
- FY2026: 58,000 million yen
- FY2027: 60,000 million yen
- FY2028: 62,000 million yen
- Profitability & Capital Efficiency :
- Operating Profit Margin: Stable at 6.5% or higher
- ROE: 8.0% or higher
- Gradual Increase in Dividend Payout Ratio :
- 2026: 20%
- 2027: 30%
- 2028: 40%
Progress on Key Initiatives
- Optimization of Business Portfolio : To concentrate management resources on core areas, the company sold all shares of two consolidated subsidiaries (Ace Center Co., Ltd. for facility management, and Mach Kiki Co., Ltd. for kitchen equipment manufacturing) for 335 million yen and 373 million yen, respectively.
- Organizational Restructuring (Effective July 1, 2026) : Transitioned from a decentralized operation where branches functioned independently to a centralized management system by functional headquarters . This aims to strengthen sales, standardize construction and design processes, and enhance governance.
- Human Resource Strategy (Introduction of RS Plan) : To retain core talent and align interests with shareholders, 158,900 shares of Restricted Stock (RS) were granted to 188 employees (dilution of 1.41%).
- Construction of DX Common Infrastructure : Completed requirements definition for a Common Data Environment (CDE) to centralize core systems, construction data, and drawings, with business process alignment underway for a 2027 implementation.
- Sustainability Management : Established a "Sustainability Committee" in August 2026 and identified five materialities: talent acquisition, safety/quality, environmental consideration, local communities, and governance.
5. Full-Year Forecast and Second-Half Priorities
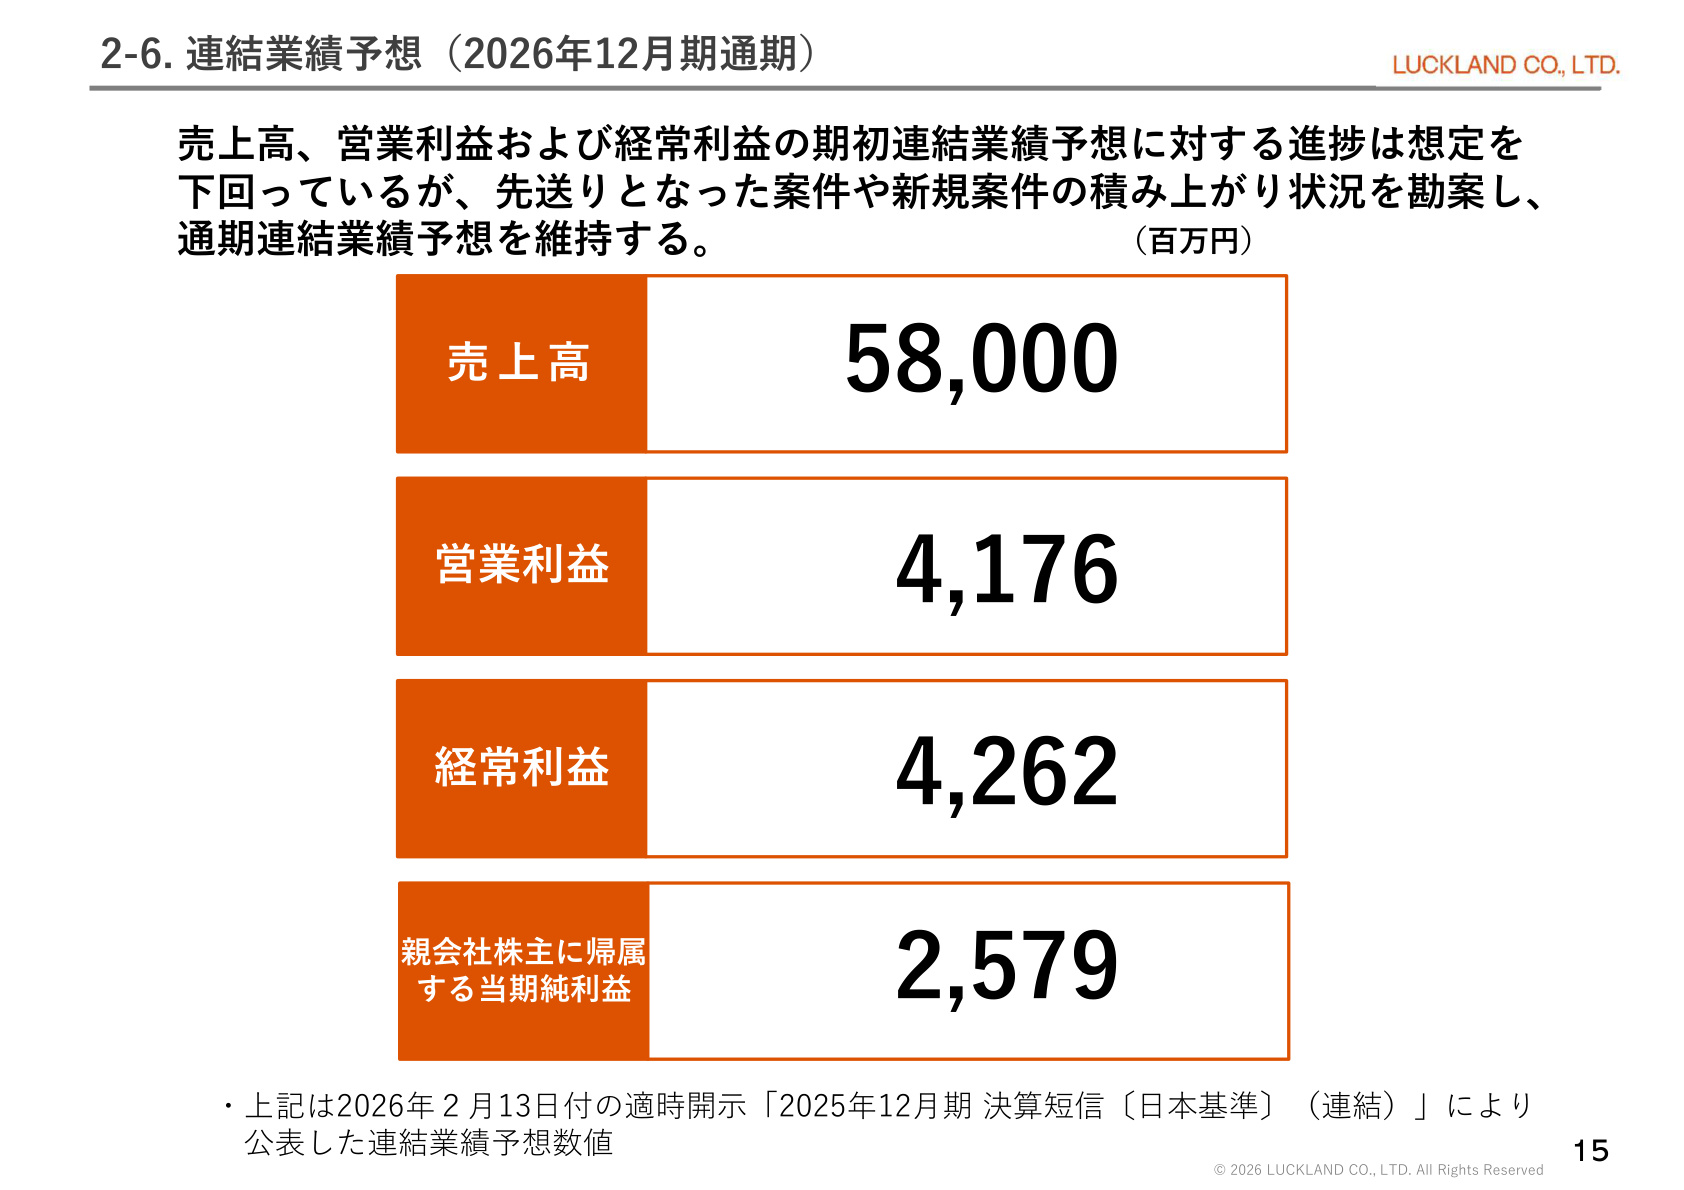
Despite the first-half performance falling below initial expectations, the company has maintained its initial full-year consolidated earnings forecast , taking into account the expected revenue recognition of postponed projects and the accumulation of new orders in the second half.
- Net Sales : 58,000 million yen
- Operating Profit : 4,176 million yen
- Ordinary Profit : 4,262 million yen
- Net Profit Attributable to Owners of the Parent : 2,579 million yen
Second-Half Priorities
- Achieving Full-Year Targets : Focus on new client acquisition, reviving dormant accounts, strengthening bidding and order strategies, and rigorous management of project schedules and profitability.
- Improving Operational Efficiency : Through the new organizational structure, optimize project and personnel allocation to improve construction capacity and utilization rates.
- Balancing Finance and Returns : Enhance cash generation to fund growth investments and execute shareholder returns as planned (20% payout ratio).
Summary
While Luckland's FY2026 Q2 results saw a decline in revenue and profit due to high raw material costs and market conditions, the period marked significant progress in restructuring the balance sheet and business foundation. This included growth in the construction business, an improvement in the equity ratio to 53.2%, the resolution of long-term receivable risks, and the streamlining of operations through subsidiary divestitures. The key focus for the second half will be the successful execution and delivery of postponed projects and the improvement of profitability under the new organizational structure.
This content is not intended as investment advice or a recommendation. Any opinions expressed are solely the personal views of each article.