


Willplus Holdings FY2026 Earnings Deep Dive: Overcoming M&A Costs and Market Headwinds to Drive a V-Shaped Recovery via Stock Revenue Growth and PMI Progress

StockClub
Published: Aug 27, 2026, 09:53 AM
Sentiment Analysis
1. FY2026 Earnings Overview: Revenue Growth Amidst Profit Decline and Challenging Business Conditions
Willplus Holdings' full-year financial results for the fiscal year ending June 2026 reported consolidated net sales of 96.839 billion yen (+9.3% YoY) , operating profit of 1.426 billion yen (-22.9% YoY) , ordinary profit of 1.427 billion yen (-24.8% YoY) , and net profit attributable to owners of the parent of 1.108 billion yen (-23.2% YoY) .
Although the results necessitated a downward revision from initial forecasts, the company successfully met its revised targets announced in May 2026, achieving 105.1% of its sales target, 101.9% of its operating profit target, and 100.0% of its ordinary profit target.
Net sales reached a record high , driven by contributions from newly acquired dealerships through aggressive M&A and the expansion of "wholesale" operations in the used car export business. Conversely, profitability was impacted by a historic slump in the domestic imported car market, a decline in gross profit per used car, and the burden of upfront costs and initial losses from newly acquired stores. Consequently, the operating profit margin fell to 1.5% (-0.6pt YoY) .
2. Mid-to-Long-Term Performance Trends and the FY2027 V-Shaped Recovery Scenario
An overview of the company's performance over the past few years and its outlook for the next fiscal year reveals a clear strategy of business scale expansion, the resulting temporary decline in profitability, and a defined recovery narrative for the coming year.
Significance of the Slide and Background
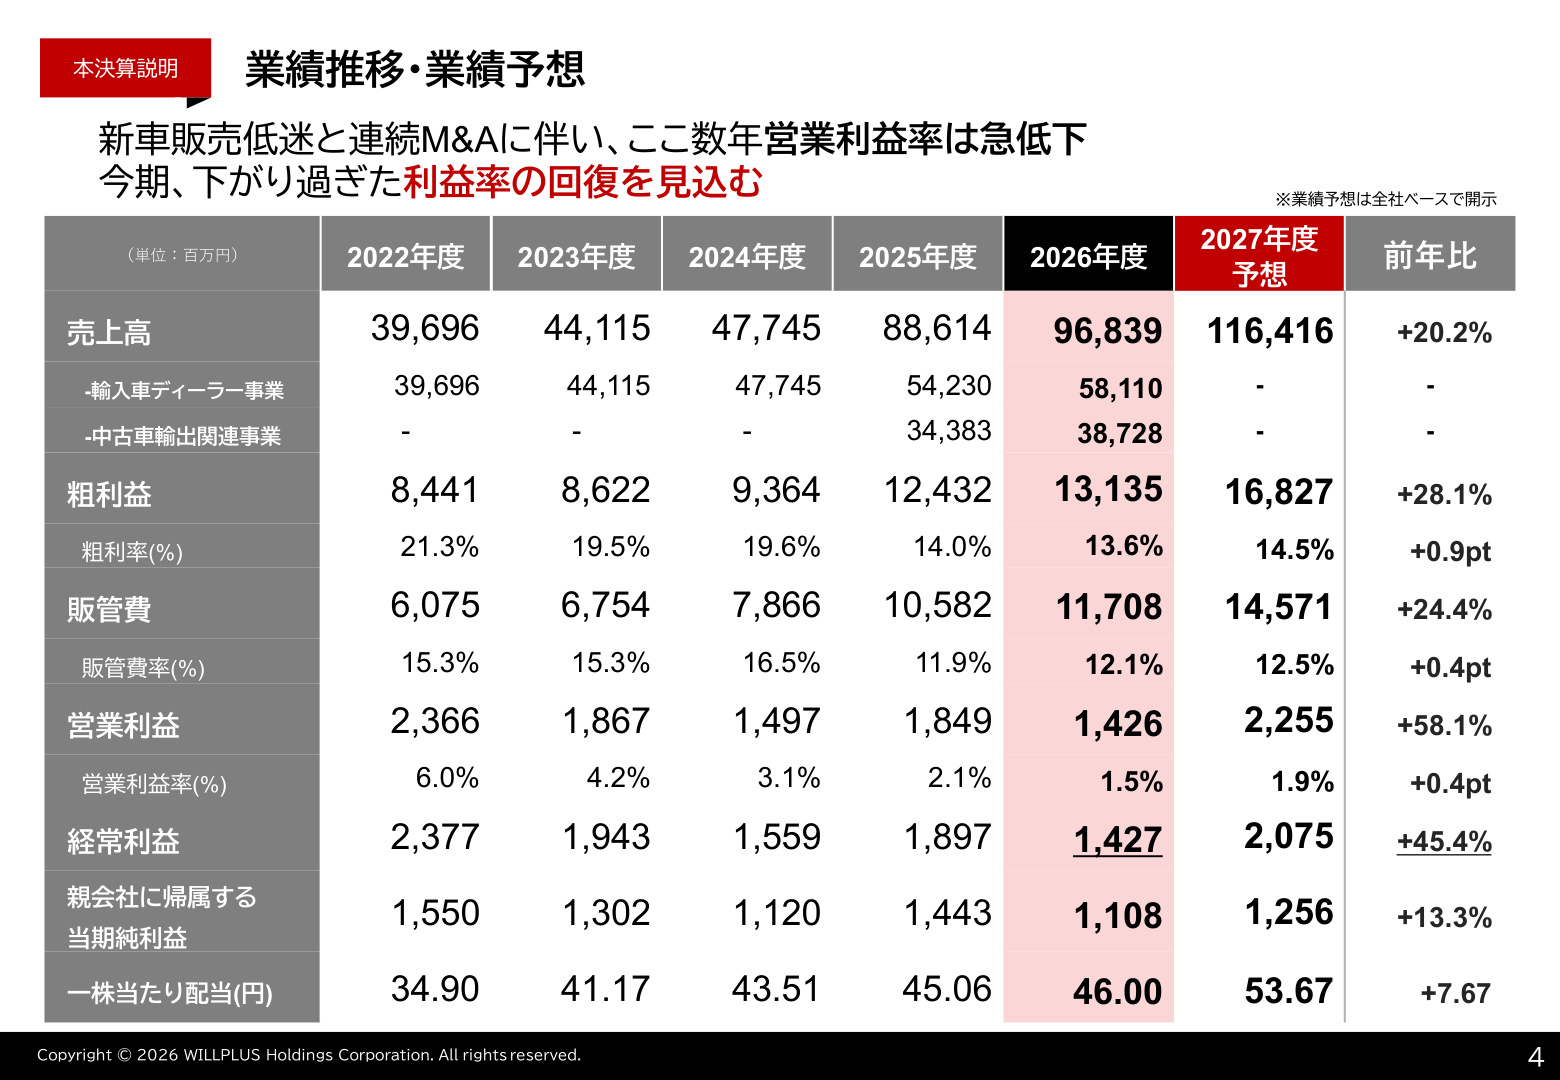
The slide above (PAGE 5) is the most critical data set for understanding the six-year performance trend and forecast from FY2022 to FY2027. The key takeaways are summarized in the following three points:
-
Rapid Expansion of Sales Scale (Top-line Growth) From 39.696 billion yen in FY2022, the company has more than doubled its size to 96.839 billion yen in FY2026, fueled by the consolidation of used car export operations and continuous M&A of imported car dealerships. The FY2027 forecast projects 116.416 billion yen (+20.2% YoY) , marking the first time the company expects to exceed the 100 billion yen milestone.
-
Bottoming Out and Sharp Recovery of Operating Profit Margin Due to the deteriorating new car sales environment and upfront M&A costs, the operating profit margin dropped sharply from 6.0% in FY2022 to 1.5% in FY2026. However, in FY2027, driven by the progress of PMI (Post-Merger Integration) at acquired stores and the accumulation of stock-based businesses, the company expects operating profit to reach 2.255 billion yen (+58.1% YoY) , with an operating profit margin of 1.9% (+0.4pt) .
-
Strong Shareholder Return Policy via Consecutive Dividend Increases Even during the period of declining profit margins, the company increased its annual dividend to 46.00 yen (from 45.06 yen in the previous year) and plans to pay 53.67 yen in FY2027 (marking a projected 10th consecutive year of dividend increases) .
3. Domestic Imported Car Market Trends and Multi-Brand Strategy
In FY2026, the domestic passenger car market declined by 2.7% YoY, while foreign-made (imported) cars saw a modest increase of 1.4% YoY (236,923 units) . The imported car market remains approximately 21.7% lower than its recent peak in 2018 (308,389 units), as rapid yen depreciation and inflation have led consumers to adopt a "wait-and-see" approach.
Among the brands handled by the company, the flagship Jeep brand saw a decline of approximately 40% compared to its peak , reflecting the harsh market environment. However, the company has mitigated the impact of specific brand downturns by pursuing a multi-brand strategy . By strengthening its portfolio—including the consistently growing VOLVO (103.4% of the previous year) , Jaguar/Land Rover , MINI , and emerging EV brands like BYD (154.2% of the previous year) —the company has built a structure that levels out market volatility risks.
4. The Core of the Revenue Structure: Sustainable Growth of Stock-Based Business
Amidst the volatility of the new car sales market, the stock-based business , consisting of vehicle maintenance and non-life insurance agency services, plays a vital role as a stable revenue foundation.
Growth Drivers of the Vehicle Maintenance Business
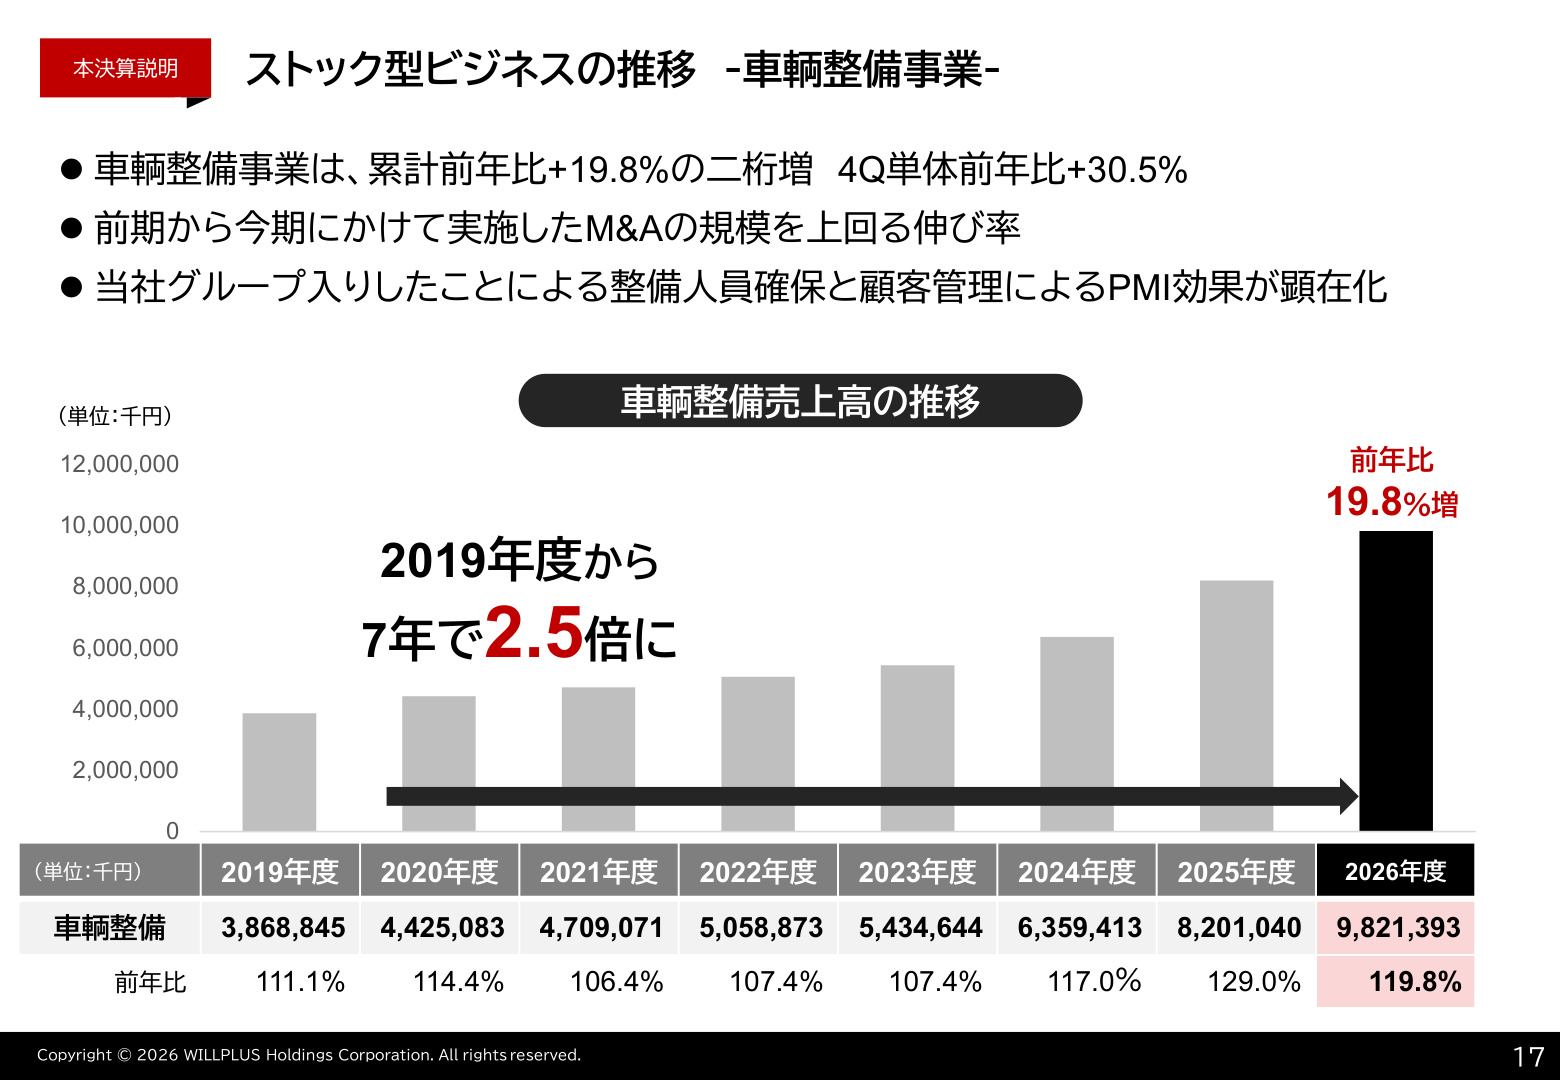
As shown in the slide above (PAGE 18), vehicle maintenance sales reached 9.821 billion yen (+19.8% YoY) , achieving a dramatic 2.5-fold growth over seven years since FY2019 (3.868 billion yen).
This double-digit growth significantly outpaces the pace of store count expansion through M&A. It is the result of early realization of PMI effects , such as the optimal allocation and securing of maintenance personnel and the introduction of a proprietary Customer Relationship Management (CRM) system at newly acquired stores. Maintenance revenue, tied to the customer base (number of vehicles in operation), serves as a robust defensive asset that generates stable gross profit even during economic downturns or new car supply constraints.
Furthermore, in the non-life insurance agency business , the company has quickly adapted to revisions in agency commission structures. The total number of insurance policies reached 16,899 (+15.9% YoY) , and insurance commission income grew to 477 million yen (+8.7% YoY; +25.4% in 4Q alone) , indicating a sharp recovery trajectory since the second half. The new car insurance acquisition rate remains at a very high level of 39.6% .
5. Signs of Profitability Bottoming Out in Quarterly Trends
A detailed examination of the company's FY2026 performance on a quarterly (QoQ) basis reveals clear signs of the profit margin bottoming out and beginning to reverse.
Slide Commentary: The Turning Point Where Gross Profit Improvement Outpaces SG&A Increase
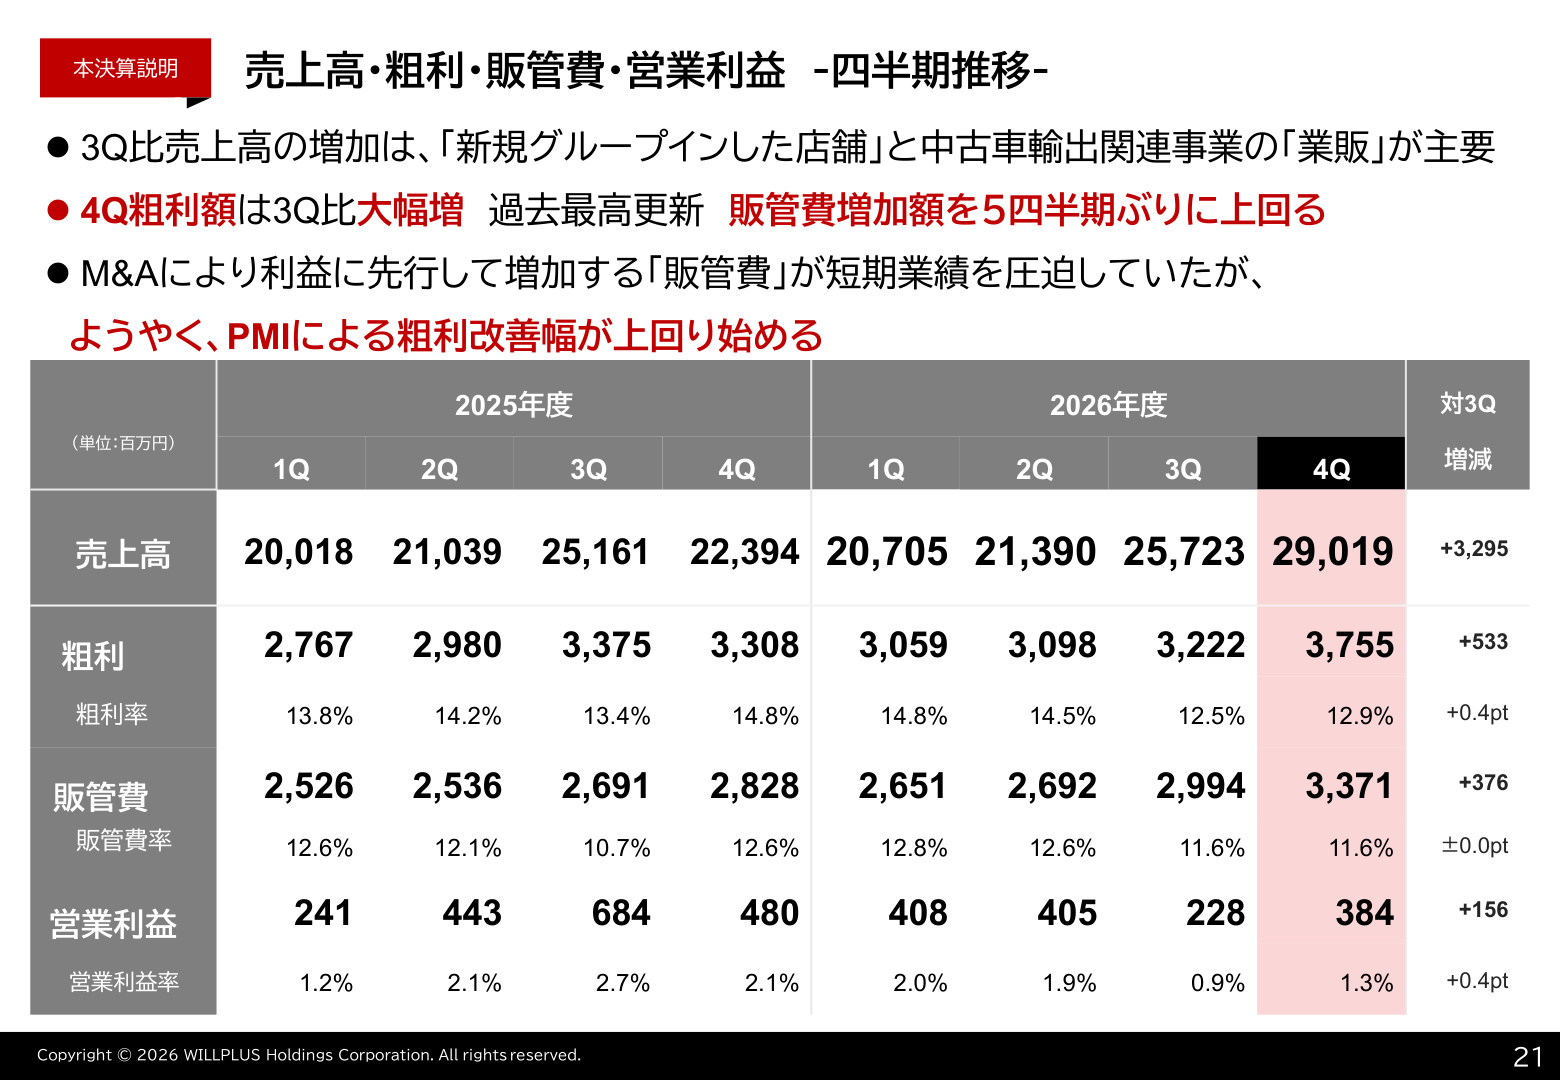
The slide above (PAGE 22) shows the momentum of quarterly sales, gross profit, SG&A expenses, and operating profit. The Q4 trends are particularly noteworthy:
- Record-High Gross Profit : Q4 sales were 29.019 billion yen (+3.295 billion yen vs. Q3) , and gross profit increased significantly to 3.755 billion yen (+533 million yen vs. Q3) .
- Absorption of SG&A Expenses : While SG&A expenses (such as personnel and facility costs) increase immediately after M&A, putting temporary pressure on profits, in Q4, the increase in gross profit (+533 million yen) exceeded the increase in SG&A expenses (+376 million yen) for the first time in five quarters .
- Reversal of Operating Profit Margin : The operating profit margin improved by +0.4pt from a record low of 0.9% in Q3 to 1.3% in Q4 , and operating profit saw a sharp recovery from 228 million yen in Q3 to 384 million yen in Q4 (+68.7% vs. Q3) .
6. Segment Trends: Status of the Used Car Export Business
In the used car export business (e.g., ENG Co., Ltd.), despite a favorable business environment due to the continued strength of the Malaysian Ringgit against the Yen, profitability in the high-margin "export" business temporarily declined due to stagnant overseas demand for the company's core vehicle models and rising procurement and shipping costs.
In response, the company deployed agile operations to secure gross profit by expanding the volume of domestic "wholesale" (wholesale sales: +35.3% YoY) , prioritizing inventory turnover. Moving forward, the primary challenge for improving profit margins will be the appropriate pass-through of costs in the export business.
7. Financial Foundation, Capital Efficiency, and Shareholder Returns
- Financial Position : Total assets expanded to 43.917 billion yen (+18.0% YoY) due to an increase in inventories (14.604 billion yen) associated with M&A and the use of short-term borrowings. Although the equity ratio became 26.6% (29.0% at the end of the previous fiscal year) , the fixed long-term suitability ratio remains at 67.6% , maintaining financial soundness and securing capacity for further M&A.
- Shareholder Return Policy : The company maintains a basic dividend payout ratio of 30% and has adopted a robust policy with a "DOE (Dividend on Equity) of 4.5%" as a floor . The dividend payout ratio for FY2026 was 38.9% , and the company plans to increase dividends for the 10th consecutive year in FY2027, with an annual dividend of 53.67 yen (22.00 yen interim, 31.67 yen year-end) .
8. Outlook for FY2027 and Summary
The consolidated earnings forecast for the fiscal year ending June 2027 projects significant growth in both sales and profit: net sales of 116.416 billion yen (+20.2% YoY) , operating profit of 2.255 billion yen (+58.1% YoY) , ordinary profit of 2.075 billion yen (+45.4% YoY) , and net profit of 1.256 billion yen (+13.3% YoY) .
Pillars of Growth Strategy
- Full-year contribution from the four M&As conducted in the previous fiscal year and the three M&As already disclosed in Q1 of this fiscal year.
- Full-scale realization of profit improvement effects through the injection of the company's know-how (PMI) into stores that were loss-making or low-profit immediately after acquisition.
- Autonomous gross profit growth through the accumulation of stock-based businesses , centered on vehicle maintenance and insurance.
- Pass-through of cost increases in used car exports and the recovery of appropriate margins.
Willplus Holdings views the stagnation of the imported car market as an opportunity to expand its market share through M&A and strengthen its corporate structure through PMI, transforming its business foundation into a dealership group with over 100 billion yen in sales.
This content is not intended as investment advice or a recommendation. Any opinions expressed are solely the personal views of each article.