


Dynapac H1 FY2026 Earnings Analysis: Record-High Profits, Significant Full-Year Guidance Upgrade, and Early Achievement of Mid-Term Management Plan

StockClub
Published: Aug 26, 2026, 09:52 AM
Sentiment Analysis
1. Earnings Highlights: Record-High Profits and Significant Full-Year Guidance Upgrade
Dynapac Co., Ltd. (Securities Code: 3947), a comprehensive packaging manufacturer, reported exceptionally strong results for the first half of the fiscal year ending December 2026 , achieving record highs in net sales, operating profit, and ordinary profit. The company realized significant growth in both revenue and profit, driven by robust domestic demand, the successful implementation of ongoing price revisions, productivity improvement initiatives, M&A synergies, and a recovery in overseas markets.
Following the first-half performance, which significantly exceeded initial projections, the company has substantially upwardly revised its full-year earnings forecast for FY2026 . Consequently, the company is now on track to achieve all quantitative financial targets of its current Mid-Term Management Plan (2024–2026) ahead of schedule. Additionally, the company announced an increase in its year-end dividend forecast, marking four consecutive years of dividend growth (90 yen per share annually).
2. H1 FY2026 Performance Trends and Factor Analysis
Key financial results for the first half of the fiscal year are as follows:
- Net Sales : 36.376 billion yen (+15.1% YoY, +3.9% vs. initial forecast)
- Operating Profit : 2.023 billion yen (+42.8% YoY, +55.7% vs. initial forecast)
- Ordinary Profit : 2.624 billion yen (+45.8% YoY, +54.4% vs. initial forecast)
- Net Income Attributable to Owners of Parent : 1.860 billion yen (+5.5% YoY, +69.1% vs. initial forecast)
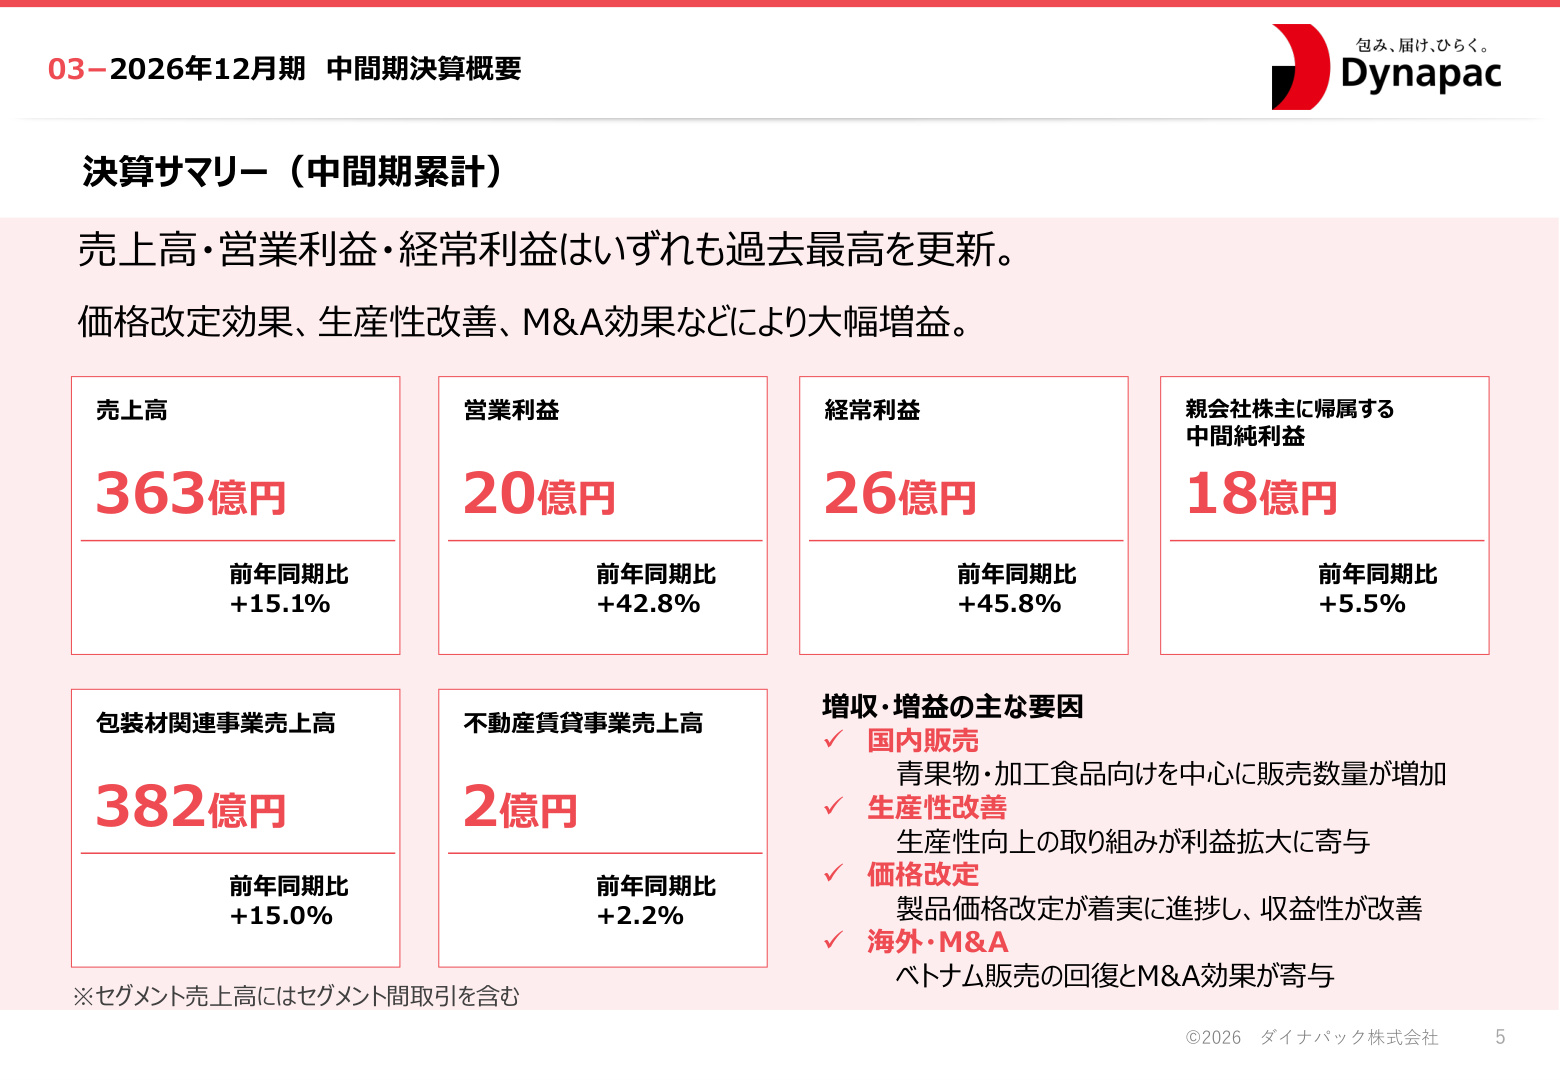
Significance of the Slide and Background (H1 Earnings Summary)
The slide above clearly illustrates the exceptional profit growth during the first half and the four primary factors that supported it. Operating profit surged by 42.8% YoY and ordinary profit by 45.8% YoY, driven by the following combined factors:
- Increase in Domestic Sales Volume : Sales volume grew steadily, centered on resilient demand for daily necessities such as produce and processed foods.
- Realization of Productivity Improvements : Investments in automation and efficiency at manufacturing sites, along with process reviews, yielded tangible results, contributing to cost containment and improved profit margins.
- Steady Penetration of Product Price Revisions : Price revisions reflecting rising costs for raw materials, logistics, and energy were successfully implemented, leading to improved spreads.
- Recovery in Overseas Markets and M&A Effects : In addition to a sales recovery in the Vietnam business, synergies from recent M&A activities and business scale expansion bolstered group-wide earnings.
While net income saw a slight impact from the absence of significant gains on the sale of investment securities recorded in the previous year, the company still achieved a 5.5% YoY increase in net income, driven by growth in core operating profit.
3. Business Structure and Segment Performance
Dynapac’s business foundation is centered on the "Packaging-Related Business," which accounts for 99.5% of total sales .
- Packaging-Related Business : H1 sales reached 38.2 billion yen (+15.0% YoY). The sales breakdown consists of corrugated cardboard (74%) , which is the core product, flexible packaging (11%) for food and daily goods, printed paper containers (10%) such as store POP and luxury packaging, and 5% from other sources. The company maintains a broad portfolio ranging from industrial to consumer goods, capturing stable demand in each sector.
- Real Estate Leasing Business : H1 sales were 200 million yen (+2.2% YoY), continuing to perform steadily as a stable revenue source.
4. Financial Position and Cash Flow
Balance Sheet (B/S) Trends
- Total Assets : 88.419 billion yen (+3.312 billion yen / +3.9% from previous year-end)
- Net Assets : 50.498 billion yen (+2.554 billion yen / +5.3% from previous year-end)
- Equity Ratio : 55.9% (+0.8pt from previous year-end)
Net assets exceeded 50 billion yen due to an increase in cash and cash equivalents and the accumulation of retained earnings. The equity ratio remains high at 55.9%, reflecting a sound financial position.
Cash Flow (C/F) Trends
- Operating CF : +2.397 billion yen (maintaining high cash-generating capability from core business)
- Investing CF : -1.260 billion yen (primarily for capital expenditures)
- Financing CF : +365 million yen
- Cash and Cash Equivalents at H1 End : 6.666 billion yen (an increase of approximately 1.5 billion yen from the previous year-end)
Operating cash flow remains solidly positive, providing the financial flexibility to balance growth investments with shareholder returns.
5. Significant Upward Revision of Full-Year FY2026 Earnings Forecast
Reflecting the strong first-half performance, the full-year consolidated earnings forecast has been revised upward.
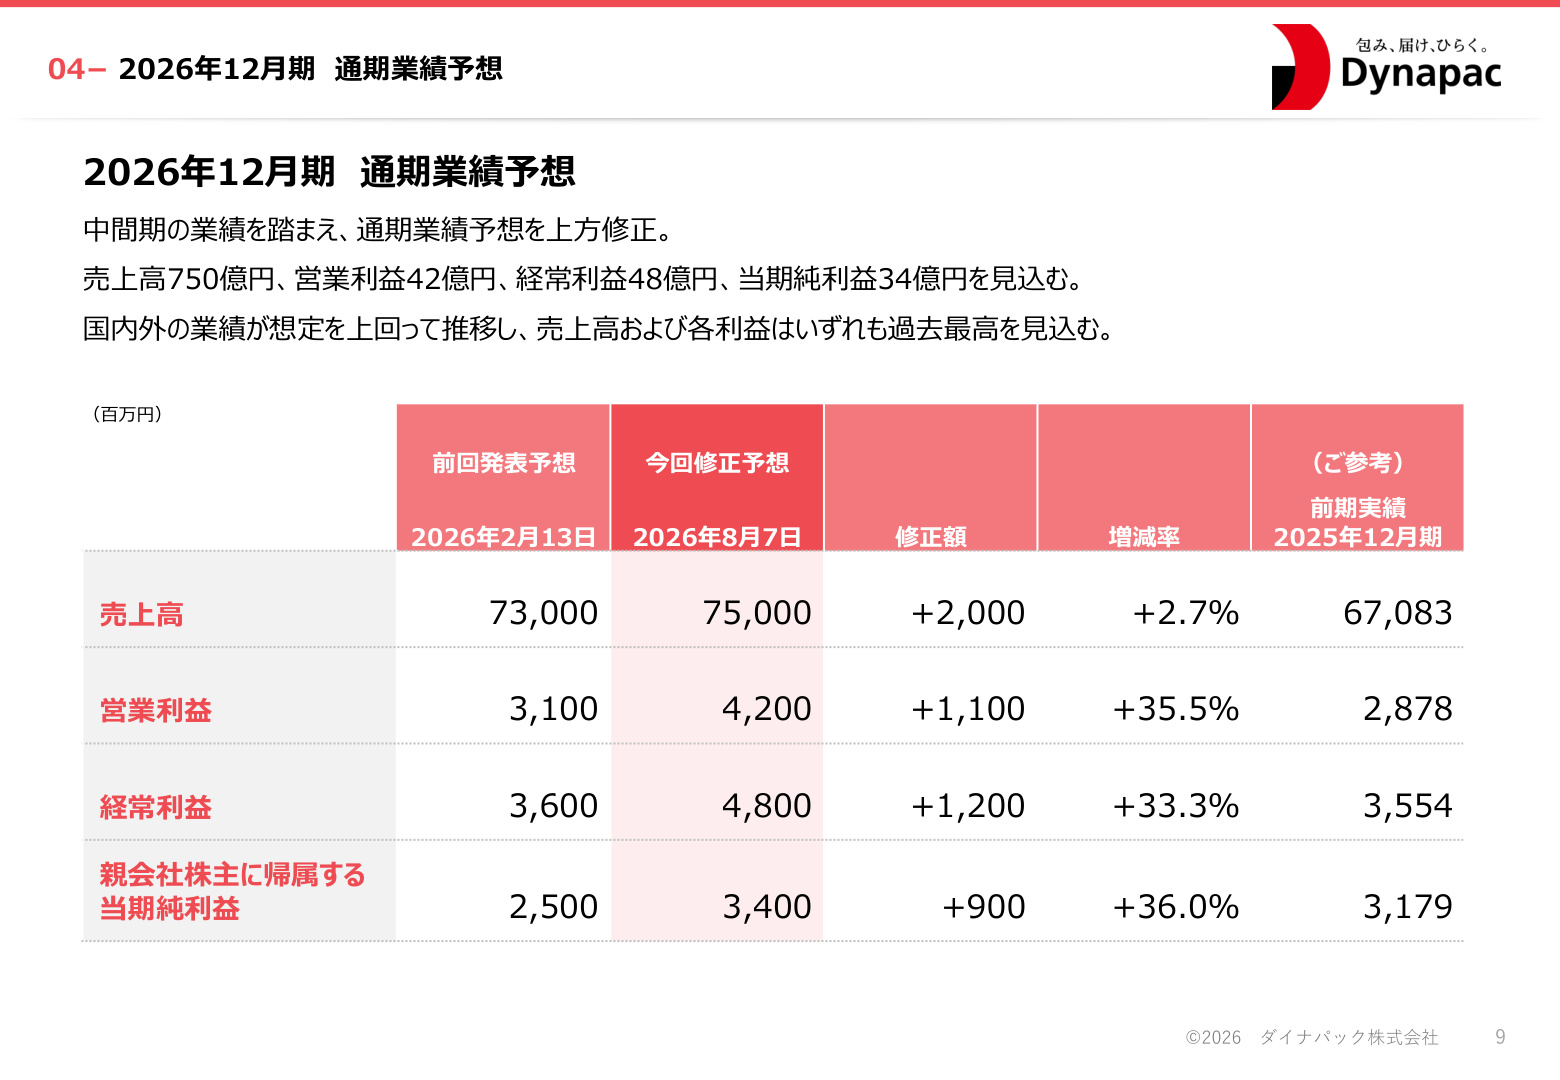
Key Points of the Full-Year Forecast Revision
- Net Sales : 75 billion yen (+2 billion yen / +2.7% vs. previous forecast, +11.8% YoY)
- Operating Profit : 4.2 billion yen (+1.1 billion yen / +35.5% vs. previous forecast, +45.9% YoY)
- Ordinary Profit : 4.8 billion yen (+1.2 billion yen / +33.3% vs. previous forecast, +35.1% YoY)
- Net Income : 3.4 billion yen (+900 million yen / +36.0% vs. previous forecast, +6.9% YoY)
Significance of the Slide and Background (Full-Year Forecast)
This slide demonstrates that the strong first-half performance is not a one-time event but reflects an improvement in the profit structure throughout the fiscal year. Operating profit has been significantly raised from the initial forecast of 3.1 billion yen to 4.2 billion yen (+35.5%) , representing a substantial increase over the previous year's results (2.878 billion yen). The forecast assumes that the synergy of higher-than-expected demand, price revisions, and productivity improvements will continue through the second half.
6. Progress of Mid-Term Management Plan (2024–2026) and Capital Efficiency
Dynapac is currently executing its three-year Mid-Term Management Plan, and this upward revision brings the company significantly closer to achieving its final-year targets.
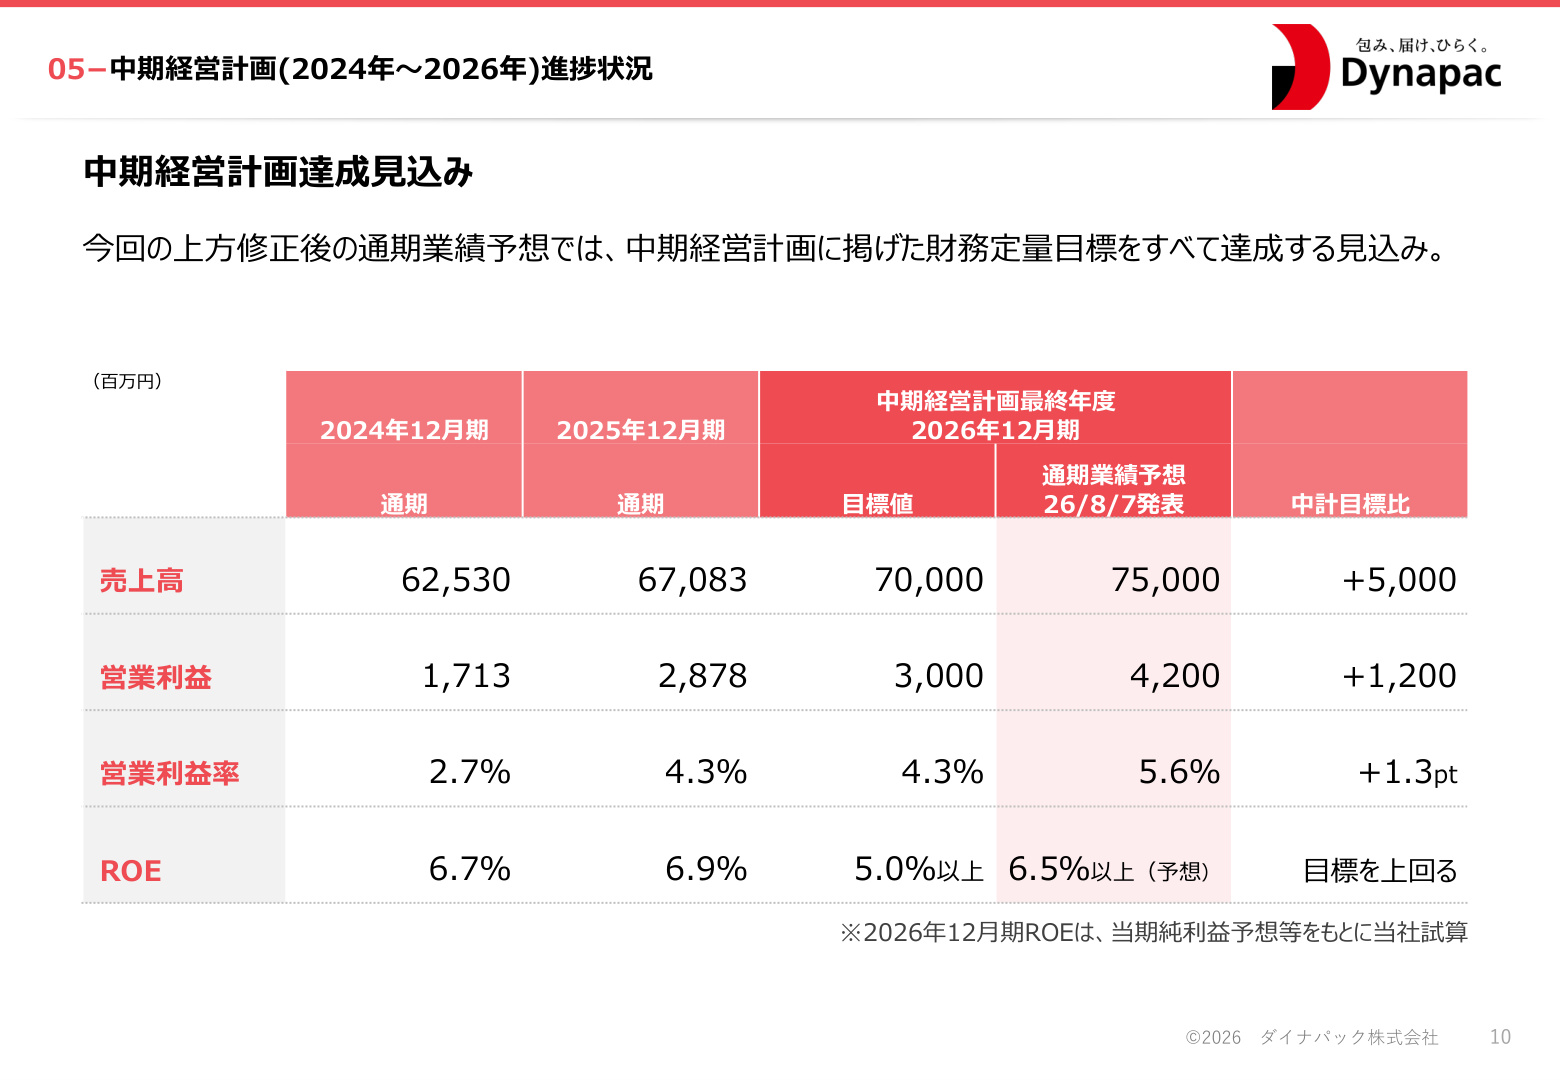
Comparison of Mid-Term Plan Targets and Projections
| Metric | FY2024 Actual | FY2025 Actual | Final Year (2026) Target | FY2026 Revised Forecast | vs. Target |
|---|---|---|---|---|---|
| Net Sales | 62.53 billion yen | 67.083 billion yen | 70 billion yen | 75 billion yen | +5 billion yen |
| Operating Profit | 1.713 billion yen | 2.878 billion yen | 3 billion yen | 4.2 billion yen | +1.2 billion yen |
| Operating Margin | 2.7% | 4.3% | 4.3% | 5.6% | +1.3pt |
| ROE | 6.7% | 6.9% | 5.0% or more | 6.5% or more (est.) | Exceeding Target |
Significance of the Slide and Background (Mid-Term Plan Progress)
This slide objectively shows that the company's growth phase is progressing faster than anticipated during the planning stage. Particularly noteworthy is the improvement in profitability and capital efficiency .
- The operating margin has steadily improved from 2.7% in 2024 to a projected 5.6% in 2026, exceeding the target (4.3%) by 1.3 percentage points.
- ROE (Return on Equity) is also projected to be 6.5% or more , significantly clearing the target of "5.0% or more," confirming that the strengthening of core profitability is directly linked to improved capital efficiency.
7. Shareholder Return Policy (Continued Dividend Growth)
In line with the upward revision of earnings, the company has signaled a strengthening of its shareholder return stance.
- Dividend Policy : Based on a policy of stable and consistent profit distribution, while remaining conscious of the cost of capital.
- Dividend per Share : Upwardly revised by 10 yen from the previous year (80 yen) to 90 yen annually (year-end lump sum).
- Dividend Trend : This marks four consecutive years of dividend growth (2022: 50 yen → 2023: 60 yen → 2024: 70 yen → 2025: 80 yen → 2026 forecast: 90 yen).
- Projected Payout Ratio : 25.8% (linked to the expansion of core business earnings).
Against the backdrop of steady improvements in core profitability, the company continues to maintain a return policy that meets market expectations for PBR (Price-to-Book Ratio) improvement.
8. Future Outlook and Summary
Dynapac’s H1 FY2026 results were exceptionally strong, driven by the successful pass-through of raw material costs, on-site productivity improvements, and a recovery in M&A and overseas operations, leading to record-high profits. The company is on track to achieve its Mid-Term Management Plan targets ahead of schedule, with notable improvements in capital efficiency metrics such as profit margins and ROE.
Key points to watch in future business development include:
- Sustainability of Price Revisions and Volume Growth : Can the company maintain price levels while expanding volume in the second half, supported by resilient demand for food and produce?
- Continuity of Productivity Improvements : To what extent will the improvement in marginal profit ratios through automation and rationalization become permanent?
- Progress in Overseas Business (Vietnam, etc.) and M&A Synergies : The degree of contribution as a growth driver for the entire group.
- Further Progress in Capital Efficiency and Shareholder Returns : Financial strategies focused on PBR improvement and preparations for the next Mid-Term Management Plan.
Dynapac’s efforts to strengthen profitability and expand returns, built upon a foundation of high financial soundness, remain a key focus for investors.
This content is not intended as investment advice or a recommendation. Any opinions expressed are solely the personal views of each article.