


【And Do Holdings】FY2026 Earnings Deep Dive: Navigating Portfolio Restructuring and Inventory Optimization Toward Accelerated Growth by 2030

StockClub
Published: Aug 21, 2026, 09:52 AM
Sentiment Analysis

1. FY2026 Earnings Summary and Overview of Structural Reform
And Do Holdings Inc. (3457) reported consolidated financial results for the fiscal year ended June 2026, with net sales of ¥49,617 million (down 23.4% YoY, 9.8% below initial forecast), operating profit of ¥1,120 million (down 57.3% YoY, 61.4% below initial forecast), ordinary profit of ¥1,120 million (down 61.9% YoY, 62.7% below initial forecast), and profit attributable to owners of the parent of ¥1,452 million (down 38.0% YoY, 47.6% below initial forecast).
This fiscal year marked a transition from a capital-intensive model to a leaner business structure focused on capital efficiency, characterized by intensive efforts in "business portfolio restructuring" and "asset health optimization." While both sales and profits fell short of the previous year's results and initial forecasts, this was largely due to temporary business downsizing and the disposal of stagnant inventory, serving as a strategic foundation for future capital efficiency improvements.
2. Analysis of Shortfalls and Progress in Structural Reform
The failure to meet initial targets was driven by a combination of factors. The primary causes were temporary revenue declines resulting from the "selection and concentration" of businesses, alongside the time lag associated with upfront investments for future growth.
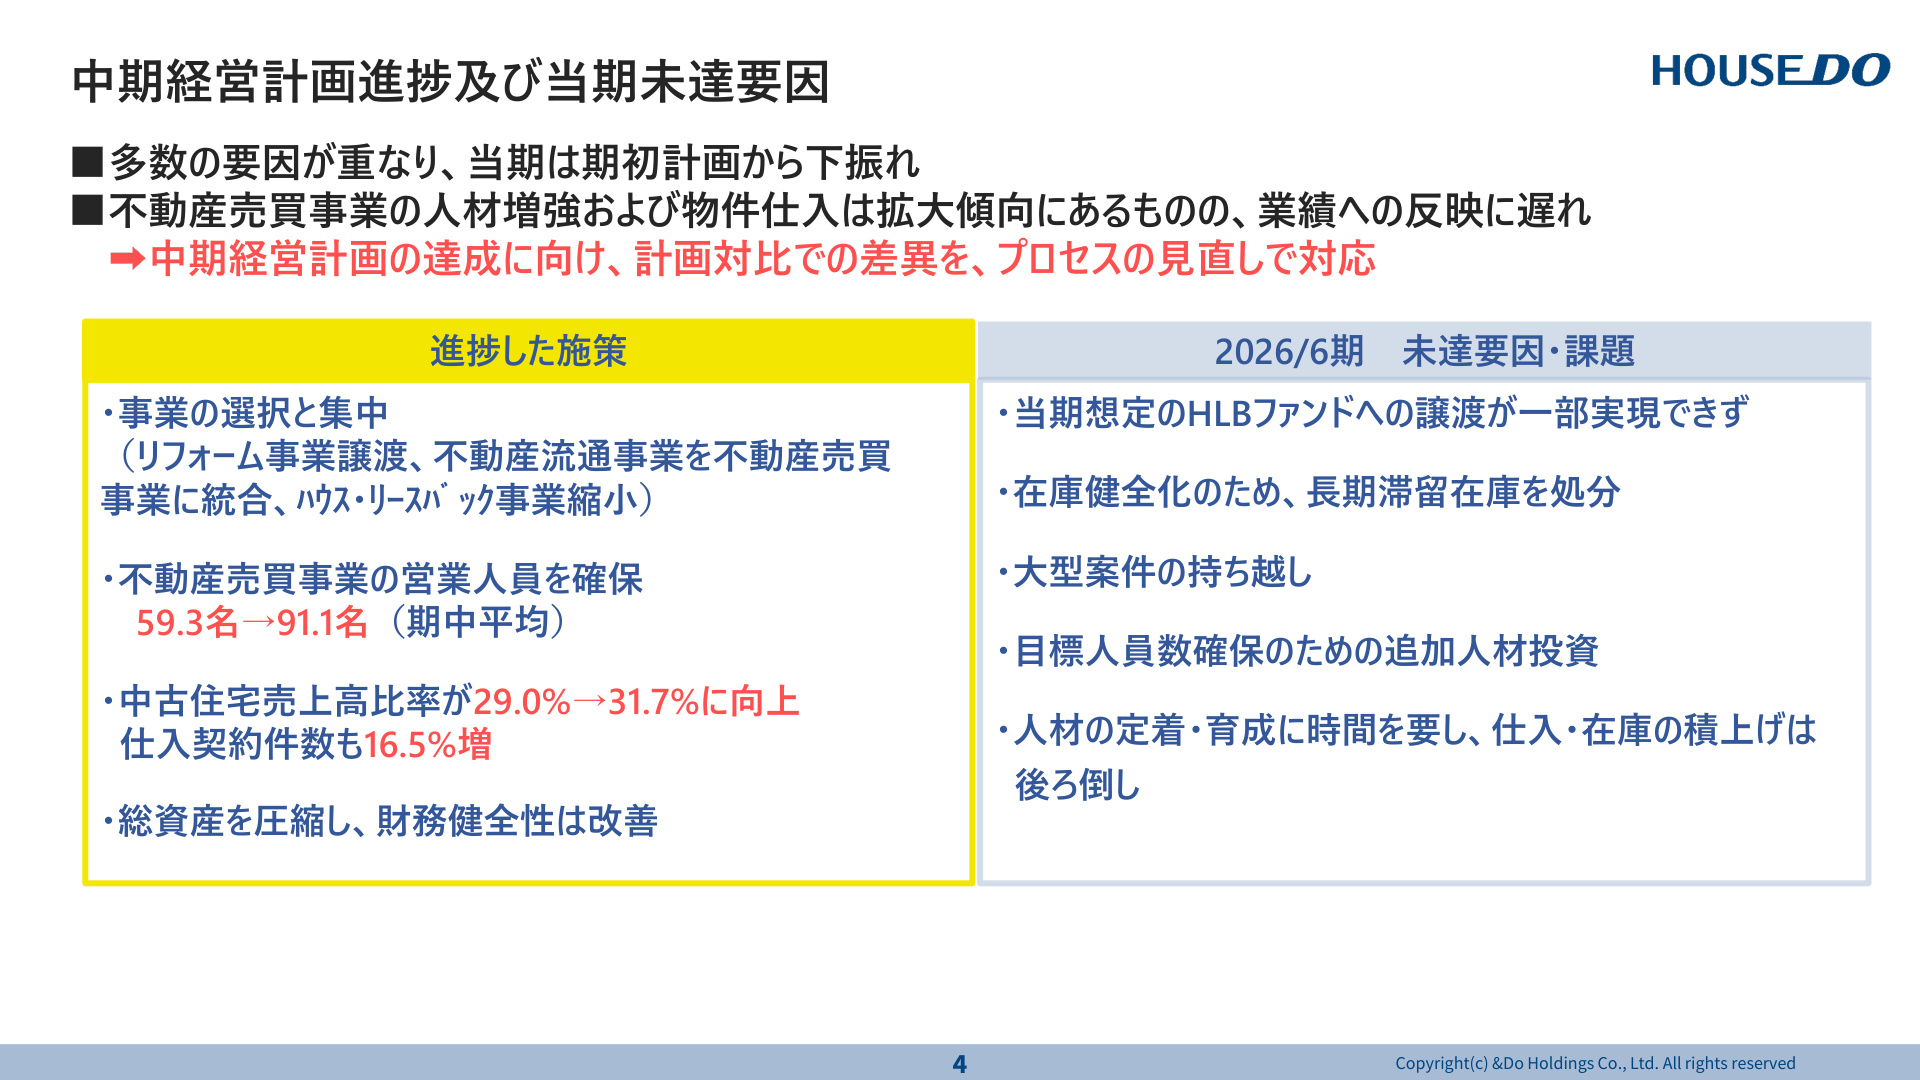
Slide Commentary: Progress of Initiatives and Structural Causes of Shortfalls
The slide above is a critical document summarizing the progress of the medium-term management plan and the reasons for the shortfalls, clearly illustrating the "pros and cons" of the business structural reform.
- Progressed Initiatives :
- Executed "selection and concentration" by divesting the renovation business, integrating the real estate distribution business into the real estate trading business, and intentionally downsizing the House Leaseback (HLB) business.
- Significantly increased the average number of sales personnel in the core real estate trading business from 59.3 to 91.1 .
- Increased the number of purchase contracts for pre-owned homes by 16.5% , with their sales ratio rising to 31.7% .
- Improved financial health by reducing total assets and increasing the equity ratio.
- Challenges Leading to Shortfalls :
- Partial delays or non-realization of planned asset transfers to HLB funds.
- Temporary pressure on profit margins due to the early disposal of long-term stagnant inventory to improve asset turnover.
- Carry-over of large-scale transaction settlements.
- While upfront costs were incurred for aggressive hiring, the lead time required for personnel to become fully productive (1 year to 1 year and 3 months) caused a delay in the accumulation of purchases and inventory until the second half of the fiscal year .
These factors are characterized as "growing pains" associated with the business model transformation, serving to solidify the foundation for earnings recovery from the next fiscal year onward.
3. Strengthening the Financial Base and Cash Flow Trends
Although earnings were in an adjustment phase, the strengthening of the balance sheet and cash flow generation have steadily progressed .
- Compression of Assets and Liabilities : Total assets decreased by ¥4,174 million from the end of the previous fiscal year to ¥67,798 million . Inventories were reduced to ¥39,823 million (down ¥3,355 million), and property, plant, and equipment were reduced to ¥6,125 million (down ¥2,125 million). Total liabilities also decreased to ¥48,780 million (down ¥4,740 million).
- Improvement in Financial Indicators : The equity ratio improved from 25.6% at the end of the previous fiscal year to 28.0% (+2.4pt) , and the D/E ratio declined from 2.6x to 2.3x (-0.3x) , reflecting a policy of curbing financial leverage.
- Cash Flow Generation : Partly due to the delayed pace of inventory purchases, free cash flow remained positive at ¥5,652 million , marking the third consecutive year of high-level cash generation.
4. Segment Performance
(1) Financial Business: The Driver of High Growth and High Profitability
- Net Sales : ¥641 million ( +13.8% YoY)
- Operating Profit : ¥262 million ( +46.3% YoY, Operating Margin 40.9% )
- The reverse mortgage guarantee business performed well, particularly in the Tokyo metropolitan area, with the cumulative guarantee balance exceeding ¥35.34 billion (an increase of ¥7.16 billion, +300 contracts to 2,308 contracts). With extremely high capital efficiency, it contributes to the group's profit margin as a stable source of recurring revenue.
(2) Franchise (FC) Business: A Solid Foundation for Recurring Revenue
- Net Sales : ¥3,324 million ( +3.5% YoY)
- Operating Profit : ¥1,928 million ( +0.4% YoY, Operating Margin 58.0% )
- The cumulative number of franchise stores reached 733 (+8 stores) , with 637 stores opened (+13 stores). The launch of contracted franchises progressed, with the number of new store openings increasing significantly to 111 (+32.1% YoY). Maintaining high profit margins, this segment remains a robust foundation for the group.
(3) House Leaseback (HLB) Business: Ongoing Downsizing Process
- Net Sales : ¥9,595 million ( -50.7% YoY)
- Operating Profit : ¥889 million ( -60.7% YoY)
- Following the policy of moving away from a capital-intensive model, the company focused on compressing held assets and strictly selecting new purchases, resulting in a significant decline in both sales and profit. The optimization of holdings is progressing, reducing business risk.
5. Transformation and Inventory Optimization of the "Real Estate Trading Business"
The group's core real estate trading business (including the former real estate distribution business) reported net sales of ¥35,246 million (down 10.8% YoY) and operating profit of ¥1,713 million (down 32.7% YoY).
The short-term profit decline was driven by a strategic shift from large-scale, multi-lot projects with long development periods and high capital requirements to "pre-owned homes and small-scale projects" with higher turnover, accompanied by the thorough disposal of long-term stagnant inventory .
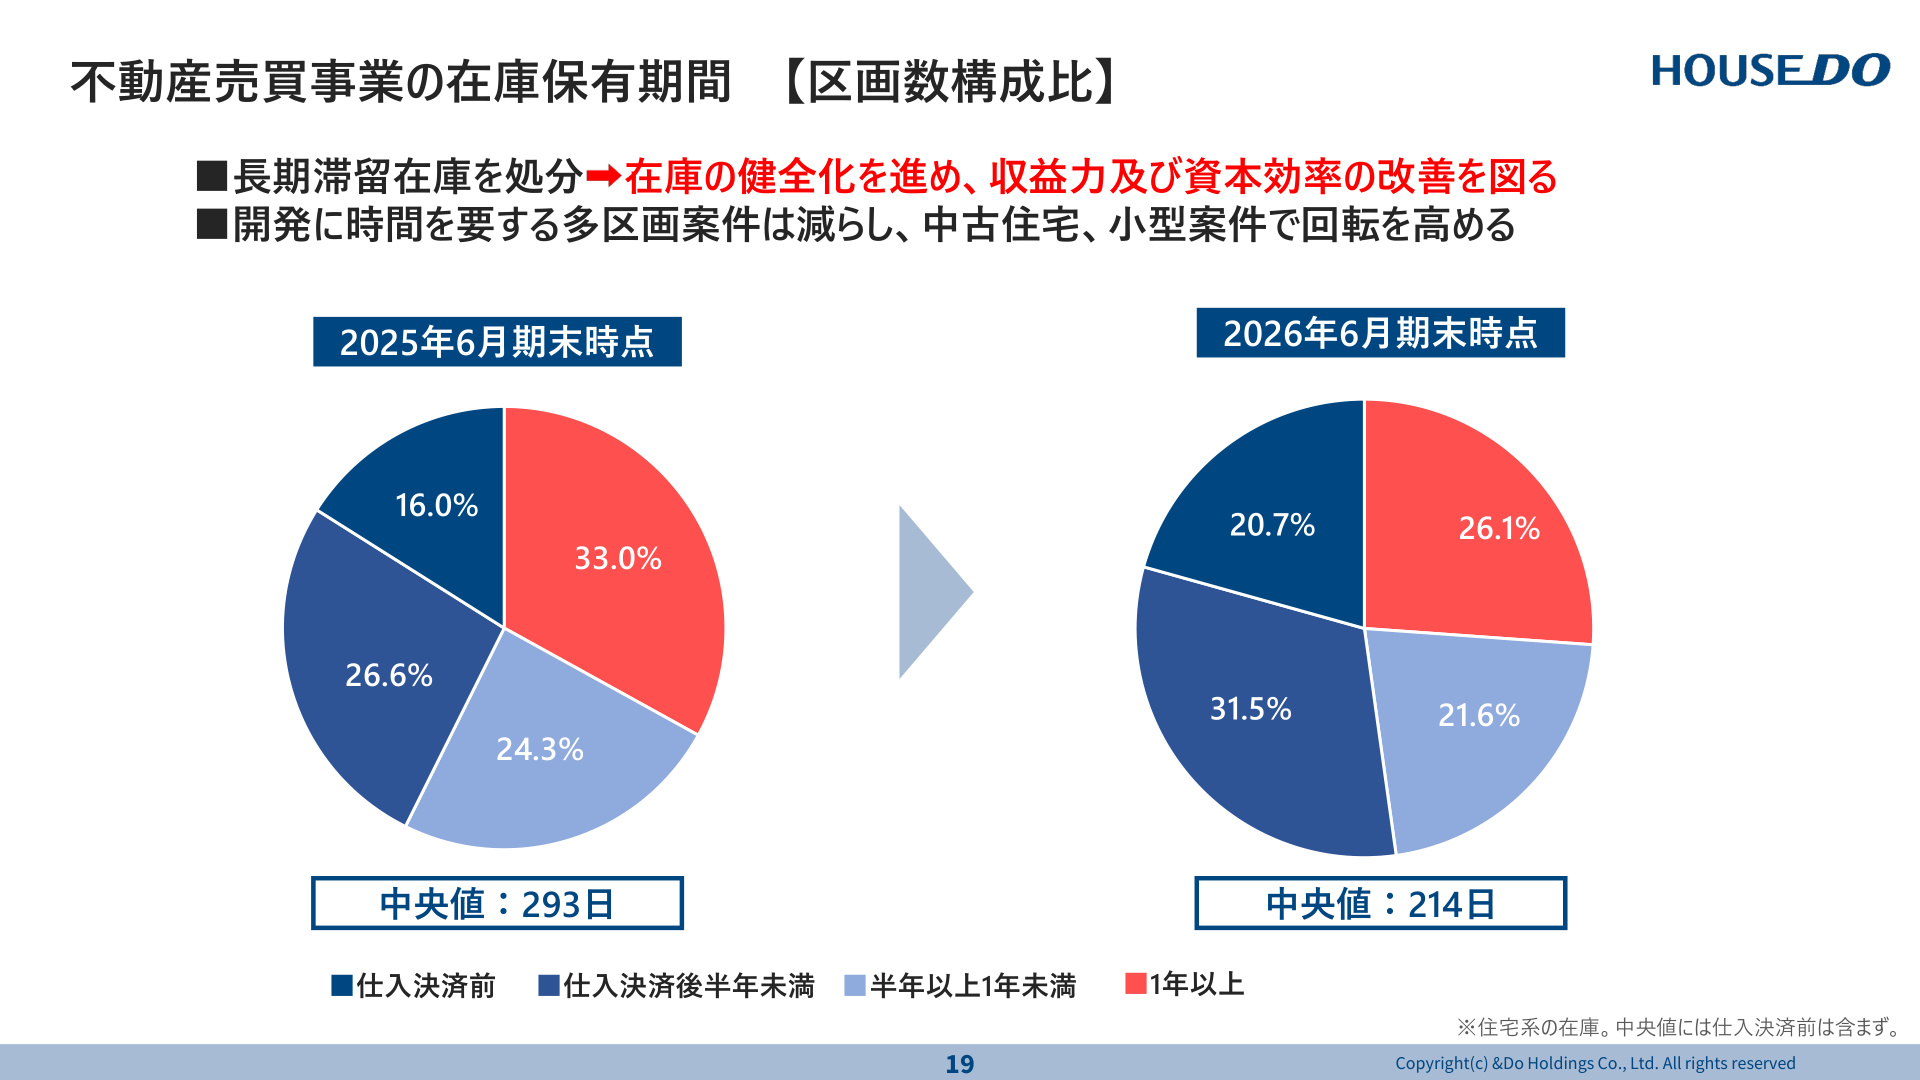
Slide Commentary: Dramatic Improvement in Inventory Holding Period
The slide above shows the composition of held lots by period and the median inventory holding period in the real estate trading business.
- Compression of Long-term Stagnant Inventory (1 year+) : The ratio of inventory held for "1 year or more," which accounted for 33.0% at the end of FY2025, dropped significantly to 26.1% at the end of the current fiscal year.
- Shortening of Inventory Holding Period : The median inventory holding period was reduced by approximately 79 days, from 293 days to 214 days . The ratio of fresh inventory held for less than six months after purchase settlement has risen to 31.5%, numerically demonstrating the rapid improvement in asset turnover efficiency.
Against the backdrop of a widening price gap between new and pre-owned homes, demand for the purchase and resale of pre-owned homes is structurally expanding. The ratio of pre-owned homes in housing-related sales has steadily increased from 29.0% to 31.7% (+12.4% revenue growth) , indicating a shortening cycle from purchase to sale.
6. FY2027 Earnings Forecast and Dividend Policy
The consolidated earnings forecast for the fiscal year ending June 2027 is as follows:
- Net Sales : ¥45,000 million (down 9.3% YoY)
- Operating Profit : ¥1,400 million ( +25.0% YoY)
- Ordinary Profit : ¥1,350 million ( +20.5% YoY)
- Profit Attributable to Owners of the Parent : ¥891 million (down 38.7% YoY)
- Annual Dividend Forecast : ¥46.00 per share (maintained at the same level as the previous year, dividend payout ratio of 103.1% )
While sales are expected to decline due to the renovation business divestiture and further downsizing of the HLB business (HLB sales forecast: ¥4,190 million, -56.3%), the recovery of the real estate trading business (operating profit +18.5%) and the leap in the financial business (operating profit +128.5% to ¥600 million) are expected to drive a significant increase in core operating and ordinary profits. The decline in net profit is a reaction to the business transfer gain (extraordinary profit of ¥1,382 million) recorded in the previous fiscal year. Regarding shareholder returns, the company has indicated a policy of maintaining stable dividends even during this transition period.
7. Growth Roadmap of the New Medium-Term Management Plan (FY2026/6–FY2030/6)
The company has set forth a long-term growth scenario leading up to the fiscal year ending June 2030.
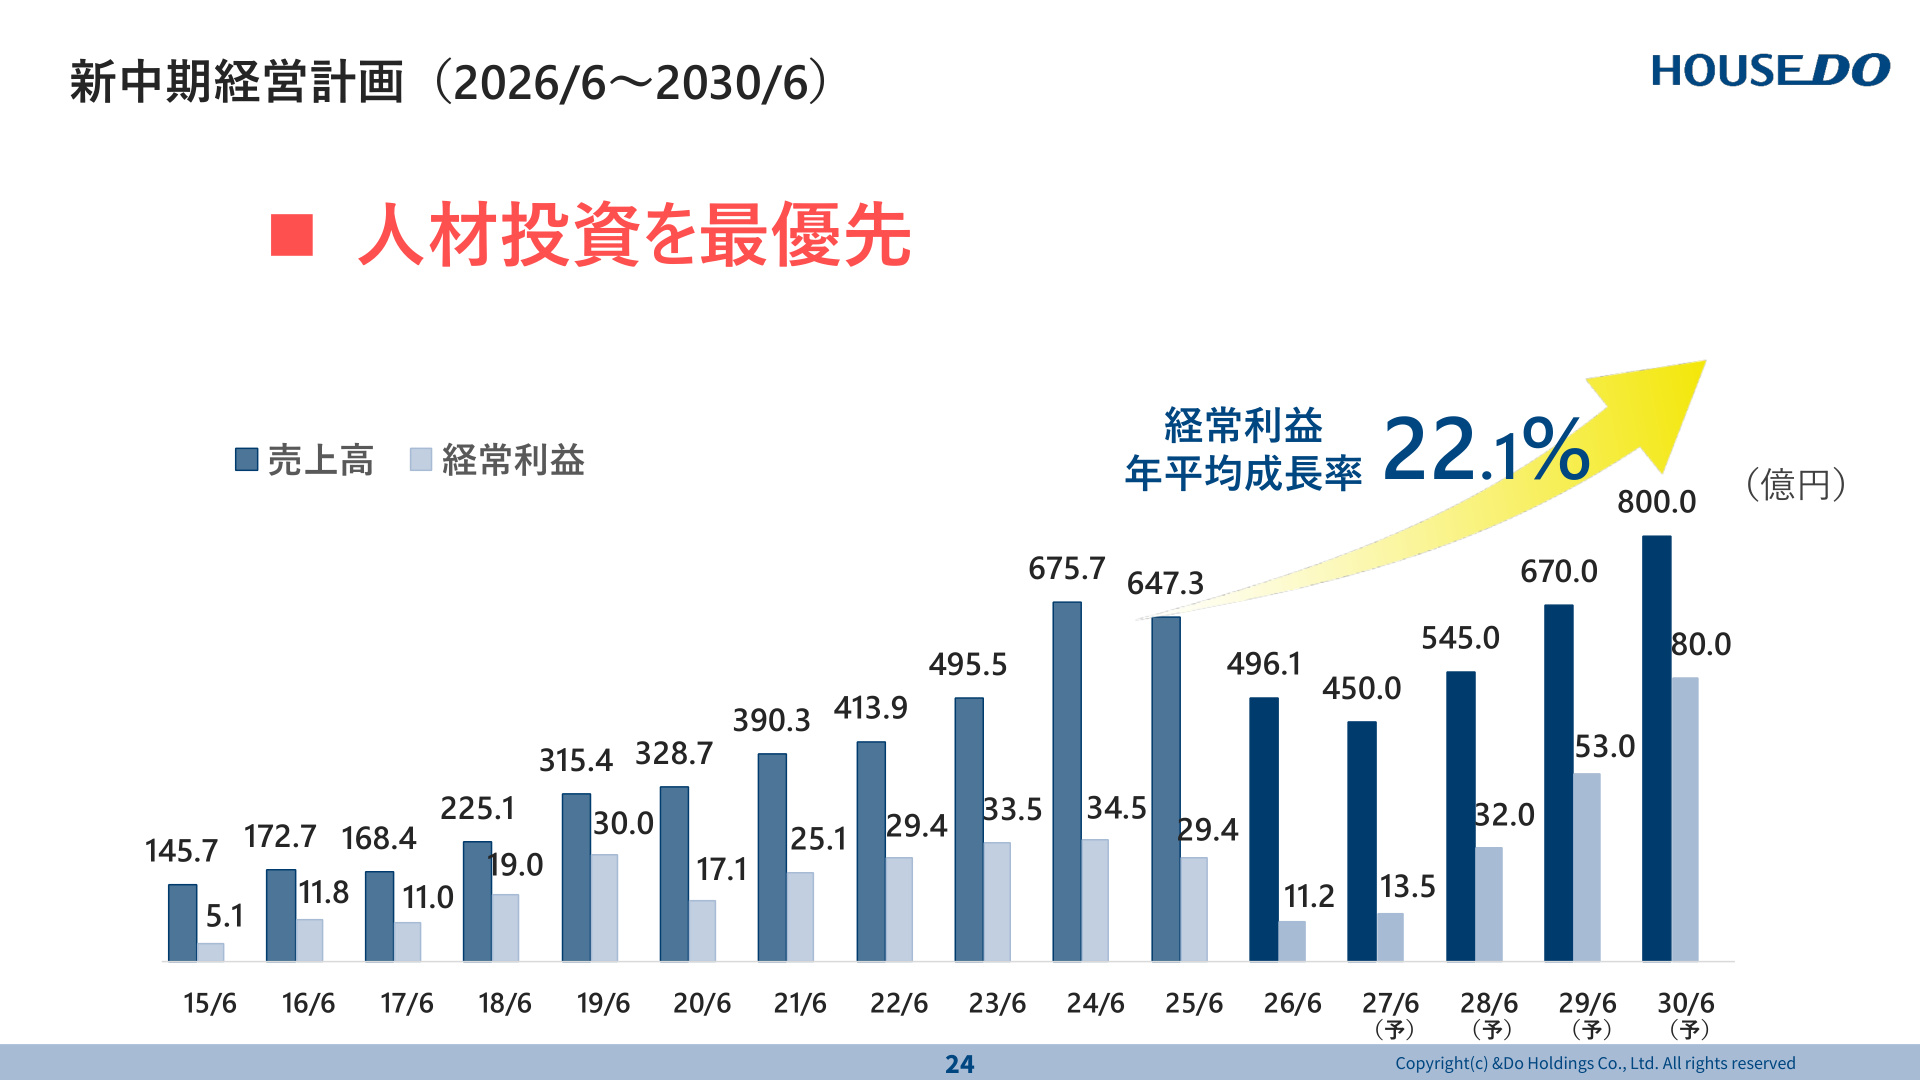
Slide Commentary: Blueprint for Profit Growth Driven by Human Capital Investment
The slide above shows the long-term targets for net sales and ordinary profit through the fiscal year ending June 2030.
- Quantitative Targets : The company aims for ¥80.0 billion in net sales and ¥8.0 billion in ordinary profit by the fiscal year ending June 2030. Starting from the FY2026 result of ¥1.12 billion, this represents an ambitious growth trajectory with a Compound Annual Growth Rate (CAGR) of 22.1% for ordinary profit.
- Growth Mechanism :
- In the real estate trading business, the number of sales personnel will be increased by approximately 2.7x, from 91.1 in the current fiscal year to 250 by the fiscal year ending June 2030 .
- Building a cycle of "Increase in sales staff → Increase in purchase contracts → Increase in inventory turnover/sales volume → Expansion of sales and profit."
- With a lead time of 1 year to 1 year and 3 months from hiring to profitability, the personnel invested in during the current and next fiscal years are structured to drive full-scale rapid earnings expansion from the fiscal year ending June 2028 onwards.
- Capital Efficiency Target : The company aims for an ROIC of 6% or higher by the fiscal year ending June 2030 , recovering from the temporary decline during the transition period.
8. Summary and Future Focus Points
Although And Do Holdings' FY2026 earnings saw a decline due to business restructuring and the disposal of stagnant inventory, the structural reform objectives of "shifting to businesses with higher capital efficiency," "shortening inventory turnover periods," and "improving financial health" are being steadily executed.
Key points to watch in the future include:
- The progress in making the newly hired sales personnel productive and maintaining the turnover rate of pre-owned home purchase and resale.
- The expansion of partner financial institutions and the growth speed of the balance in the high-margin reverse mortgage guarantee business (Financial Business).
- The certainty of the ramp-up toward the rapid profit expansion phase of the medium-term management plan scheduled from the fiscal year ending June 2028.
Attention will be focused on how the company, having emerged from this period of transformation, realizes its stated growth story.
This content is not intended as investment advice or a recommendation. Any opinions expressed are solely the personal views of each article.