

Serendip Holdings: Q1 FY2027 Earnings & 'Challenge 1000' Mid-Term Management Plan Deep Dive

StockClub
Published: Aug 20, 2026, 09:58 AM
Sentiment Analysis
Serendip Holdings: Q1 FY2027 Earnings & Mid-to-Long-Term Growth Strategy Deep Dive
Serendip Holdings Co., Ltd. (TSE Growth: 7318) is a unique corporate group that continues to expand its business centered on succession-based M&A of small and medium-sized manufacturing companies. This report provides a detailed analysis of the company's Q1 FY2027 (ending March 2027) financial results and its new mid-term management plan, "Serendip Challenge 1000," covering recent performance, segment-specific status, the new financing platform, and future growth drivers.
1. Q1 FY2027 Earnings Highlights
In the first quarter, consolidated performance reached record-high levels in both revenue and profit at various stages , driven largely by the full-year contribution of the major M&A (Sertec Kariya) executed in the previous fiscal year.
Key Financial Summary
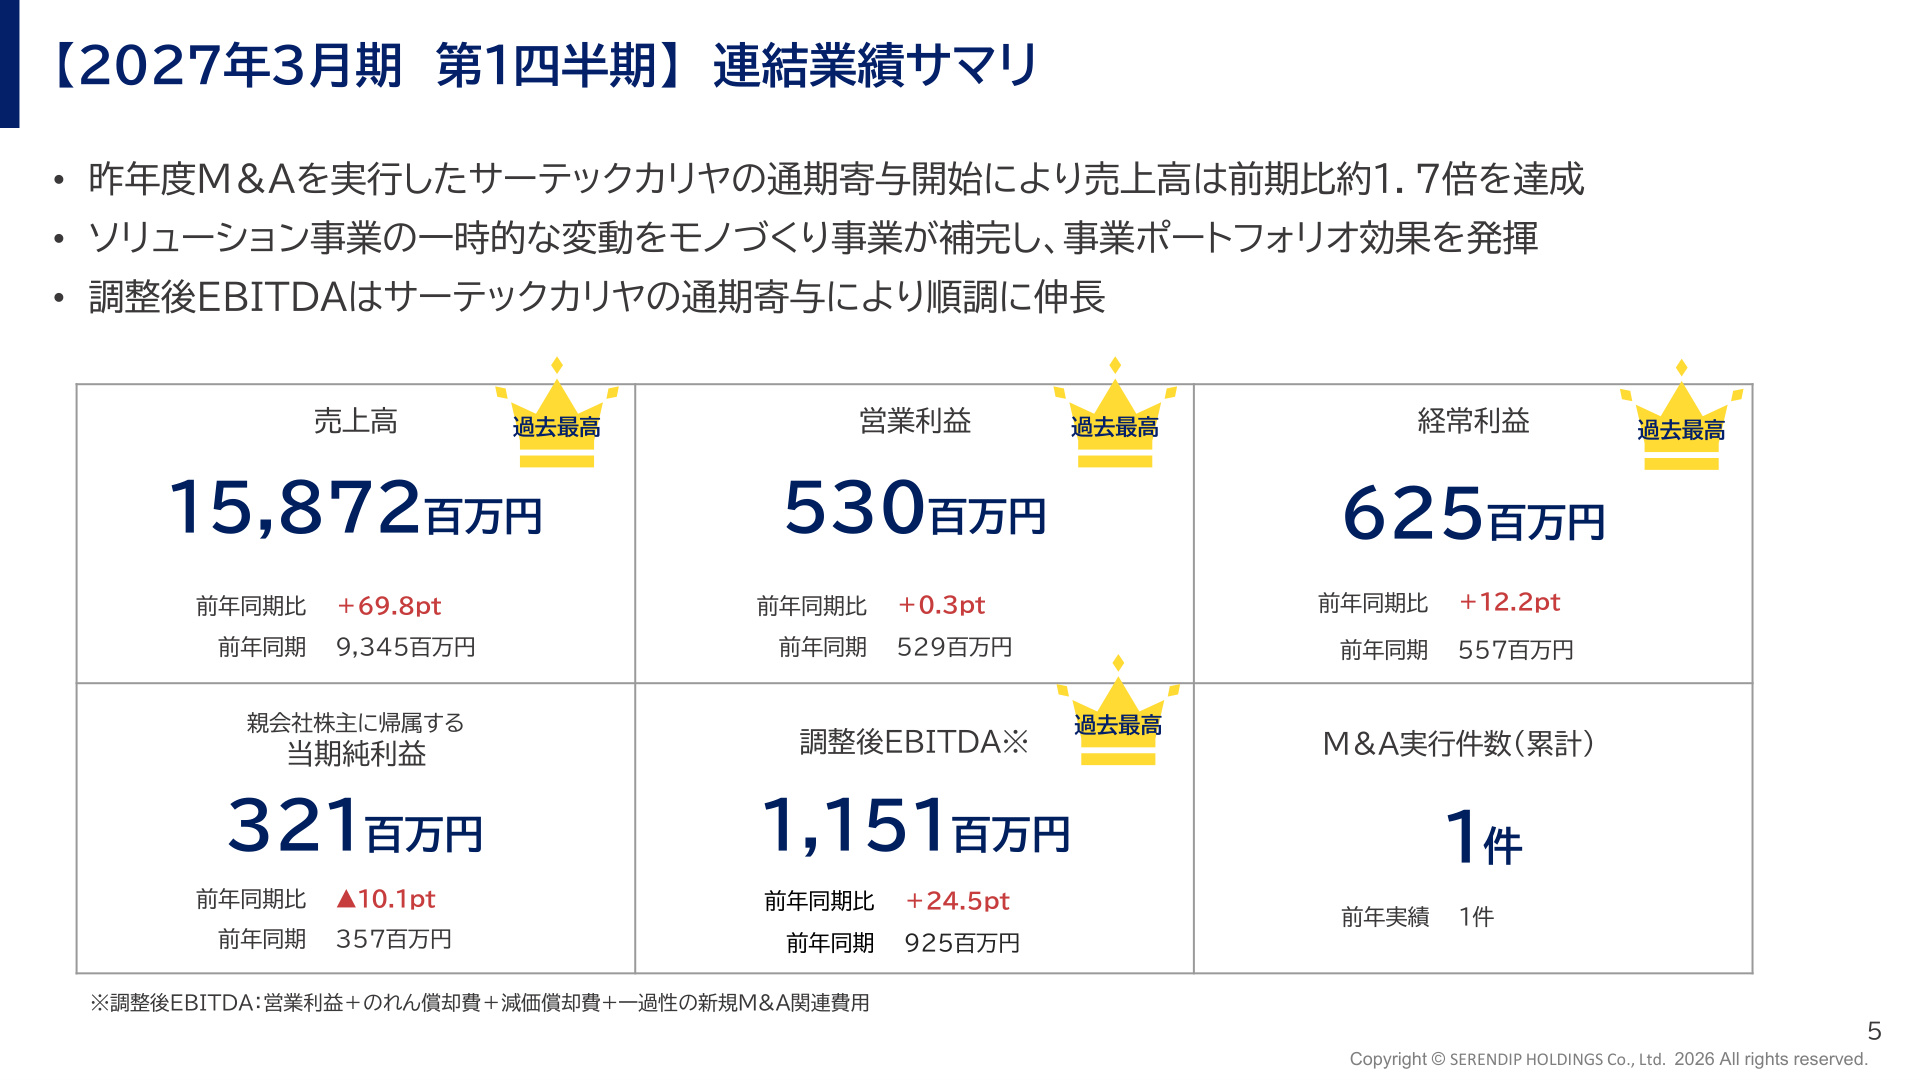
- Revenue : 15,872 million JPY (+69.8% YoY / 9,345 million JPY in Q1 FY2026)
- Operating Profit : 530 million JPY (+0.3% YoY / 529 million JPY in Q1 FY2026)
- Ordinary Profit : 625 million JPY (+12.2% YoY / 557 million JPY in Q1 FY2026)
- Quarterly Net Profit Attributable to Owners of Parent : 321 million JPY (-10.1% YoY / 357 million JPY in Q1 FY2026)
- Adjusted EBITDA : 1,151 million JPY (+24.5% YoY / 925 million JPY in Q1 FY2026)
Revenue expanded rapidly by approximately 1.7 times, and Adjusted EBITDA , a key indicator of cash-generating capability, grew significantly by +24.5% YoY to over 1.15 billion JPY. While net profit saw a slight decline due to upfront M&A-related costs and tax effects, operating and ordinary profits—which reflect core business profitability—maintained steady positive growth.
2. Segment Trends and Performance Analysis
Starting this fiscal year, the company has reorganized its investment portfolio into two new segments: "Manufacturing Business (Stable/Foundation Area: 65% investment ratio)" and "Solution Business (High-Growth/High-Profit Area: 35% investment ratio)." In Q1, the mutual complementary effects of this portfolio were clearly demonstrated.
(1) Manufacturing Business (Foundation Area)
- Revenue : 14,620 million JPY (+81.4% YoY)
- Segment Profit : 750 million JPY (+56.9% YoY)
Analysis :
- Sertec Kariya (plating and surface treatment) , which joined the group last year, generated 5,075 million JPY in revenue and 204 million JPY in operating profit, acting as a powerful growth driver.
- Uniclea (metal press processing) saw segment profit surge to 108 million JPY (+248.4% YoY) due to cost improvements and increased in-house production.
- Mitsuiya Industry (resin molding) also performed well in both revenue and profit.
- Conversely, the Excel Group experienced a profit decline due to one-time costs associated with the withdrawal from its Czech operations; however, the company stated that this will not have a ripple effect beyond the second quarter.
(2) Solution Business (High-Growth/High-Profit Area)
- Revenue : 1,250 million JPY (-0.6% YoY)
- Segment Profit : -220 million JPY (vs. 16 million JPY profit in Q1 FY2026)
Analysis and Outlook :
- Manufacturing DX : "Serendip Robocross" grew rapidly with revenue of 115 million JPY (+155.6% YoY). However, the segment fell into a temporary loss due to delivery delays in large projects within the "Ax business" (-67 million JPY impact) and increased outsourcing costs, as well as additional design work for new development projects at "Tenryu Seiki" (-52 million JPY one-time impact).
- Prototyping/Design : "Apex" experienced a shift in the timing of revenue recognition for customer development projects.
- Recovery Plan : The company expects a recovery toward the second half of the year through the normalization of delayed projects, new large-scale shipments, and an increase in inquiries. The annual pipeline remains robust.
3. Launch of the New Mid-Term Management Plan: "Serendip Challenge 1000"
Following the achievement of its previous "Challenge 500" plan one year ahead of schedule, the company has launched a new mid-term management plan, "Serendip Challenge 1000," aimed at further scaling up.
Numerical Targets for FY2029
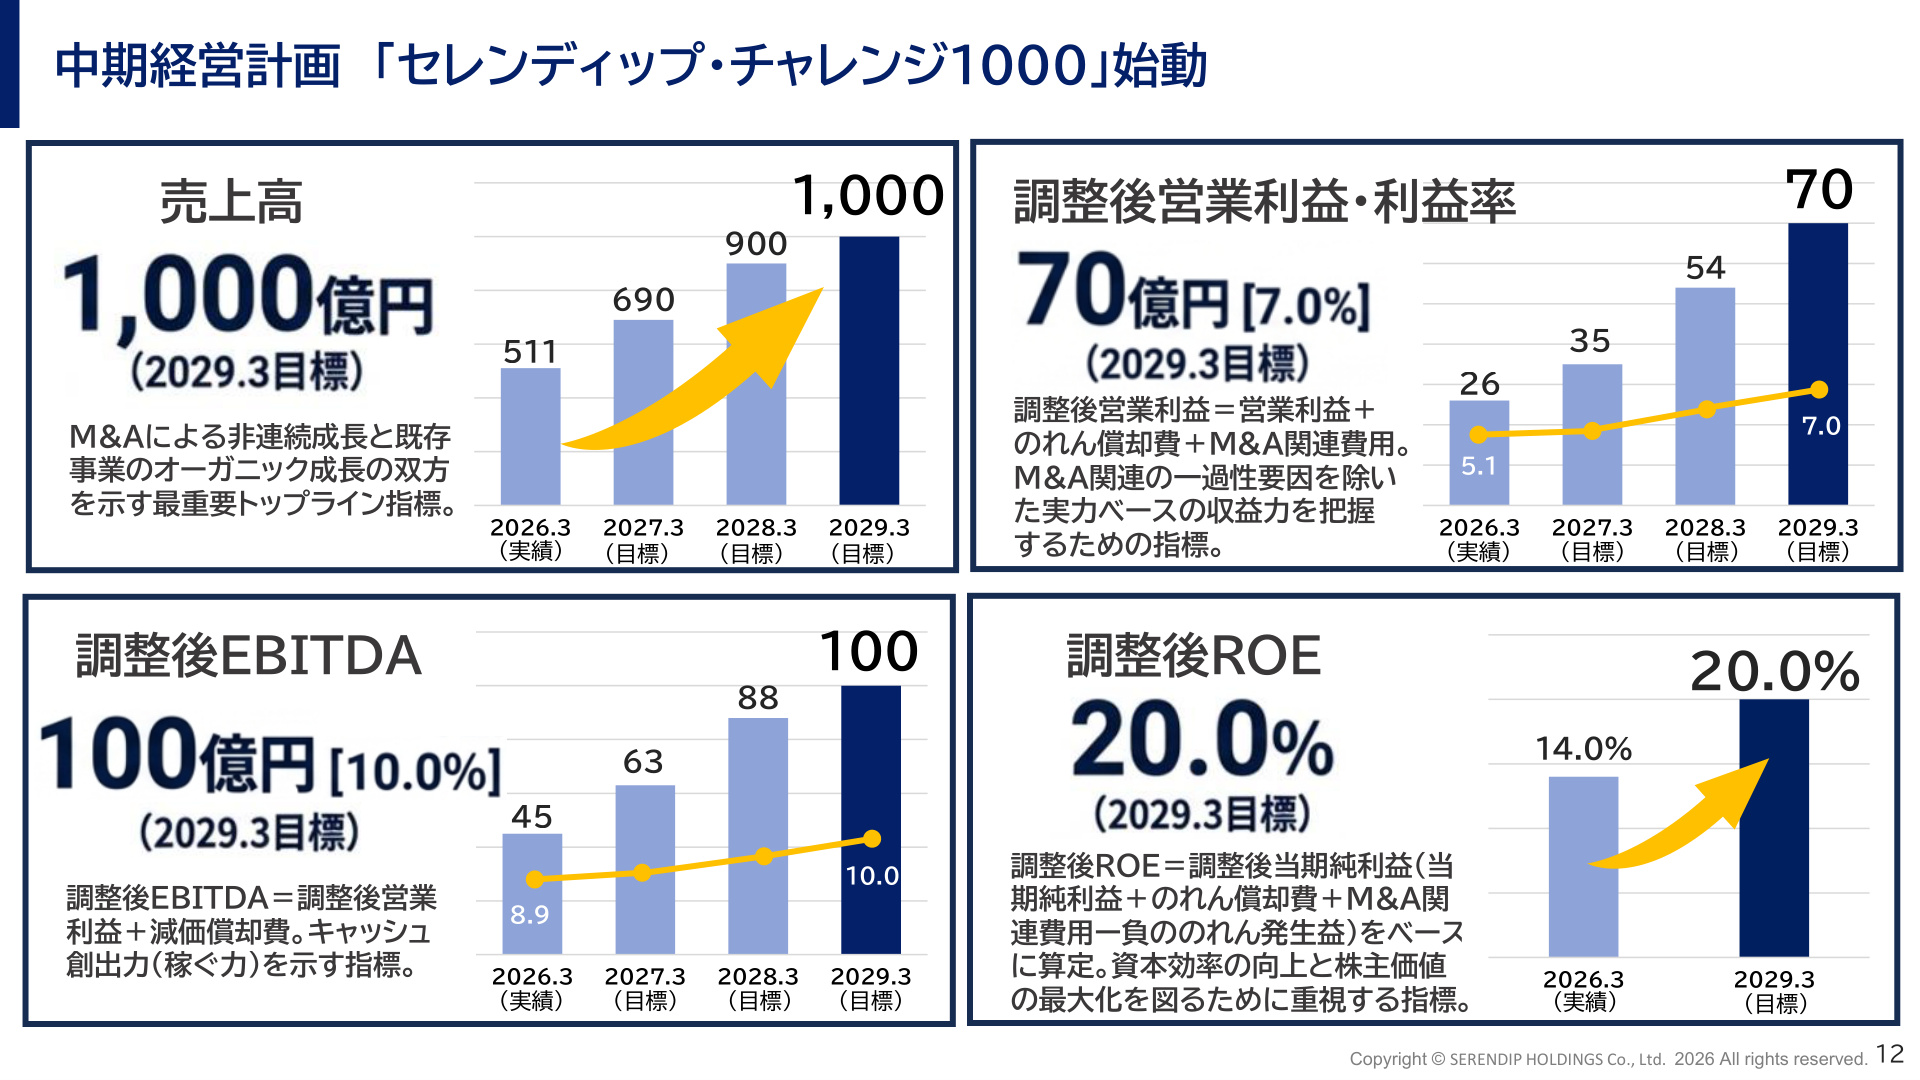
- Revenue : 100 billion JPY (Doubling from 51.1 billion JPY in FY2026)
- Adjusted Operating Profit : 7 billion JPY (Margin: 7.0% / vs. 2.6 billion JPY and 5.1% in FY2026)
- Adjusted EBITDA : 10 billion JPY (EBITDA Margin: 10.0% / vs. 4.5 billion JPY and 8.9% in FY2026)
- Adjusted ROE : 20.0% (vs. 14.0% in FY2026)
The roadmap to 100 billion JPY in revenue is built on a two-pronged structure: 39-40 billion JPY through "discontinuous growth (M&A)" and the remainder through "organic growth (unit supplier transformation, overseas expansion, new customer acquisition, and high-value-added services)."
4. Financial Strategy: Building the "JMS" Platform to Accelerate M&A
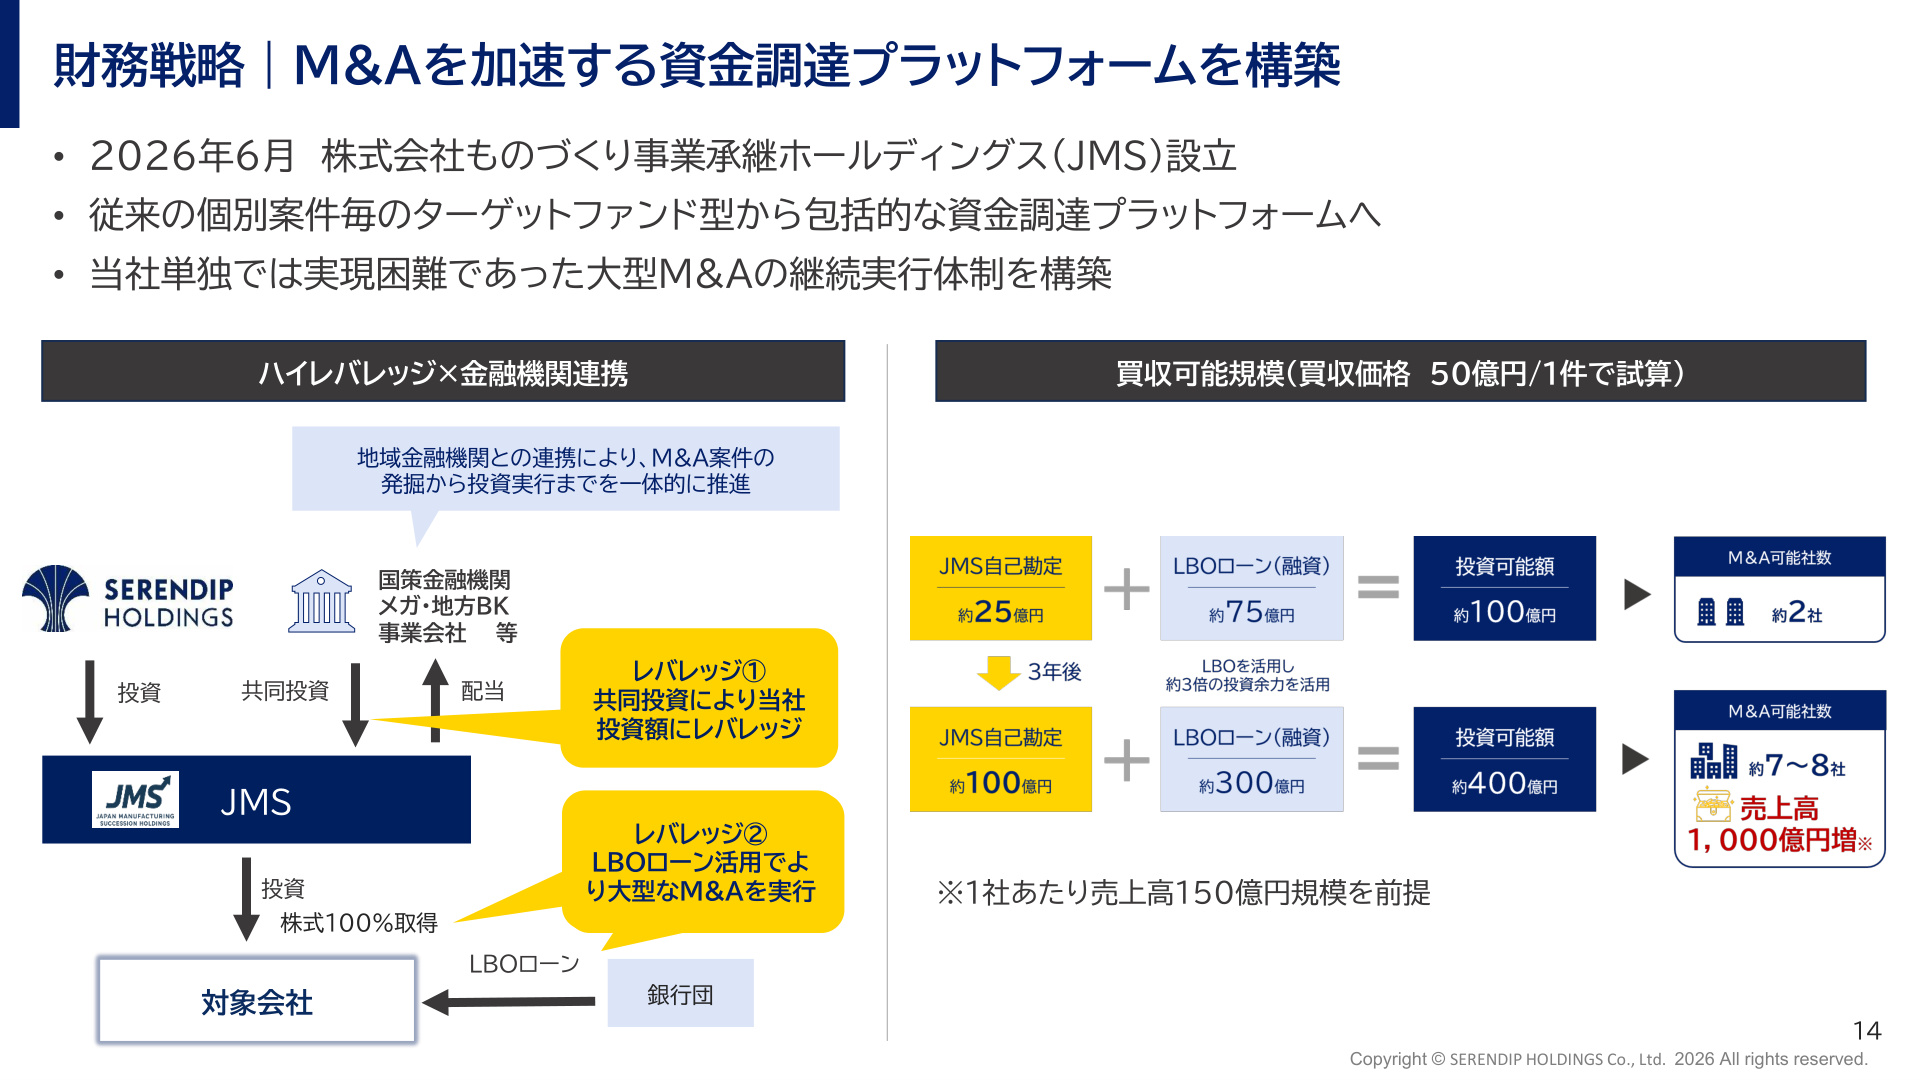
The primary pillar supporting the 100 billion JPY revenue target is the new platform established in June 2026: "Monozukuri Business Succession Holdings Co., Ltd. (JMS)."
Financing Scheme and Leverage Structure
Moving away from the traditional fund-style investment for individual projects, the company has evolved into a "comprehensive financing platform."
- Leverage ① (Capital Raising) : Accepting joint investments from national policy financial institutions, mega-banks, regional banks, and corporate partners to leverage equity capital.
- Leverage ② (LBO Loans) : Utilizing LBO loans from banking syndicates to enable the acquisition of large-scale projects (5-10 billion JPY scale) that were previously difficult to execute independently.
- Expansion of Investment Capacity : With approximately 10 billion JPY in JMS equity and 30 billion JPY in LBO loans, the company has built a "40 billion JPY investment capacity" structure . This plan aims to execute 7-8 M&As to secure the capacity for an additional 100 billion JPY in revenue.
5. Entry into New Domains: Nikken Sangyo M&A and Earnings Impact
As the first project under JMS, the company acquired "Nikken Sangyo Co., Ltd.," a construction machinery parts manufacturer, in July 2026.
Strategic Significance of the Nikken Sangyo Acquisition
- Diversification : Leveraging metal processing and structural component technologies honed in the automotive sector to fully enter the "construction machinery sector" with a robust supply chain (direct transactions with Kobelco Construction Machinery, Komatsu, Yanmar, etc.).
- Geographic Synergy : Gaining the group's first Kansai/Western Japan base (Osaka HQ, Wakayama plant, Kobe branch) to expand sales and supply networks in Western Japan.
Earnings Consolidation Schedule and Full-Year Forecast
- Nikken Sangyo's scale: 10 billion JPY in revenue, 700 million JPY in operating profit (pre-acquisition).
- P&L Contribution : Expected to be consolidated starting from Q3 FY2027, contributing half a year of performance (approx. 5 billion JPY revenue, 360 million JPY operating profit).
- Impact on Full-Year Forecast : The currently announced FY2027 full-year forecast (64 billion JPY revenue, 3.5 billion JPY operating profit) does not include Nikken Sangyo's performance; the company has disclosed plans for an upward revision in the second half .
6. Summary and Future Outlook
In Q1 FY2027, Serendip Holdings demonstrated the effectiveness of its group portfolio, as the steady expansion of the Manufacturing Business covered the temporary delays in the Solution Business under the new segment structure.
Key points to watch moving forward:
- Details of the upward revision to full-year forecasts following the consolidation of Nikken Sangyo
- The pace of recovery in the Solution Business from Q2 onwards following one-time setbacks
- Progress on the next large-scale M&A through the newly established JMS platform
- Progress in PMI (Post-Merger Integration) toward the "Serendip Challenge 1000" plan and measures to achieve a 20% ROE
Market attention will remain focused on how the company's business model—which balances solving the social issue of business succession with increasing the value-add of manufacturing firms—scales toward its mid-term goals.
This content is not intended as investment advice or a recommendation. Any opinions expressed are solely the personal views of each article.