


TeraProbe (6627) Q2 FY2026 Earnings Deep Dive: High-Growth Trajectory Driven by Advanced Data Center Demand and New Taiwan Facility

StockClub
Published: Aug 20, 2026, 09:57 AM
Sentiment Analysis
1. Q2 FY2026 Earnings Overview
TeraProbe, Inc. (6627) delivered strong growth in the second quarter (Q2) of the fiscal year ending December 2026 , with revenue reaching ¥14.59 billion (+15% QoQ) , operating profit at ¥4.00 billion (+25% QoQ) , ordinary profit at ¥3.92 billion (+20% QoQ) , and net profit attributable to owners of the parent at ¥1.56 billion (+34% QoQ) . This marks a significant increase in both revenue and profit for the second consecutive quarter. The operating margin improved by 2.2 percentage points from 25.2% in the previous quarter to 27.4% .
Furthermore, the results exceeded the company's initial Q2 guidance (revenue of ¥13.58 billion, operating profit of ¥3.39 billion) by 7% (+¥1.01 billion) in revenue and 18% (+¥0.61 billion) in operating profit. The primary drivers for this outperformance were higher-than-expected production volumes of processors for data centers , particularly those related to AI, the commencement of mass production for new customers , and a weaker-than-expected yen (actual rate of ¥158.82/USD vs. assumed rate of ¥157.80/USD).
H1 FY2026 Performance Progress
The cumulative results for the first half (H1) highlight a clear and robust year-on-year growth trajectory:
- Revenue : ¥27.31 billion (+44% YoY)
- Gross Profit : ¥8.88 billion (+75% YoY, 32.5% gross margin)
- Operating Profit : ¥7.21 billion (+94% YoY, 26.4% operating margin)
- Ordinary Profit : ¥7.18 billion (+108% YoY)
- Net Profit Attributable to Owners of the Parent : ¥2.72 billion (+110% YoY)
Driven by strong demand in advanced sectors, the company’s revenue scale has expanded significantly, with profits nearly doubling compared to the same period last year.
2. Profitability Improvement and Trends by Product/Application
A review of the company's quarterly performance reveals structural improvements in profit margins alongside top-line growth.
Slide Commentary: Structural Shift to Operating Margins Exceeding 27%
The slide above (page 8) illustrates the quarterly trends in consolidated revenue, operating profit, and operating margin from Q1 2022 to Q2 2026. Key takeaways include:
- Continuous Revenue Expansion : From a low of ¥9.0 billion in Q4 2024, revenue has set new quarterly records consecutively: ¥9.2 billion (Q1 '25) → ¥9.8 billion (Q2) → ¥10.8 billion (Q3) → ¥11.9 billion (Q4) → ¥12.7 billion (Q1 '26) → ¥14.6 billion (Q2) .
- Rapid Operating Margin Improvement : Previously hovering between 16% and 21%, the operating margin reached 24.6% in Q4 2025, 25.2% in Q1 2026, and a record 27.4% in Q2 2026 , driven by an increased sales mix in advanced sectors.
Structure of Operating Profit Variance (H1 YoY)
Breaking down the H1 operating profit increase (+¥3.49 billion YoY), the company absorbed cost increases—including higher depreciation expenses (+¥2.62 billion) from advanced capital investment, increased personnel costs (+¥0.99 billion) , and higher utility costs (+¥0.54 billion) due to summer peak power rates in Taiwan—through a substantial increase in revenue (+¥8.29 billion) , resulting in a 94% growth in operating profit.
Demand Environment by Application and Product
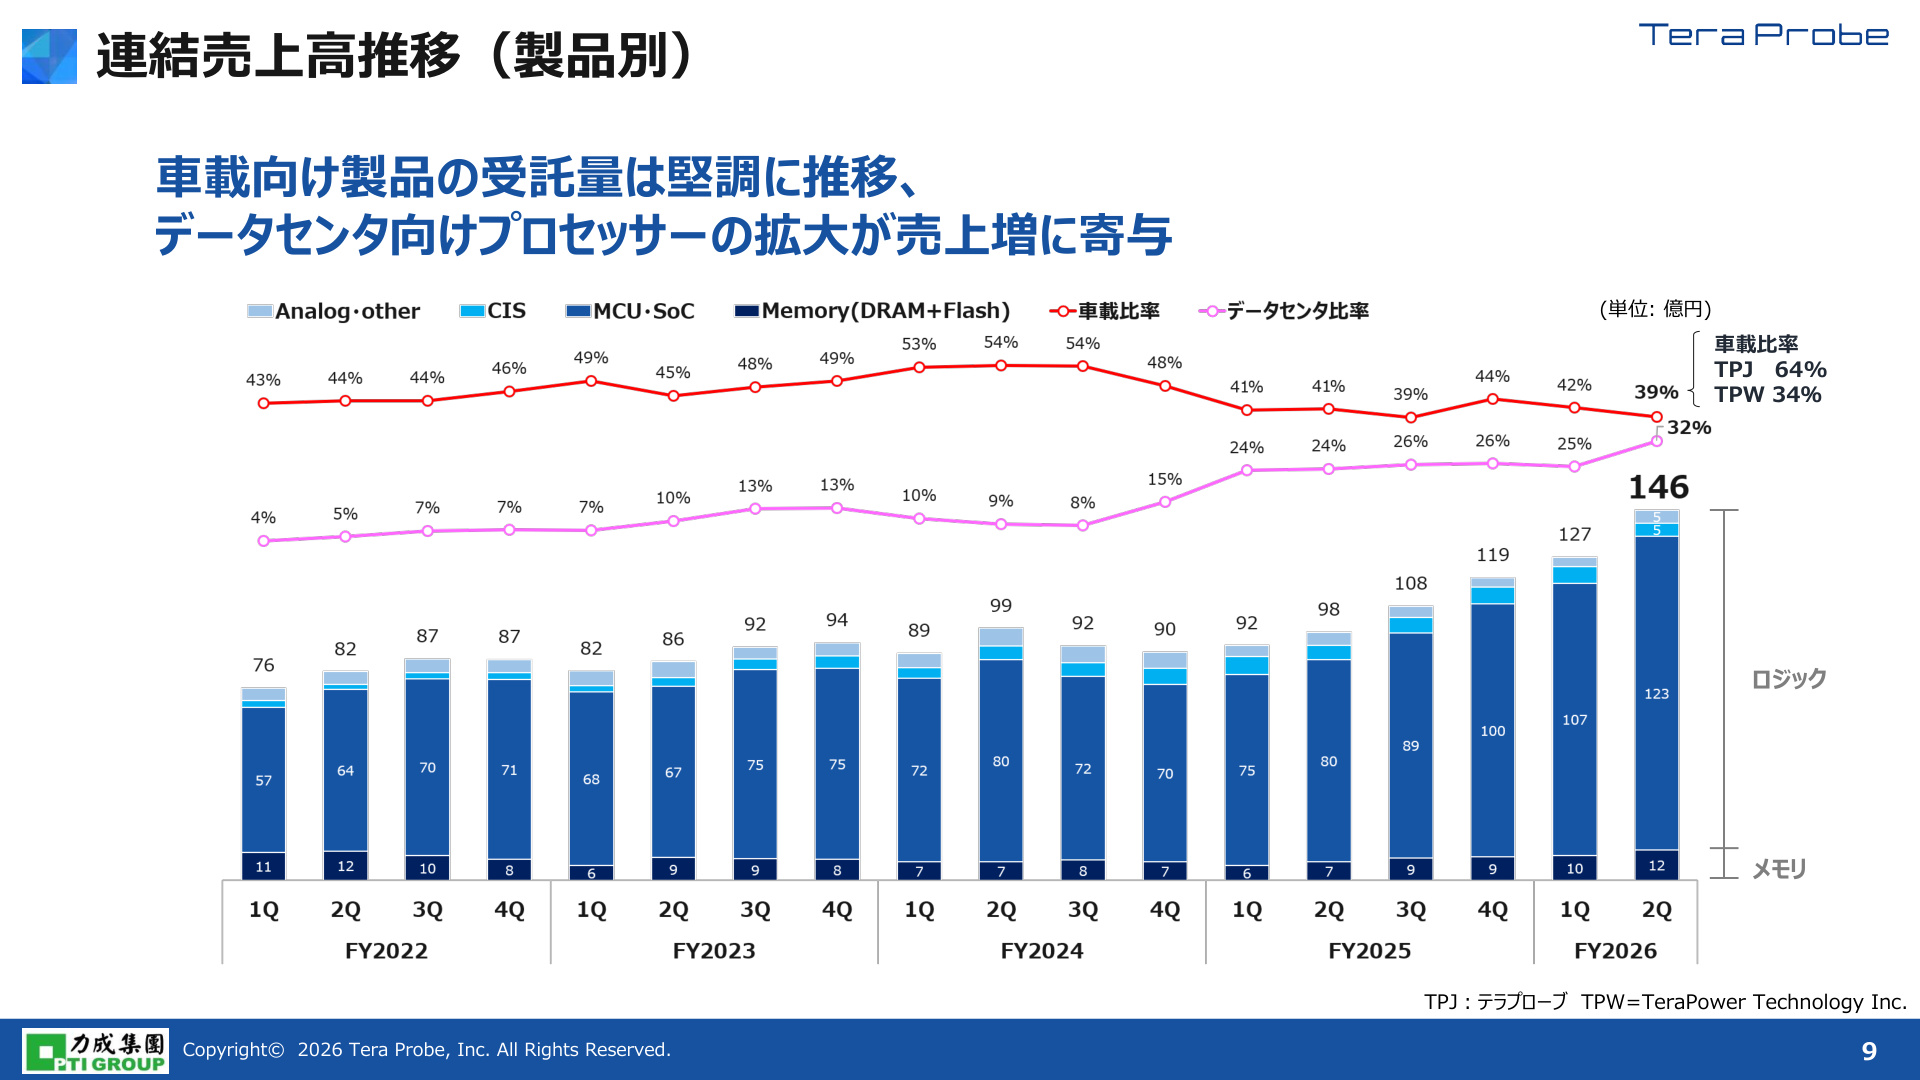
- Data Center : Driven by the acceleration of generative AI and cloud demand, wafer testing for processors has surged. Its share of total revenue jumped from 24% (¥2.2 billion) in Q1 2025 to 32% (¥4.7 billion) in Q2 2026 , becoming the company's primary growth driver.
- Automotive : While fluctuations exist by customer, the segment remains stable, supported by EV-related products. Revenue reached ¥5.7 billion, accounting for 39% of total sales and forming a solid foundation for earnings.
- Logic/Memory Composition : Logic products (SoC/MCU/CIS, etc.) account for 84% (¥12.3 billion) of total revenue, reflecting a shift toward advanced logic products with higher testing unit prices and margins.
3. Second-Half Outlook and Full-Year Forecast
The company anticipates continued strong demand for data center processors through the second half (Q3 and Q4) and has presented a plan to significantly exceed its previous record-high full-year performance.
Slide Commentary: Continued Growth in Q3/Q4 and Full-Year Plan
The slide above (page 14) shows quarterly results, H2 forecasts, and the full-year consolidated outlook.
- Continued Quarterly Growth : Q3 is projected to reach ¥15.49 billion in revenue (+6% QoQ) and ¥4.29 billion in operating profit (+7% QoQ). Q4 is expected to reach ¥16.30 billion in revenue (+5% QoQ) and ¥4.80 billion in operating profit (+12% QoQ), with an anticipated Q4 operating margin of 29.4% .
- Full-Year Forecast Scale :
- Revenue : ¥59.10 billion (+42% YoY / +¥17.35 billion)
- Operating Profit : ¥16.30 billion (+83% YoY / +¥7.41 billion)
- Ordinary Profit : ¥16.10 billion (+84% YoY / +¥7.35 billion)
- Net Profit Attributable to Owners of the Parent : ¥6.00 billion (+78% YoY / +¥2.63 billion)
- Assumed Exchange Rates : From August onwards, the assumed rates are ¥160.00 per USD and ¥4.90 per TWD.
4. Growth Strategy: Capital Investment and Business Foundation
To meet the growing demand for advanced semiconductor testing, the company is aggressively investing in equipment and expanding its production footprint.
Slide Commentary: Major Expansion of Production Base at Taiwan Subsidiary (TPW)
The slide above (page 18) outlines the expansion of the Taiwan subsidiary, TeraPower Technology Inc. (TPW).
- New Facility Acquisition : Acquired land (8,328㎡) and buildings (total floor area 20,221㎡ ) from DARWIN PRECISIONS CORPORATION (completed in January 2026, investment of approx. ¥8.6 billion).
- Leasing Production Floor Space : Leased the 2nd-floor production area ( 2,638㎡ ) of Factory 3-B from the parent company, Powertech Technology Inc. (PTI).
- Strategic Location : Located at the intersection of the Taiwan semiconductor supply chain—approximately 15 minutes from the Hsinchu Science Park and one hour from the Central Taiwan Science Park—enabling rapid response to customer needs.
Capital Investment and Depreciation Trends
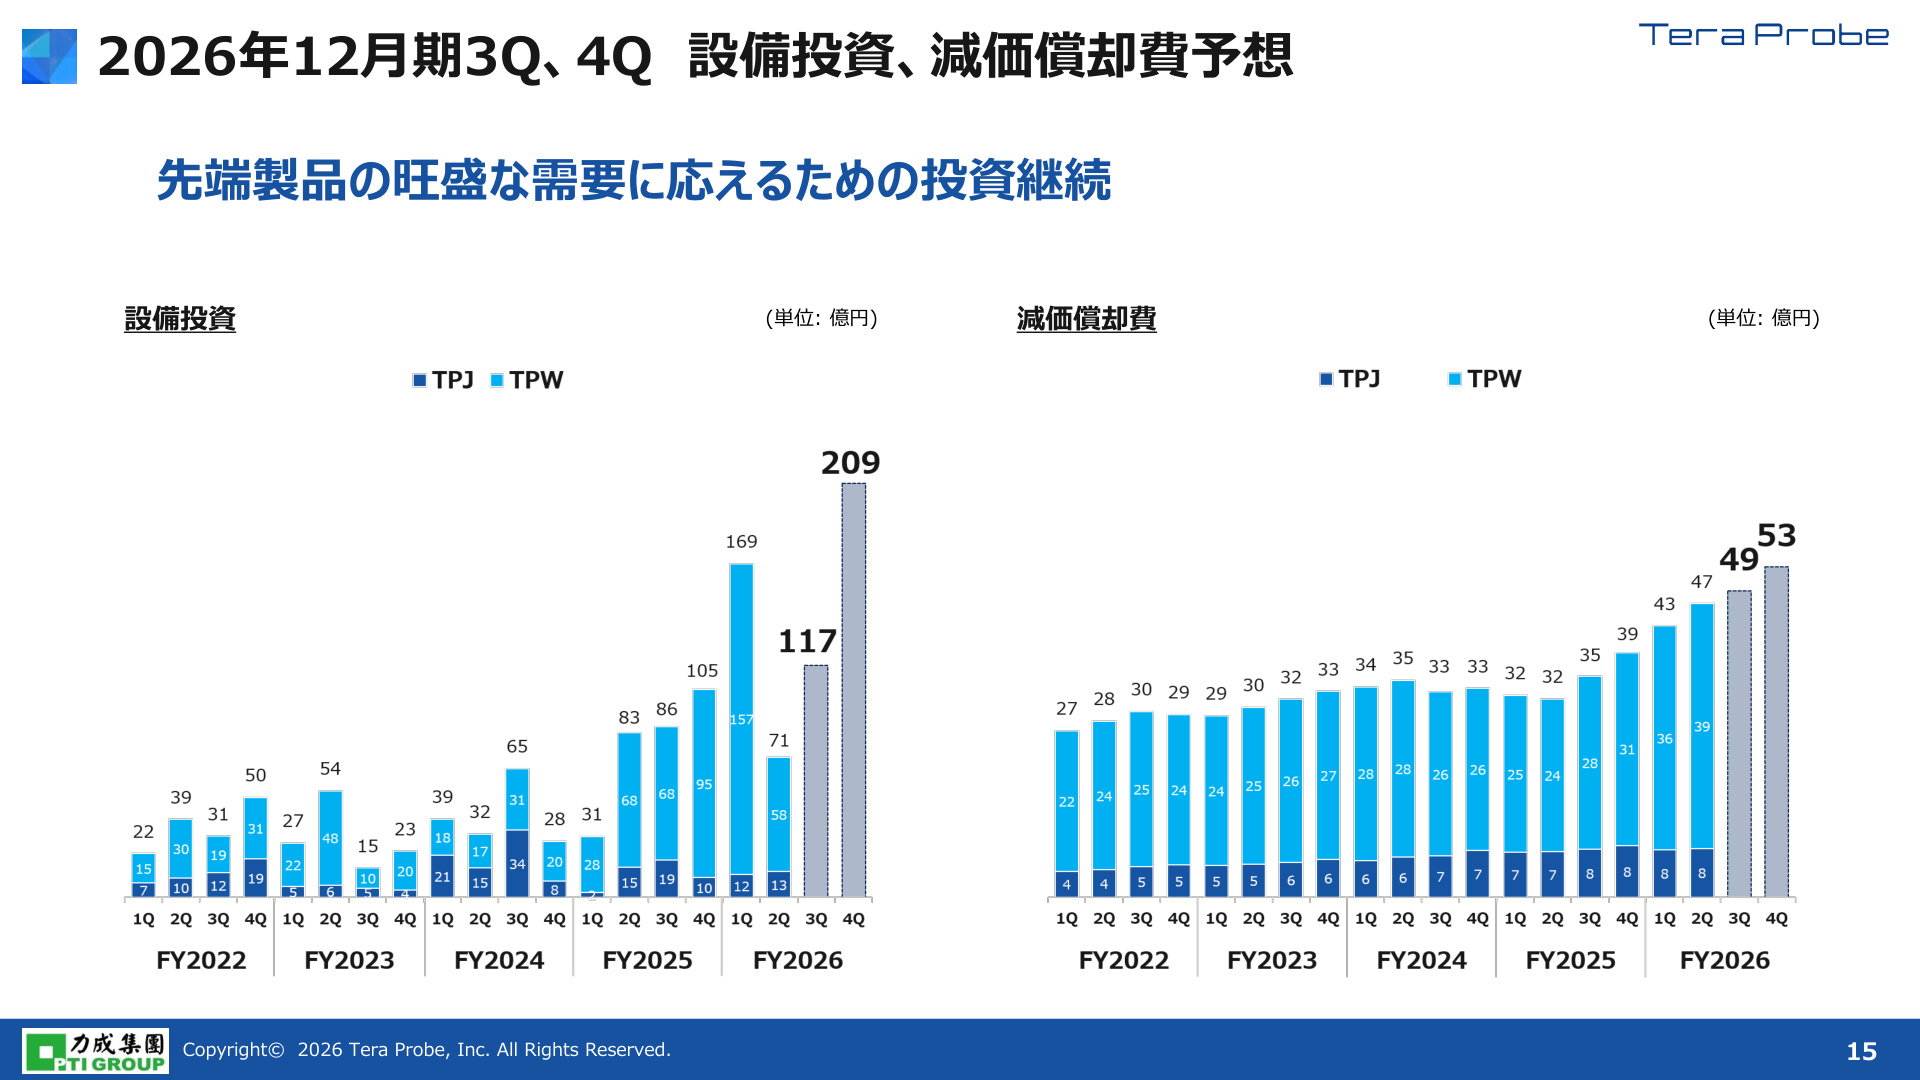
- Capital Investment : Totaled ¥16.9 billion in Q1 2026 (including the TPW facility acquisition) and ¥7.1 billion in Q2. H2 forecasts are ¥11.7 billion for Q3 and ¥20.9 billion for Q4, maintaining a high level of investment to secure capacity in anticipation of long equipment lead times.
- Depreciation : Expected to increase quarterly due to the introduction of advanced testers (Q1 '26: ¥4.3 billion → Q2: ¥4.7 billion → Q3 forecast: ¥4.9 billion → Q4 forecast: ¥5.3 billion), but strong revenue growth ensures sufficient margins.
5. Other Key Topics
① Stock Split (5-for-1)
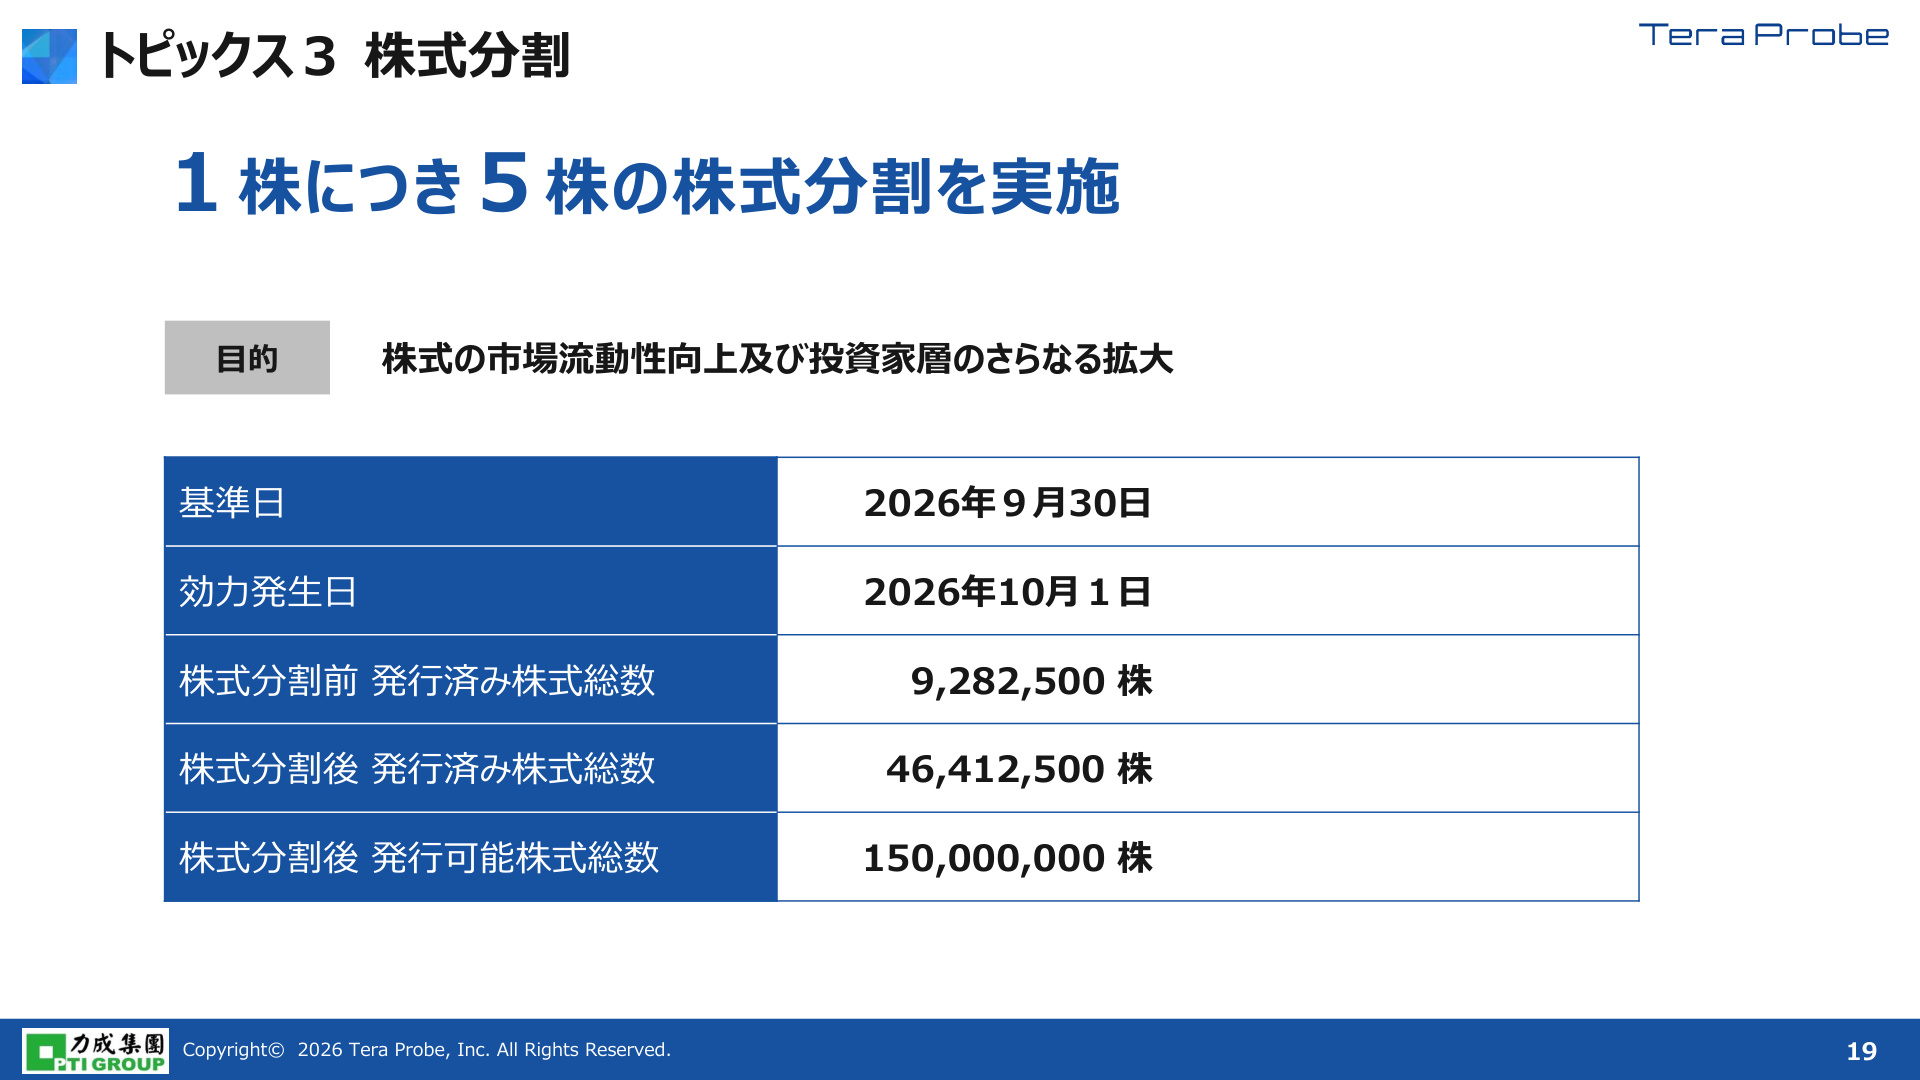
To improve market liquidity and expand the investor base, a 5-for-1 stock split has been decided, with a record date of September 30, 2026 (effective date: October 1, 2026) . This will increase the total number of outstanding shares from 9,282,500 to 46,412,500 .
② Impact of the Kumamoto Earthquake and Status of Kyushu Office
Following the earthquake in the Kyushu Office (Ashikita, Kumamoto), there were no human casualties, and no damage occurred to the buildings or infrastructure. Repairs for some production equipment and tools are underway, and operations resumed in stages starting July 31 . The facility is designed to new seismic standards, built on solid ground, and located on high ground 45m above sea level, ensuring operational stability.
③ Financial Position
Due to investments in advanced testers, tangible fixed assets as of the end of June 2026 increased to ¥86.1 billion (+¥17.0 billion from year-end), and interest-bearing debt rose to ¥40.3 billion (+¥10.4 billion). However, net assets also grew to ¥64.3 billion (+¥4.4 billion), demonstrating that the company is pursuing growth investments while maintaining a solid equity base.
This content is not intended as investment advice or a recommendation. Any opinions expressed are solely the personal views of each article.