


Toyo Tanso FY2026 H1 Earnings Deep Dive: Semiconductor Inventory Adjustments, H2 Recovery Scenarios, and Growth Investment Status

StockClub
Published: Aug 20, 2026, 09:56 AM
Sentiment Analysis
1. FY2026 H1 Earnings Highlights
Toyo Tanso’s consolidated financial results for the first half of the fiscal year ending December 2026 were as follows: net sales of 22.37 billion yen (down 2.7% YoY) , operating profit of 1.778 billion yen (down 53.7% YoY) , ordinary profit of 2.229 billion yen (down 41.2% YoY) , and net income attributable to owners of the parent of 1.677 billion yen (down 37.4% YoY) .
While net sales remained largely in line with the previous year, profitability suffered a significant decline due to inventory adjustments in the semiconductor market, an unfavorable product mix, and inventory-related costs. Compared to the company's initial forecasts, net sales fell short by 0.6%, and operating profit missed by 31.6%.
| Item | FY2025/H1 Actual | FY2026/H1 Plan | FY2026/H1 Actual | YoY Change | vs. Plan |
|---|---|---|---|---|---|
| Net Sales | 22,980 million yen | 22,500 million yen | 22,370 million yen | -2.7% | -0.6% |
| Operating Profit | 3,840 million yen | 2,600 million yen | 1,778 million yen | -53.7% | -31.6% |
| Operating Margin | 16.7% | 11.6% | 7.9% | -8.8pt | -3.7pt |
| Ordinary Profit | 3,789 million yen | 2,500 million yen | 2,229 million yen | -41.2% | -10.8% |
| Net Income | 2,681 million yen | 2,300 million yen | 1,677 million yen | -37.4% | -27.1% |
2. Analysis of Operating Profit Variance
The decline in operating profit by 2.06 billion yen, from 3.84 billion yen in the same period last year to 1.77 billion yen, is attributable to several complex factors.
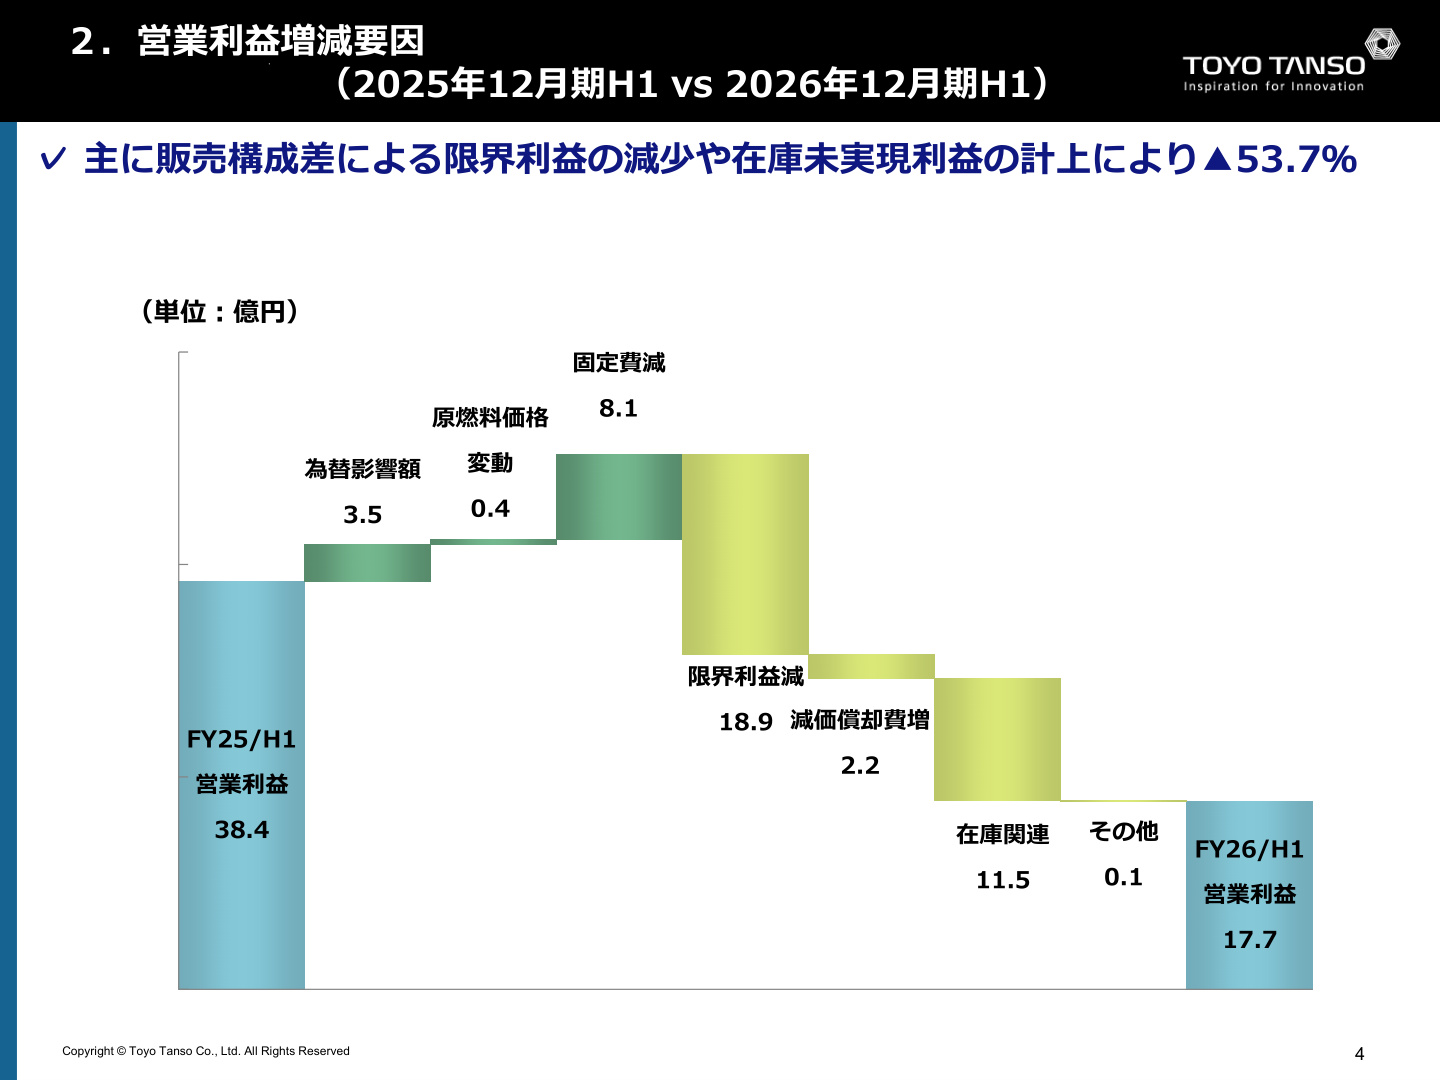
The chart above is a waterfall chart breaking down the factors behind the change in operating profit from the previous year (FY25/H1) to the current period (FY26/H1). The key factors identified are as follows:
- Decrease in Marginal Profit (-1.89 billion yen) : The primary negative driver was the unfavorable product mix and lower sales volume, stemming from a decline in high-margin semiconductor-related components.
- Inventory-related Impact (-1.15 billion yen) : Factors such as the recording of unrealized gains within the consolidated group exerted downward pressure on profits.
- Increase in Depreciation (-0.22 billion yen) : Depreciation expenses rose due to the expansion of production capacity for future growth.
- Fixed Cost Reduction (+0.81 billion yen) : Rigorous cost management and expense reduction efforts provided a buffer for earnings.
- Foreign Exchange Impact (+0.35 billion yen) : The yen’s depreciation against the assumed rates (158.2 JPY/USD and 184.5 JPY/EUR vs. assumed 145 JPY/USD and 176 JPY/EUR) contributed positively.
3. Performance by Product and Sector
Specialty Graphite Products (Net Sales: 10.632 billion yen, +4.2% YoY)
- Electronics Sector (3.287 billion yen, -15.9% YoY) : Revenue declined due to a significant drop in semiconductor device manufacturing components and a slight decrease in components for compound semiconductor manufacturing for SiC semiconductors and single-crystal silicon manufacturing, amid ongoing wafer inventory adjustments.
- General Industrial Sector (5.612 billion yen, +9.9% YoY) : Driven by steady demand for continuous casting dies and metallurgical components for industrial furnaces , supported by resilient automotive industry operations and corporate capital expenditure.
- Other (1.733 billion yen, +45.9% YoY) : Significant growth driven by increased demand for electrical discharge machining (EDM) electrodes.
General Carbon Products (Net Sales: 4.38 billion yen, +7.7% YoY)
- Carbon for Mechanical Applications (2.131 billion yen, +7.3% YoY) : Demand for bearings and seal rings for industrial machinery remained steady.
- Carbon for Electrical Applications (2.249 billion yen, +8.2% YoY) : Increased demand for small motors used in home appliances and power tools, alongside stable demand for large motors.
Composite and Other Products (Net Sales: 6.83 billion yen, -13.7% YoY)
- Three Major Products (5.691 billion yen, -13.7% YoY) :
- SiC-Coated Graphite Products : While demand for Si epitaxial applications , particularly for cutting-edge generative AI, remained firm, revenue declined due to a sharp drop in SiC epitaxial applications and the reaction to front-loaded demand in the previous period.
- C/C Composite Products : Revenue increased due to steady demand for industrial furnace and semiconductor applications.
- Graphite Sheet Products : Despite weakness in semiconductor applications, demand for automotive and metallurgical applications increased.
4. Financial Position and Cash Flow
Despite the challenging earnings environment, the company maintains a robust financial structure and healthy cash-generating capability.
- Asset and Capital Soundness : Total assets increased by 1.678 billion yen from the end of the previous fiscal year to 119.594 billion yen . Net assets stand at 97.623 billion yen , with an equity ratio of 81.6% , reflecting an extremely solid financial foundation.
- Cash Flow from Operating Activities : Generated 7.974 billion yen in cash (compared to 2.809 billion yen in the same period last year), significantly expanded through effective inventory control.
- Cash Flow from Investing Activities : Recorded 4.873 billion yen in expenditures for the acquisition of property, plant, and equipment. The company continues to practice disciplined capital allocation, funding growth investments within the scope of operating cash flow.
5. Full-Year Forecast and H2 Recovery Scenario
Toyo Tanso has maintained its initial full-year consolidated earnings forecast for the fiscal year ending December 2026.
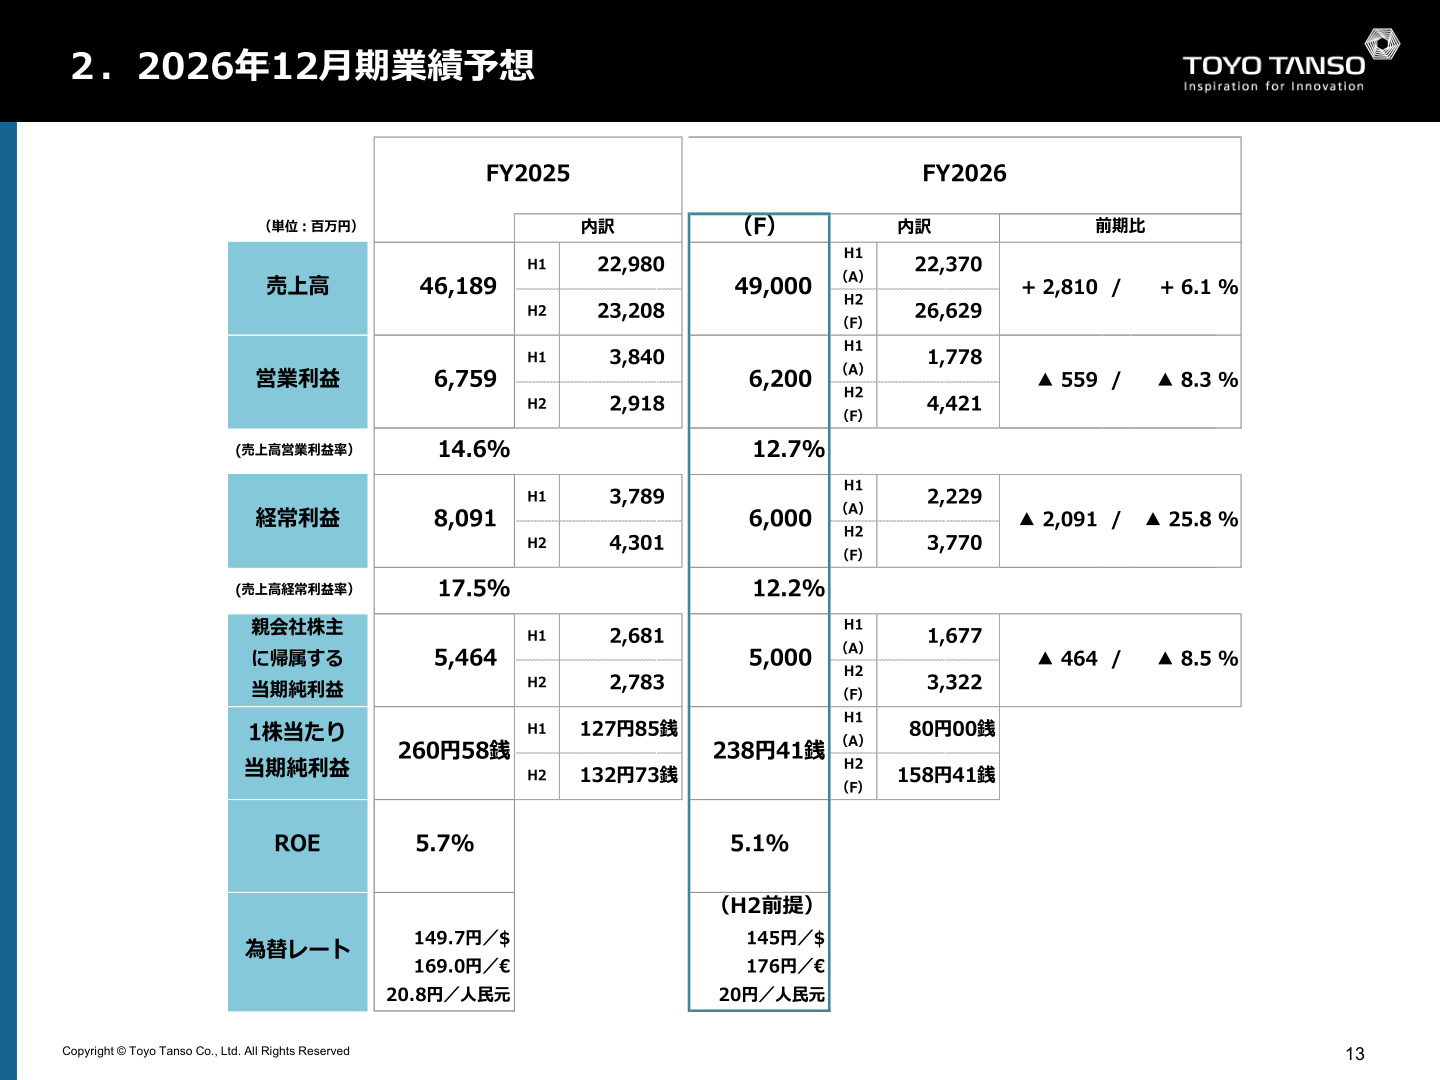
As shown in the chart above, while the H1 progress against the full-year plan is 45.7% for net sales and 28.7% for operating profit, the company anticipates a significant earnings recovery in the second half (H2) .
| Item | FY2025 Actual | FY2026 Full-Year Plan | YoY Change | H1 Actual | H2 Plan | H2 YoY Change |
|---|---|---|---|---|---|---|
| Net Sales | 46,189 million yen | 49,000 million yen | +6.1% | 22,370 million yen | 26,629 million yen | +14.7% |
| Operating Profit | 6,759 million yen | 6,200 million yen | -8.3% | 1,778 million yen | 4,421 million yen | +51.5% |
| Operating Margin | 14.6% | 12.7% | -1.9pt | 7.9% | 16.6% | +4.0pt |
| Net Income | 5,464 million yen | 5,000 million yen | -8.5% | 1,677 million yen | 3,322 million yen | +19.4% |
Prerequisites and Drivers for H2 Recovery
- Recovery in Silicon Semiconductor Applications : With the completion of wafer inventory adjustments, a full-scale recovery in orders for single-crystal silicon manufacturing and Si epitaxial applications is expected.
- Significant Improvement in Marginal Profit : Operating profit for H2 is projected to increase by 2.64 billion yen compared to H1, primarily driven by a marginal profit increase (+4.8 billion yen) resulting from higher volumes and an improved mix of high-value-added products.
- Price Revisions : To absorb rising manufacturing costs, including higher crude oil prices due to Middle East tensions, price revisions are scheduled for orders placed from October 2026 .
6. Mid-to-Long-Term Capital Investment Strategy and Shareholder Returns
Progress in Growth Investments
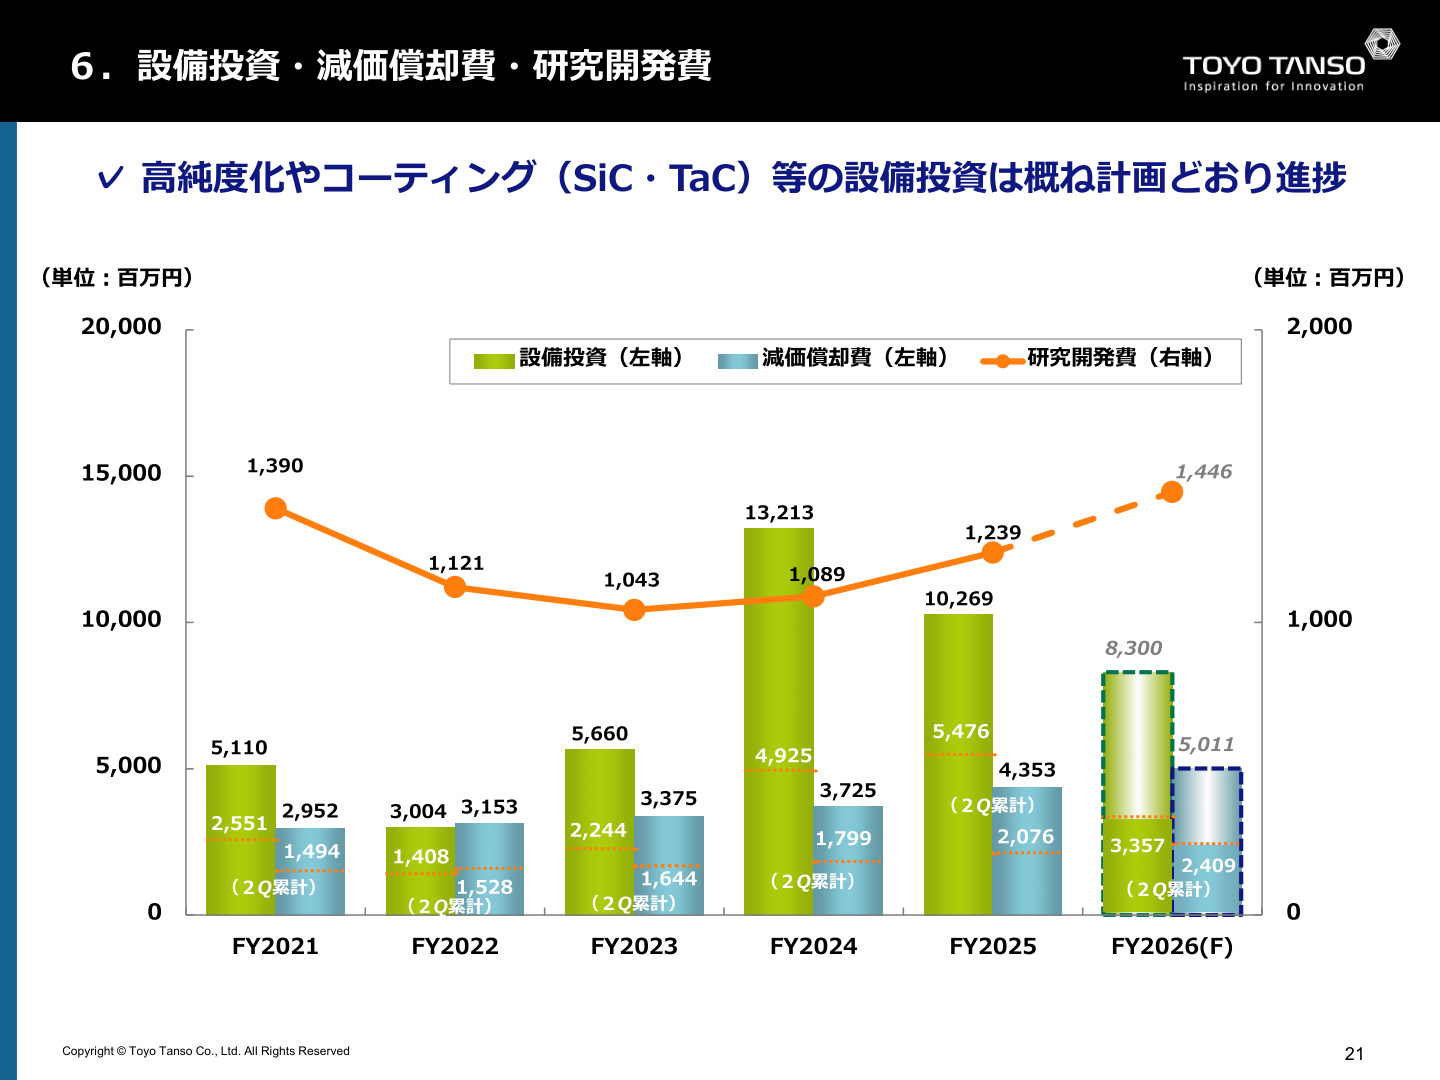
Anticipating long-term growth in semiconductor and power semiconductor demand, the company continues to make proactive upfront investments.
- Capital Expenditure Plan : The full-year plan is 8.3 billion yen (H1 actual: 3.357 billion yen), with investments proceeding as planned, primarily in high-purification equipment and SiC/TaC (Tantalum Carbide) coating capacity expansion .
- R&D Expenses : The company plans to invest 1.446 billion yen , focusing on material development for advanced and next-generation power semiconductors.
Shareholder Return Policy
- Dividend Policy : Prioritizing stable dividends despite earnings fluctuations, the company plans to maintain an annual dividend of 145 yen per share (same as the previous year) for the fiscal year ending December 2026.
- Payout Ratio : Based on the current net income forecast, the consolidated dividend payout ratio is expected to reach 60.8% , significantly exceeding the 40% target benchmark.
7. Summary
Toyo Tanso experienced a temporary, significant decline in H1 FY2026 earnings due to an unfavorable product mix caused by inventory adjustments in the semiconductor market. However, the company maintains a robust financial position with an 81.6% equity ratio and is steadily advancing capacity expansion investments in growth areas such as SiC/TaC coatings. The completion of silicon wafer adjustments, the recovery in demand for advanced products, and the implementation of price revisions starting in October will be the key indicators for achieving the full-year targets.
This content is not intended as investment advice or a recommendation. Any opinions expressed are solely the personal views of each article.