


F-Code Inc. FY2026 Q2 Earnings Deep Dive: A Comprehensive Analysis of Roll-up M&A and Advanced Financial Modeling Driving High Growth

StockClub
Published: Aug 14, 2026, 12:47 PM
Sentiment Analysis
F-Code Inc. (Ticker: 9211) reported strong results for the second quarter of the fiscal year ending December 2026 , with both revenue and profit significantly exceeding the same period last year, maintaining a record-high performance trend. The company, which provides digital marketing and DX support services leveraging AI and technology, continues to achieve exponential expansion through its unique "roll-up M&A strategy" and rigorous Post-Merger Integration (PMI) processes.
This report breaks down the 10 most critical topics from the earnings presentation, providing an in-depth analysis of the company's performance, business structure, M&A strategy, and financial model.
1. FY2026 Q2 Earnings Highlights: Achieving Significant Revenue and Profit Growth
Consolidated results for Q2 FY2026 were as follows: Revenue of 8.20 billion JPY (up 57.3% YoY) , Operating Profit of 1.646 billion JPY (up 41.6% YoY) , Profit Before Tax of 1.462 billion JPY (up 35.7% YoY) , and Net Profit Attributable to Owners of the Parent of 860 million JPY (up 35.3% YoY) .
Driven by robust organic growth in existing businesses and the strategic contribution of M&A, the company has achieved sustained high growth in both top and bottom lines . A key characteristic is its ability to maintain high profitability while accelerating upfront investments in talent acquisition and AI product development.
2. Full-Year Forecast and Progress: Steady Execution According to Plan
Against the full-year forecast of 14.50 billion JPY in revenue (up 21.5% YoY) and 3.30 billion JPY in operating profit (up 45.1% YoY) , the progress rate at the end of Q2 stands at 56.6% for revenue and 49.9% for operating profit .
The company is currently in a phase of upfront investment for AI/technology product development and sales expansion, with these investments expected to begin yielding returns in the second half. Both revenue and profit are progressing in line with management's expectations, showing steady momentum toward achieving the full-year targets.
3. A Dramatic Five-Year Growth Trajectory Since IPO
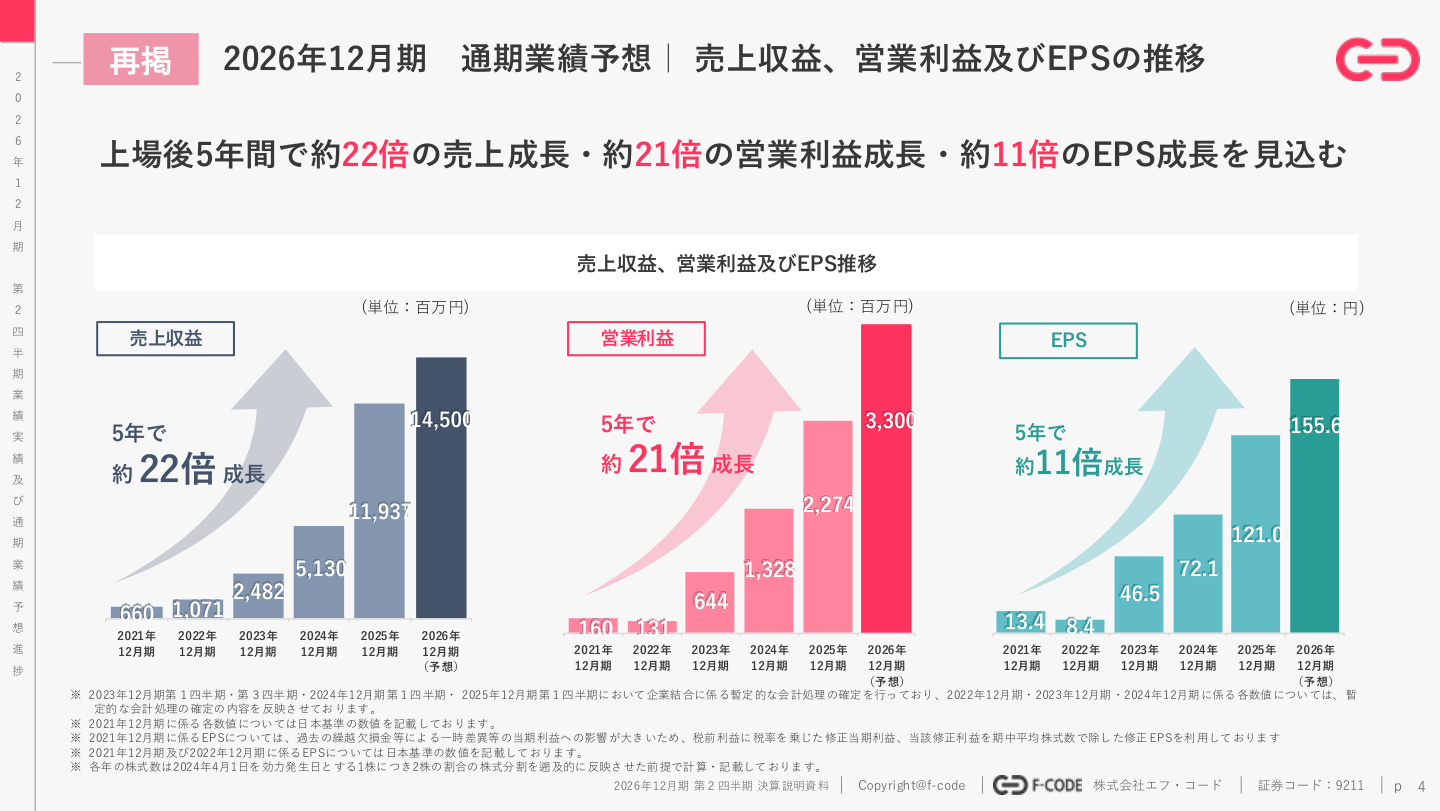
The company's growth speed is remarkable when viewed over the medium to long term. Over the five years since its IPO in the fiscal year ending December 2021, revenue is projected to grow approximately 22-fold , operating profit approximately 21-fold , and Earnings Per Share (EPS) approximately 11-fold .
[Slide Commentary: Why this data is important]
The slide above is the most critical evidence of the company's medium-to-long-term growth story and its reproducibility . It visually demonstrates that this is not a one-off growth spurt, but a consistent upward trend maintained since the IPO. Notably, operating margins have improved alongside the expansion of revenue scale, revealing a structure where economies of scale and M&A synergies powerfully drive profit growth. Furthermore, the fact that EPS has increased approximately 11-fold in five years while minimizing share dilution serves as objective proof of management's commitment to enhancing shareholder value.
4. Performance Trends by Business Segment: Roles and Progress of the Two Domains
The company's business is broadly divided into the "Marketing & School Domain" and the "AI & Technology Domain."
- Marketing & School Domain : Comprised of core marketing support, SaaS, SNS operation support, and IT/DX talent training schools. Q2 revenue reached 4.912 billion JPY (62.8% progress against full-year forecast) , with business profit of 1.433 billion JPY (59.8% progress) , serving as a powerful driver of overall performance.
- AI & Technology Domain : Includes generative AI engineering, system/app development, and AI reskilling. Revenue was 3.287 billion JPY (49.2% progress) , and business profit was 576 million JPY (35.0% progress) . While profit progress is slightly conservative due to active upfront investment in AI product development, the foundation for future growth is being built steadily.
5. Continuous M&A Execution and Expansion of Sourcing Capabilities
In the first half of FY2026, the company executed a total of four M&A deals with a total investment exceeding 1.6 billion JPY . This has resulted in an incremental operating profit of over 600 million JPY on an annualized basis.
The M&A sourcing structure has been significantly strengthened. Through a network of over 150 M&A advisors and referrals from representatives of existing group companies, the number of deals under consideration reached 294 in the first half of 2026 , establishing a high-quality, high-volume pipeline.
6. Roll-up M&A and the Creation of Intra-Group Synergies
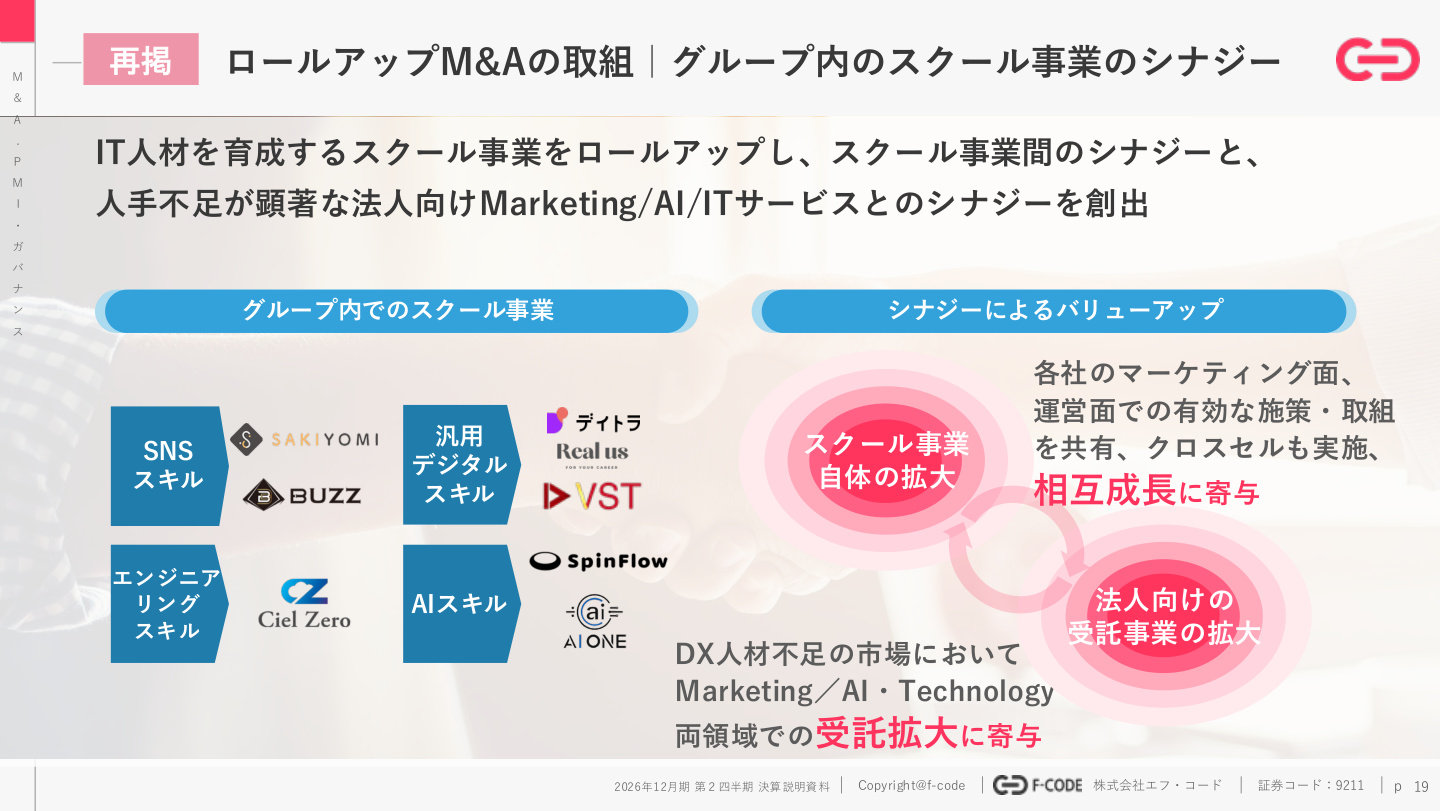
The core of the company's M&A strategy lies in "Roll-up M&A," which goes beyond simple acquisition to cross-pollinate the strengths of the acquired companies.
[Slide Commentary: Why this data is important]
This slide illustrates the robust circular ecosystem of the business model. By bringing various "school businesses"—offering SNS, general digital skills, engineering, and AI training—under the group umbrella, the company achieves not only the sharing of marketing know-how and cross-selling to expand the school business itself, but also creates a mechanism where trained DX talent is supplied to the group's corporate "Marketing / AI / IT contracting business." In a DX market plagued by labor shortages, this highly rational mutual synergy structure —securing a talent supply line within the group to support the rapid growth of the contracting business—is clearly demonstrated.
7. Evolution from Horizontal Expansion to "Vertical Roll-up"
In addition to its traditional "horizontal expansion" of providing cross-sectional solutions in marketing and IT, the company has entered the realm of "vertical roll-up" by diving deep into specific industries.
The first step was the acquisition of Roombox (RBX) , which specializes in the real estate industry. By providing the group's products and know-how to address the unique DX challenges of the real estate sector, the company creates high added value. Plans are in place to pursue vertical roll-ups in other massive industries beyond real estate.
8. Organizational Structure and Disciplined Governance/PMI Processes
To increase the success rate of M&A, the company provides rigorous governance and management support based on a "100-day PMI plan." Post-acquisition, the company provides corporate functions including compliance, internal controls, accounting, finance, legal, and HR at the level of a listed company to ensure early risk detection and mitigation.
To support this, the headquarters is staffed with high-level talent with extensive experience at major firms such as Keyence, Deloitte, Hakuhodo, Dentsu, Recruit, and Accenture , ensuring a perfect hands-on support system for acquired companies.
9. Goodwill Composition and High Financial Safety
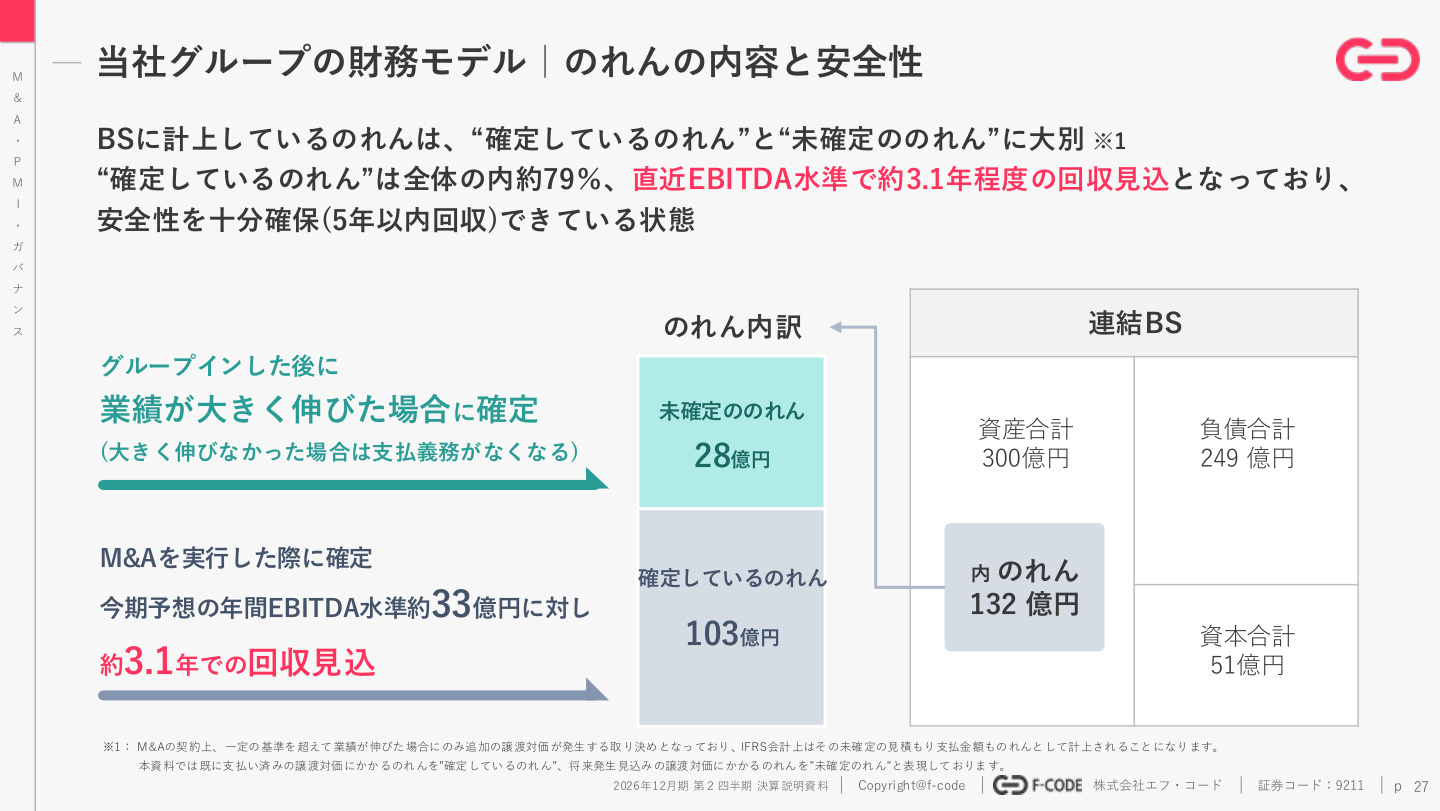
Regarding the risk management of "goodwill" recorded on the balance sheet due to aggressive M&A, the company has adopted an extremely transparent and safe financial model.
[Slide Commentary: Why this data is important]
When evaluating M&A-driven companies, the primary concern for the market and investors is "future impairment risk." This slide provides a very clear answer to that concern. Of the 13.2 billion JPY in total goodwill on the consolidated balance sheet, approximately 79% (10.3 billion JPY) is already fixed , which is recoverable in approximately 3.1 years based on the current year's projected annual EBITDA (approx. 3.3 billion JPY). Furthermore, the remaining "unfixed goodwill" (2.8 billion JPY) is subject to conditions (such as earn-outs) where additional payments only occur if performance significantly exceeds targets; if performance does not grow, no payment obligation arises. This data confirms the financial discipline that prevents overpaying and structurally minimizes impairment risk .
10. Business Return Exceeding Cost of Capital (ROIC vs. WACC)
While the company primarily uses bank loans (debt) to fund M&A, it also demonstrates excellent performance in capital efficiency.
Currently, the company's Weighted Average Cost of Capital (WACC) is 4.8% , while its Return on Invested Capital (ROIC) stands at approximately 11% . As a result, the EVA spread (ROIC - WACC) , a key indicator of corporate value creation, is a significant positive at 6.2% .
Even if the cost of debt were to double to 2.80% due to future interest rate hikes, calculations show that WACC would remain at 5.8%, maintaining an EVA spread of 5.2%. By leveraging low-cost debt to generate high investment returns, the company has established a solid financial foundation that realizes continuous expansion of shareholder value .
Conclusion: Sustainability of the High-Growth Story
F-Code's FY2026 Q2 earnings demonstrate not only growth in performance figures but also the smooth operation of highly reproducible mechanisms in both business and finance, such as "improved M&A sourcing capabilities," "school-to-contracting synergies," "strict goodwill recovery management," and "high EVA spreads."
The report suggests that the company is well-positioned to further enhance its presence in the DX and AI markets by continuing to leverage the dual engines of existing business expansion and advanced roll-up M&A.
This content is not intended as investment advice or a recommendation. Any opinions expressed are solely the personal views of each article.