

Bleach Inc. Fiscal Year Ended June 2026: Comprehensive Earnings Analysis Report

Sentiment Analysis

This report provides a comprehensive analysis of the fiscal year ended June 2026 consolidated financial results for Bleach Inc. (Securities Code: 9162), covering performance outcomes, key KPI trends, organizational investment status, and future growth strategies and business environment.
1. Full-Year Performance Highlights: Revenue Growth Offset by Upfront Investments Leading to Operating Loss
For the fiscal year ended June 2026, Bleach Inc. maintained consolidated net sales at 17,179 million yen (+0.1% YoY), essentially flat. However, advertising profit stood at 2,977 million yen (down 13.8% YoY), and the company reported a consolidated operating loss of 330 million yen (compared to a profit of 436 million yen in the previous fiscal year), marking a significant decline in earnings and a shift into the red.
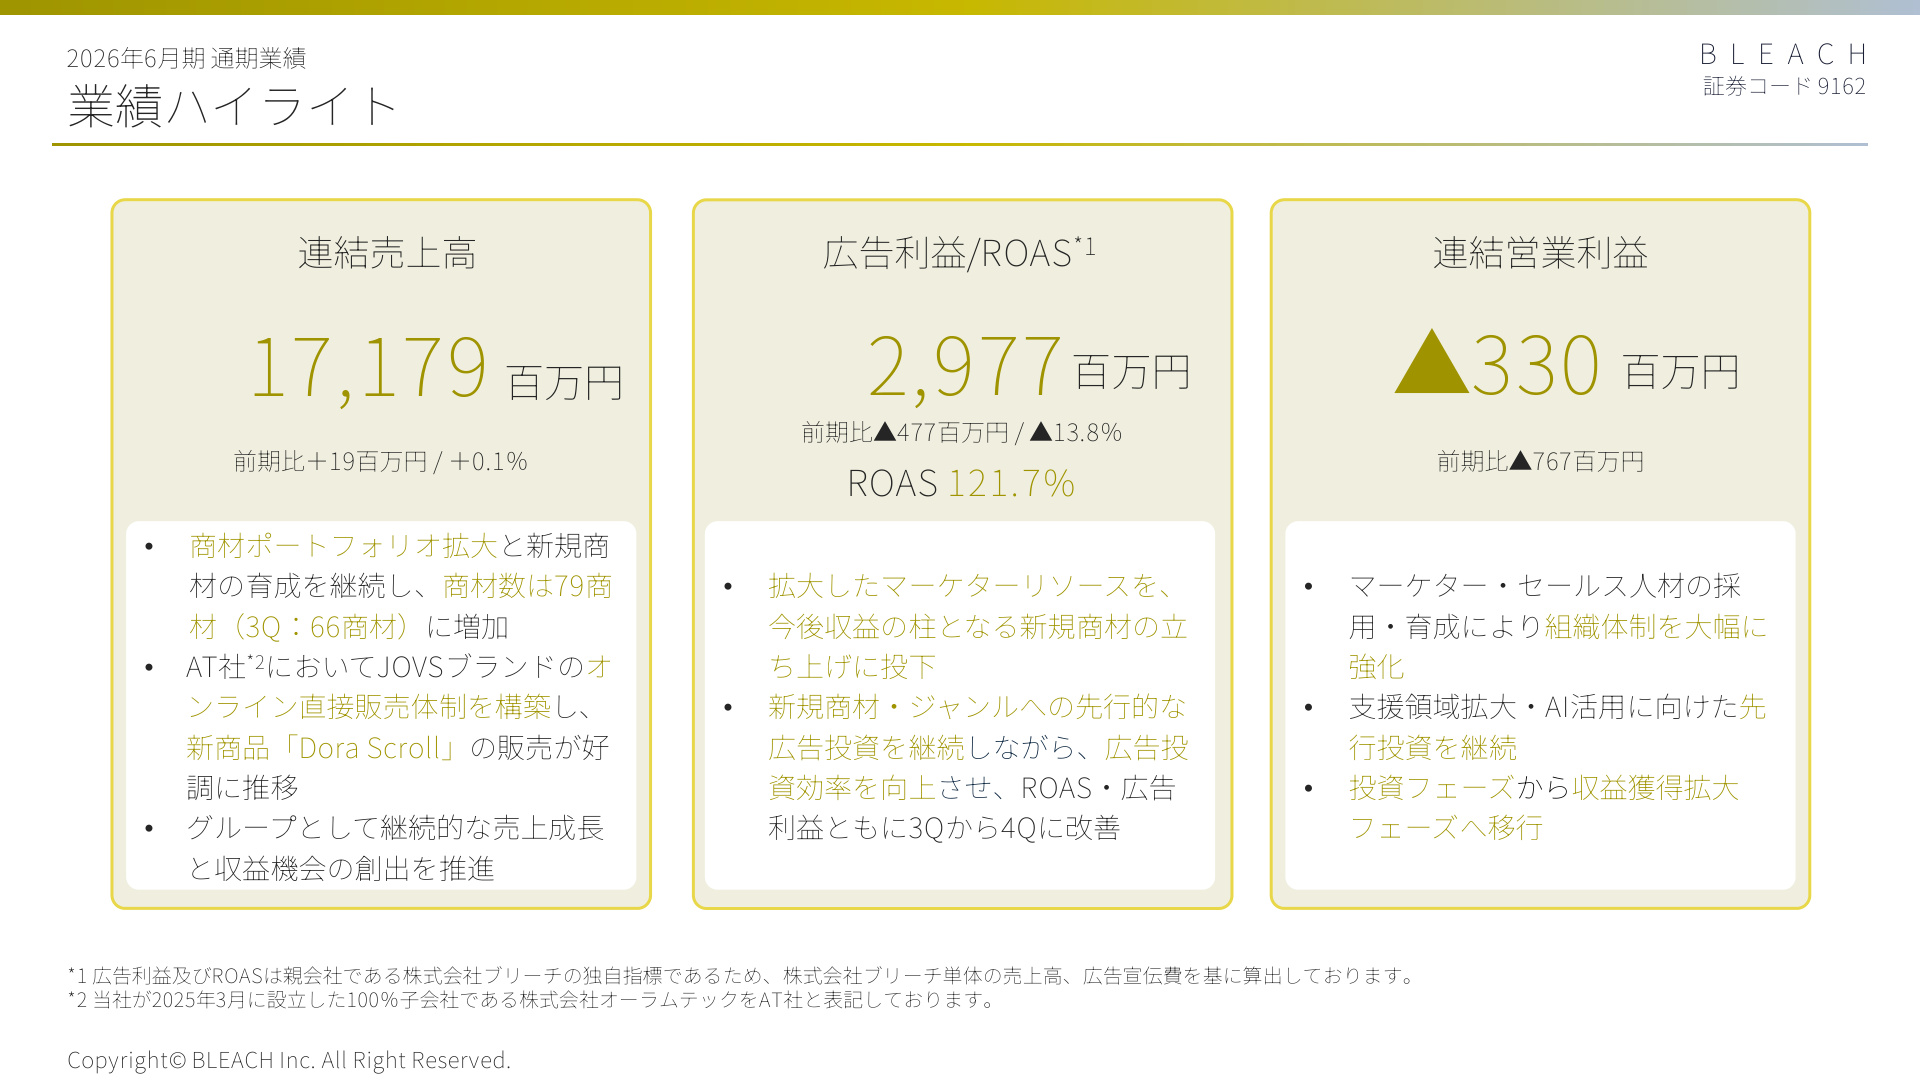
Slide Commentary: Structural Background of Performance Highlights
The slide above (Page 2) serves as the most critical summary of the fiscal year ended June 2026. While net sales remained at a record high (17,179 million yen), profitability was heavily pressured by the company's aggressive upfront investments aimed at expanding its product portfolio and entering new genres. Specifically, earnings were impacted by a temporary decline in advertising investment efficiency due to the launch of new products, as well as increased labor and recruitment costs resulting from the active hiring of marketers and sales personnel (+26 staff YoY) to drive long-term growth. However, on a quarterly basis, ROAS (Return on Advertising Spend) bottomed out at 117.1% in Q3 and improved to 121.7% in Q4 (123.1% for the non-consolidated Q4), indicating a steady transition from the investment phase to the revenue-generation phase.
2. Product Portfolio and Pipeline Trends: Building a Record-High Pipeline
One of Bleach's primary growth drivers is the expansion of its marketing support product pipeline. In the fiscal year ended June 2026, the company aggressively pursued the development of new genres and products.
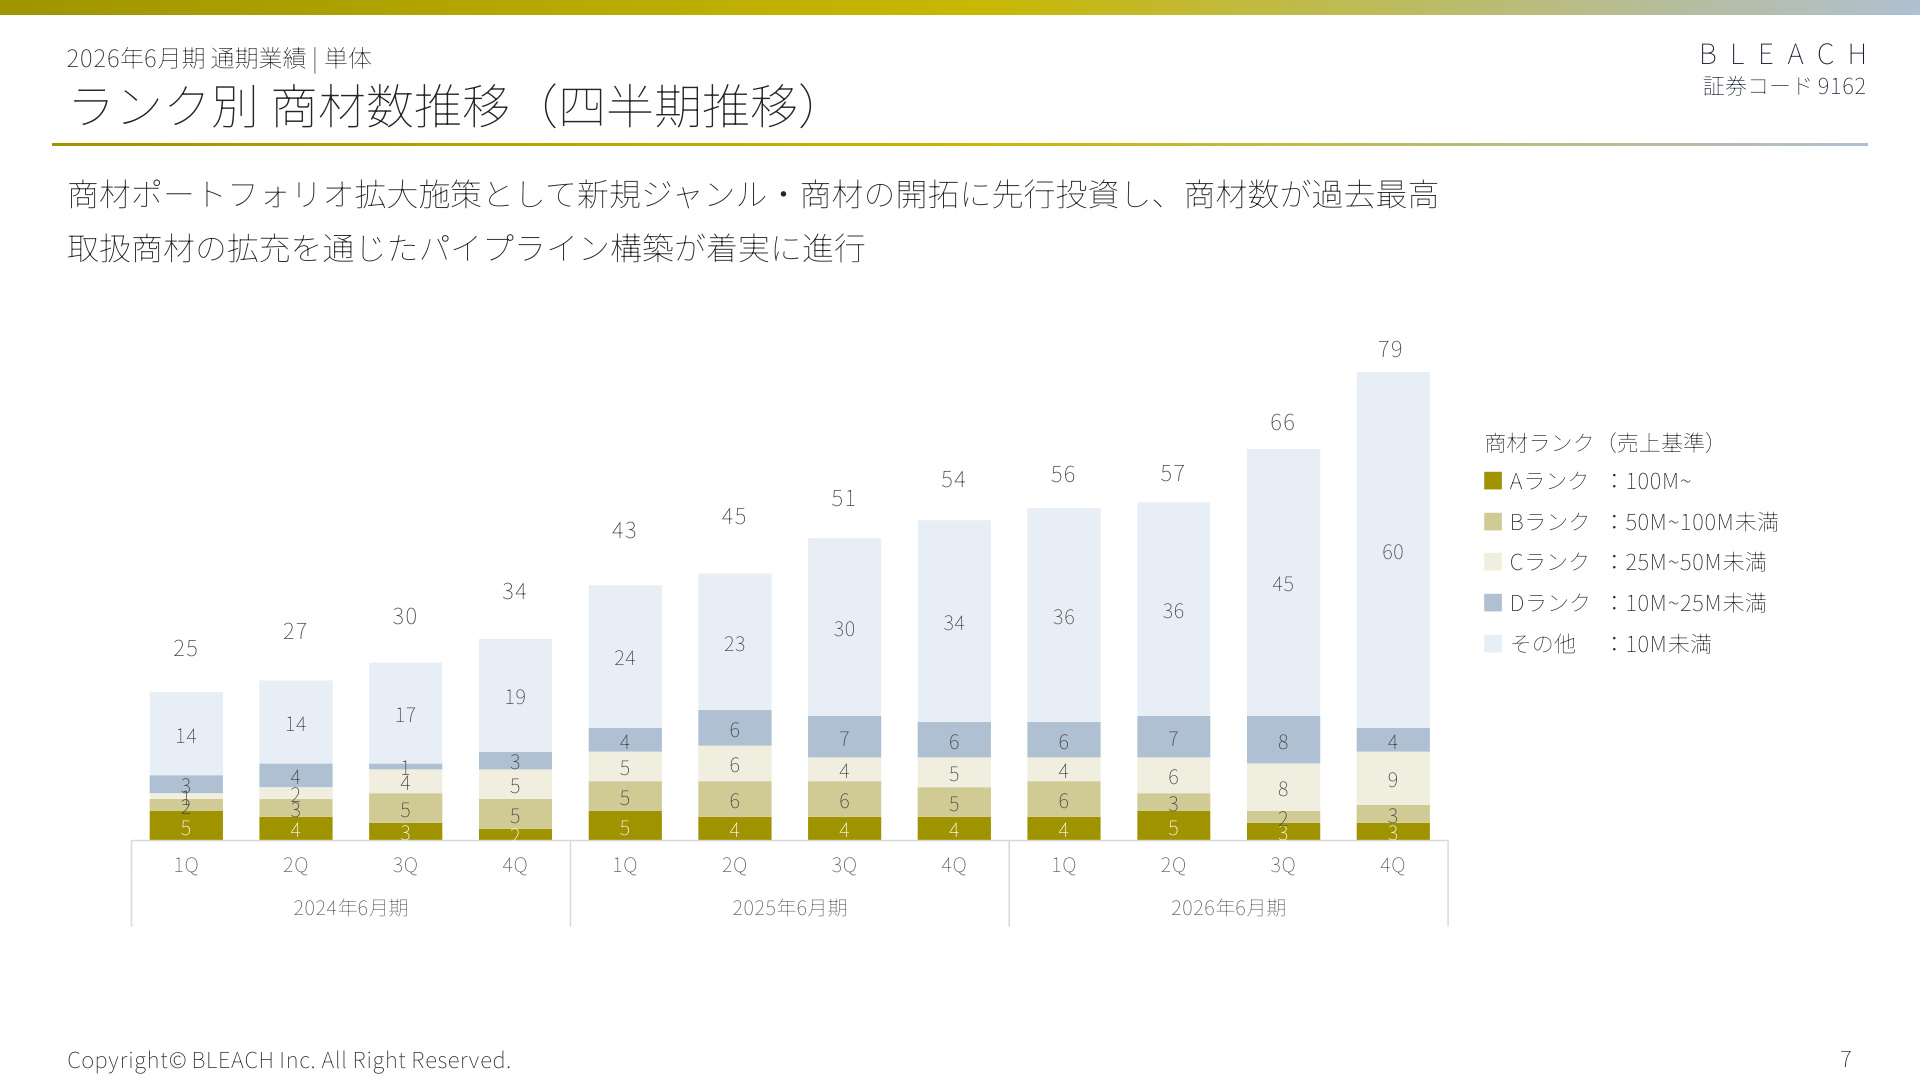
Slide Commentary: Product Count by Rank (Quarterly Trends)
As shown in the slide above (Page 6), the number of products handled by the company reached 79 in Q4 of the fiscal year ended June 2026, marking a record high (a significant increase from 54 products in the same period last year and 66 in Q3). The company ranks products based on sales volume (from A-rank: 100M+ monthly sales to others: under 10M). The steady accumulation of stock in the "Other" and D-rank (10M to under 25M) categories signifies that new products developed through upfront investments are being systematically added to the pipeline, forming a solid foundation for future promotion to high-revenue A-rank and B-rank status.
Sales Trends by Genre
By genre, while traditional mainstays such as functional foods (approx. 5,030 million yen for the full year) and daily necessities (approx. 3,777 million yen) maintained a certain scale, the financial genre showed remarkable expansion. Quarterly sales in the financial genre grew rapidly from 736 million yen in Q1 to 1,288 million yen in Q4, contributing significantly to the diversification of the business portfolio and revenue streams.
Additionally, the wholly-owned subsidiary Aurum Tech Inc. (AT) established a direct online sales structure for the beauty device brand "JOVS," with strong sales of the new "Dora Scroll" product. AT's Q4 sales reached 169 million yen, contributing to the overall group's top-line growth.
3. Organizational Investment and Productivity: Marketer Expansion and Revenue per Head
In the company's revenue-share integrated marketing business model, the quality and quantity of core marketing personnel (marketers) are directly linked to business growth.
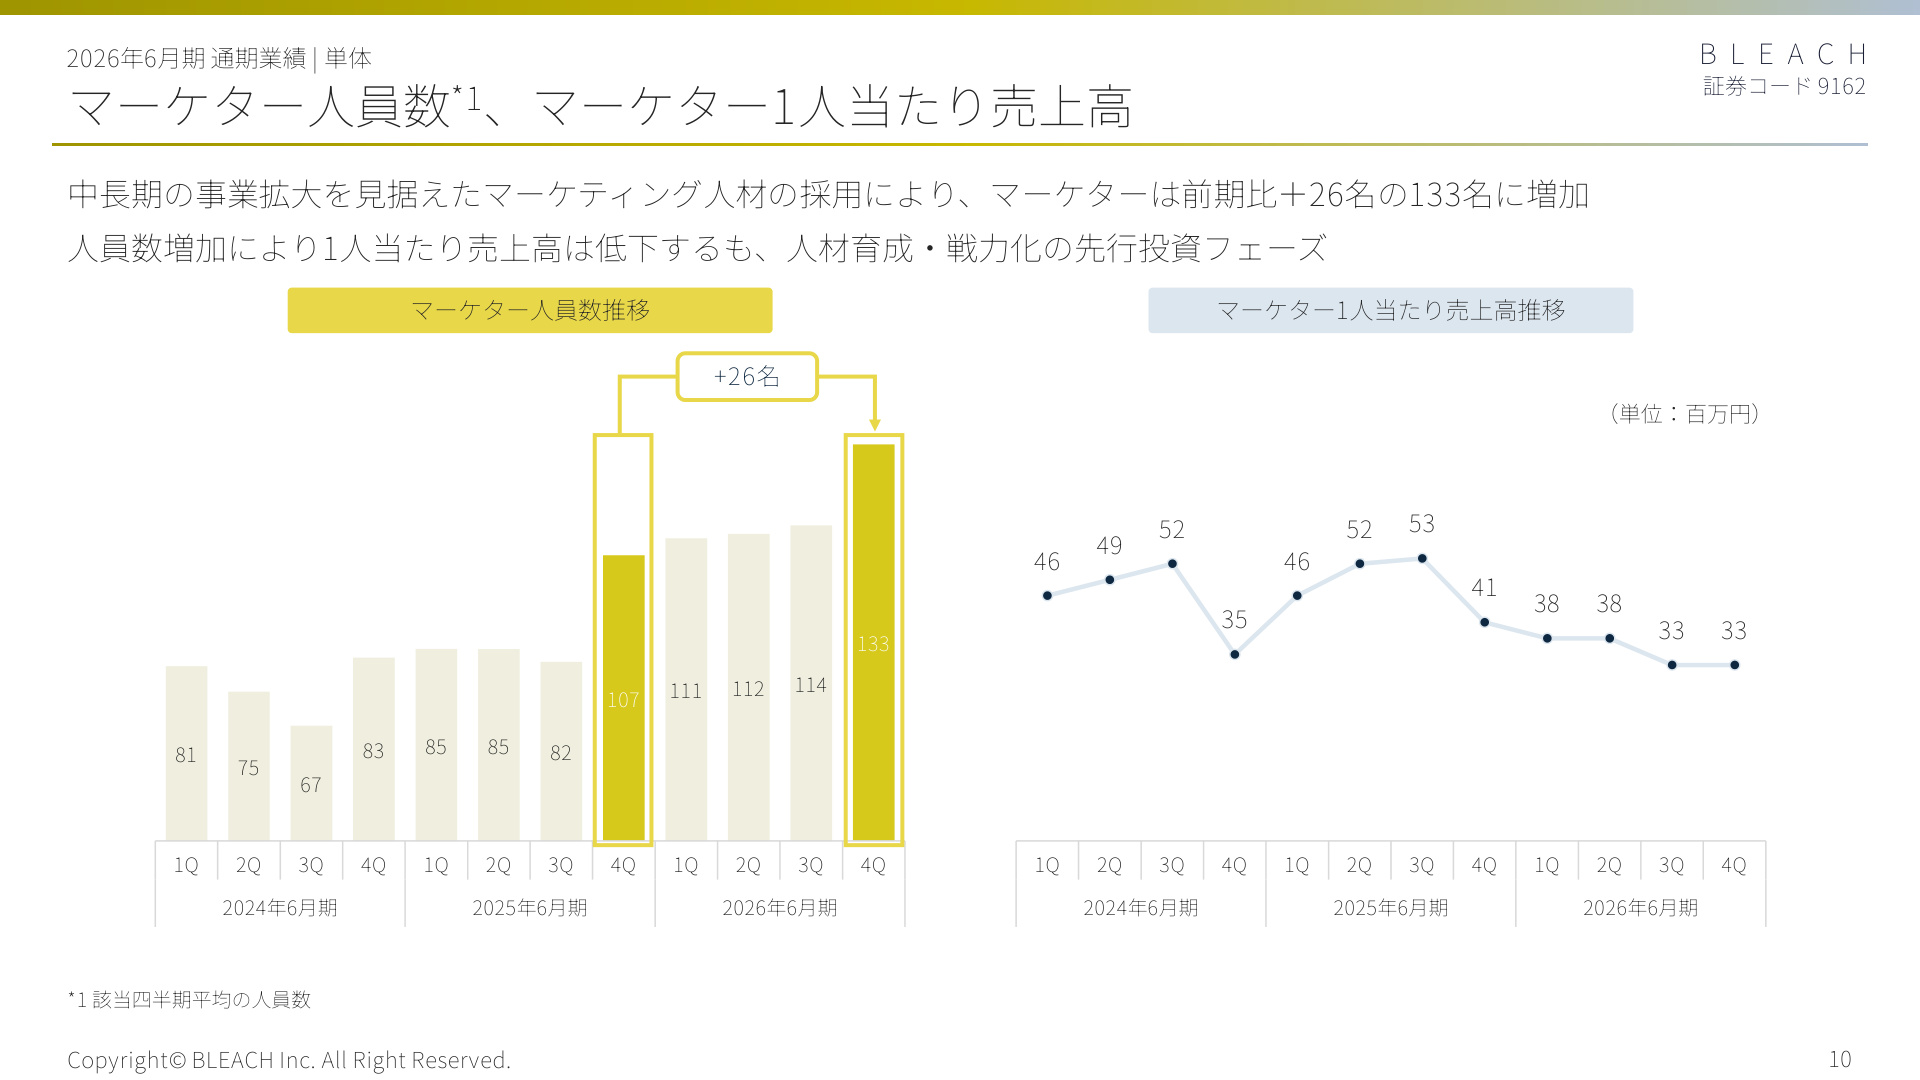
Slide Commentary: Correlation Between Marketer Headcount and Revenue per Head
The slide above (Page 9) illustrates the reality of the company's human capital investment strategy. The number of marketers reached 133 as of Q4 of the fiscal year ended June 2026, an increase of 26 (+24.3%) from the end of the previous fiscal year. As a result of aggressive new graduate and mid-career hiring to strengthen the organizational structure, revenue per marketer temporarily declined (from 38 million yen in Q1 to 33 million yen in Q4) due to an increase in less-experienced staff and associated training costs, which in turn pressured operating profit. However, this is an intentional "upfront investment phase" in anticipation of future business scale, and the structure is designed to see productivity improvements as these new hires become fully operational.
4. Analysis of Financial Foundation and Profit Structure
Key Factors in the Profit and Loss (P/L) Statement
- Increase in Cost of Sales : Due to an increase in product cost of sales (357 million yen, +500.2% YoY) and labor costs (762 million yen, +18.8% YoY), gross profit decreased to 1,742 million yen (down 24.3% YoY).
- SG&A Expenses : Total SG&A expenses were 2,072 million yen (+11.2% YoY). The primary drivers were increased personnel costs associated with hiring sales staff (660 million yen, +21.1% YoY) and advertising/promotion expenses incurred by AT.
Balance Sheet (B/S) and Financial Soundness
- Equity Ratio : The company continues to maintain a high level of financial stability, with the equity ratio at 72.5%, up from 72.1% at the end of the previous fiscal year.
- Cash on Hand : Cash and deposits stood at 6,786 million yen (a decrease of 2,112 million yen from the previous year-end due to debt repayment and product procurement). With net cash of 5.71 billion yen after deducting interest-bearing debt (1,080 million yen), the company maintains a robust financial position capable of withstanding rapid environmental changes while continuing to make upfront investments.
5. Future Growth Strategy and Outlook for the Fiscal Year Ending June 2027
Background on "Undecided" Earnings Forecasts for FY2027
The company has not disclosed its full-year earnings forecast for the fiscal year ending June 2027, labeling it as "undecided." The core revenue-share marketing support business is inherently volatile, as performance depends on the growth speed of client products, changes in advertising media algorithms, and the timing of monetization for new products. Given the difficulty in calculating reasonable forecasts while pursuing long-term corporate value enhancement initiatives (such as new genre expansion and AI utilization), the company plans to disclose forecasts as soon as they become reasonably estimable.
Five Key Growth Themes
- Further Expansion of Product Portfolio : Developing new genres such as finance, online medical services, and recruitment, while deepening existing genres (cosmetics, daily necessities, etc.).
- Diversification of Marketing Methods and Media : Incorporating new methods such as SNS advertising, video advertising, and e-commerce mall operations.
- Strengthening Recruitment and Training : Expanding new graduate hiring and enhancing the proprietary marketer training program.
- Promotion of AI and Data Utilization : Accumulating and analyzing advertising data, and maximizing advertising effectiveness through AI-driven automation of creative production and operations.
- Expansion of Manufacturer Support Functions : Developing sales infrastructure support through collaboration with Aurum Tech.
6. Conclusion
The fiscal year ended June 2026 was a "year of upfront investment" for Bleach, during which the company prioritized long-term expansion over short-term profit. By increasing its marketer headcount (to 133) and achieving a record-high number of products handled (79), the company has definitively strengthened its "pipeline" and "organizational capabilities" for business expansion. With ROAS showing signs of recovery, the key to future earnings growth will be the successful integration of new talent and the monetization of new products.
Correction (September 29, 2026): Corrected the specified amounts, rates or reporting periods against the original company disclosure; the verified changes are recorded in the correction ledger. Source
This content is not intended as investment advice or a recommendation. Any opinions expressed are solely the personal views of each article.