


BTM Inc. Q1 FY2027 Earnings Deep Dive: Unpacking the Drivers of Robust Profit Growth and the Proprietary Database Strategy

StockClub
Published: Aug 14, 2026, 11:36 AM
Sentiment Analysis
BTM Inc. Q1 FY2027 Earnings Deep Dive: Unpacking the Drivers of Robust Profit Growth and the Proprietary Database Strategy
BTM Inc. (Securities Code: 5247), a company specializing in DX promotion utilizing regional talent, has released its financial results for the first quarter (Q1) of the fiscal year ending March 2027. This report provides a comprehensive analysis of the company's performance, financial position, growth strategy, and competitive advantages, drawing from the disclosed earnings presentation materials.
1. Q1 FY2027 Earnings Summary
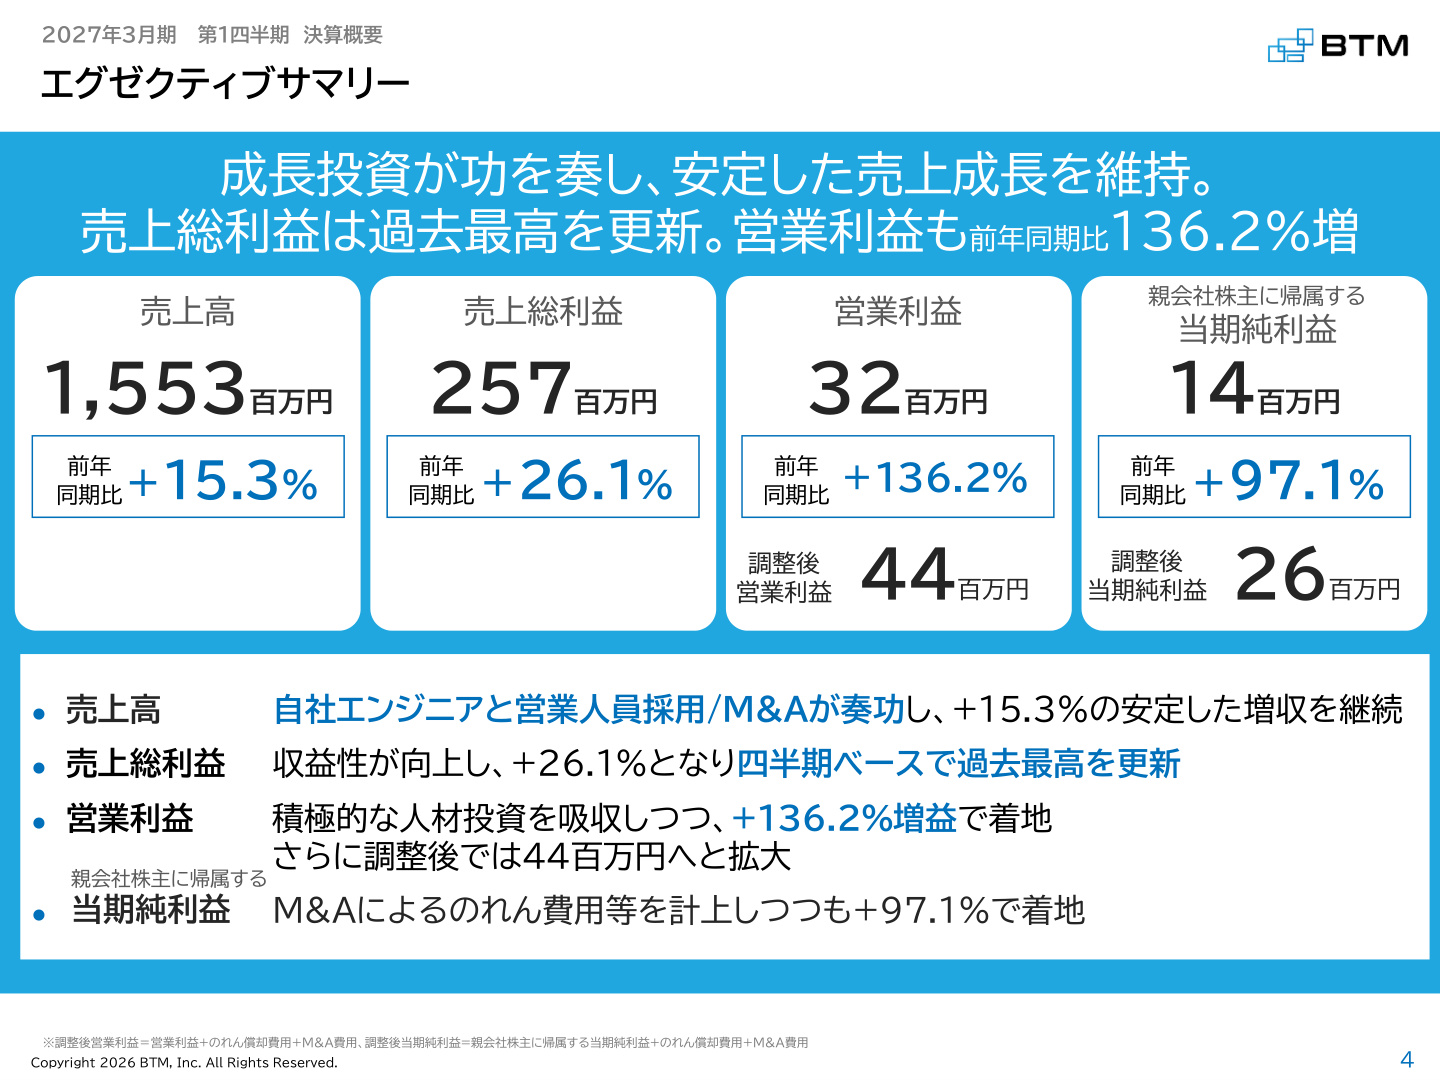
BTM’s consolidated performance for the first quarter of the fiscal year ending March 2027 showed a very strong start, with both revenue and profit at all levels significantly exceeding the same period last year.
- Revenue : ¥1,553 million (+15.3% YoY)
- Gross Profit : ¥257 million (+26.1% YoY)
- Operating Profit : ¥32 million (+136.2% YoY)
- Ordinary Profit : ¥29 million (+141.6% YoY)
- Profit Attributable to Owners of Parent : ¥14 million (+97.1% YoY)
Adjusted Operating Profit , which accounts for goodwill amortization and M&A-related expenses, reached ¥44 million , while Adjusted Net Profit hit ¥26 million , demonstrating a steady improvement in the company's underlying earning power.
Why this slide matters (Slide Commentary)
The slide above serves as the essential executive summary, allowing for an immediate grasp of the "key figures" and the "big picture of growth" for the Q1 results. Beyond the steady revenue growth of ¥1,553 million (+15.3%) , the major highlight is that gross profit reached a record high on a quarterly basis . The strengthening of internal engineering and sales recruitment, combined with the synergy effects of M&A executed in the previous fiscal year, has led to a rise in profitability, with the gross profit growth rate (+26.1%) outpacing the revenue growth rate.
2. Analysis of Operating Profit Growth (Waterfall Commentary)
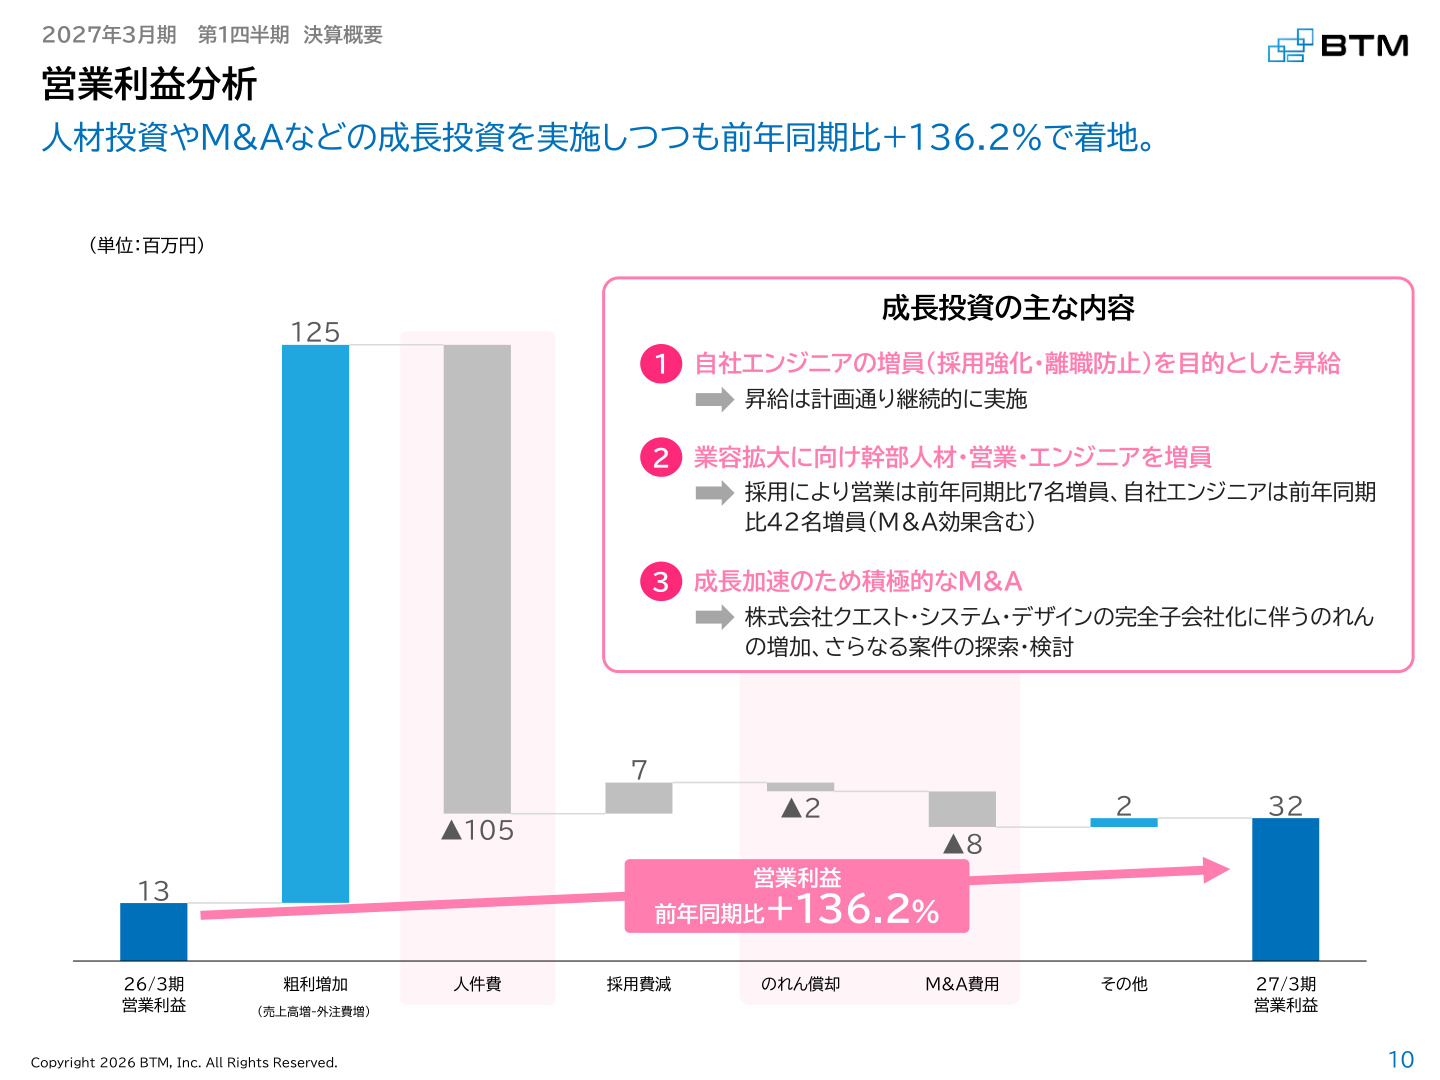
Operating profit for the first quarter more than doubled, growing from ¥13 million in the same period last year to ¥32 million (+136.2% YoY) . This rapid increase is underpinned by a structure that achieves revenue expansion exceeding the costs of aggressive business investment.
Why this slide matters (Slide Commentary)
This operating profit analysis (waterfall chart) is indispensable for understanding the balance between BTM’s "growth investment" and "profit generation." Increased gross profit (driven by revenue growth and strict management of outsourcing costs) contributed +¥125 million to profit. Conversely, personnel expenses increased by ¥105 million due to salary hikes and the addition of internal engineers (+42 YoY) and sales staff (+7 YoY), while M&A expenses and goodwill amortization increased by ¥8 million and ¥2 million , respectively. In short, despite significantly expanding investments in personnel and M&A for future growth, the company achieved a high +136.2% YoY growth in operating profit by generating gross profit that more than offset these costs.
3. Full-Year Forecast and Q1 Progress
There are no changes to the full-year earnings forecast for the fiscal year ending March 2027, which is based solely on existing (organic) business as follows:
- Revenue Forecast : ¥7,001 million (+16.0% YoY)
- Operating Profit Forecast : ¥124 million (+15.1% YoY)
- Ordinary Profit Forecast : ¥118 million (+17.3% YoY)
- Net Profit Forecast : ¥66 million (+1.9% YoY)
Progress rates against the full-year plan as of Q1 are as follows:
- Revenue Progress : 22.2%
- Operating Profit Progress : 26.4%
- Ordinary Profit Progress : 25.0%
- Net Profit Progress : 22.3%
Since the contribution to revenue and profit from the sales staff recruited in Q1 is expected to fully materialize from the second half onward , an operating profit progress rate of 26.4% at the end of Q1 indicates a very steady pace toward achieving the full-year target. Note that this full-year forecast does not include the upside impact of future M&A , leaving room for further non-linear growth.
4. Key Performance Indicators (KPIs)
The trends in the three key KPIs supporting BTM’s business growth are as follows:
- Number of Sales Staff : 38 (34 at end of FY26/3 → 40 full-year forecast) Aggressive recruitment in Q1 has significantly enhanced project development capabilities.
- Number of Partner Accounts : 11,425 (11,203 at end of FY26/3 → 12,550 full-year forecast) The number of business partner (BP) contact accounts nationwide is growing steadily, forming the foundation of supply capacity.
- Number of Internal Engineers : 191 (189 at end of FY26/3 → 220 full-year forecast) Further personnel expansion is planned from Q2 onwards, driven by internal hiring and synergies from group subsidiaries.
5. Key Topics and Strategic Initiatives in Q1
① Acceleration of M&A Strategy and Disciplined Investment
The company positions M&A as a key growth driver. Following the transfer of the SES business from Laniakea Inc. in May 2025, it acquired Quest System Design Co., Ltd. as a subsidiary in October of the same year. Post-merger integration (PMI) is proceeding smoothly, and the company is strengthening deal sourcing by conducting top-level meetings for several deals per month, targeting assets with a business value of up to approximately ¥1 billion .
② Strengthening the AI Domain and Launching "TracisAI"
BTM has developed "TracisAI," a SaaS-based AI agent that automates log investigation and autonomous resolution using generative AI, and has launched it on the Amazon AWS Marketplace . The service significantly reduces operational costs by automating root cause analysis, SQL generation, and log analysis through natural language input from platforms like Slack and Google Chat. Expansion of AI-related services is being promoted through its AI subsidiary (BTMAIZ) and other partnerships.
③ Concrete Examples of Regional Revitalization and DX Promotion
Through business matching with Hachijuni Nagano Bank, BTM won and executed a project to completely overhaul the 20-year-old legacy system of Ina Seimitsu Kogyo into a cloud environment. Additionally, the company joined as a co-creation partner for "E:N BASE," a public-private co-creation hub established by Ehime Prefecture, accelerating DX proposals through collaboration with local governments and businesses.
6. Differentiation from Competitors and Market Opportunity (SAM Size)
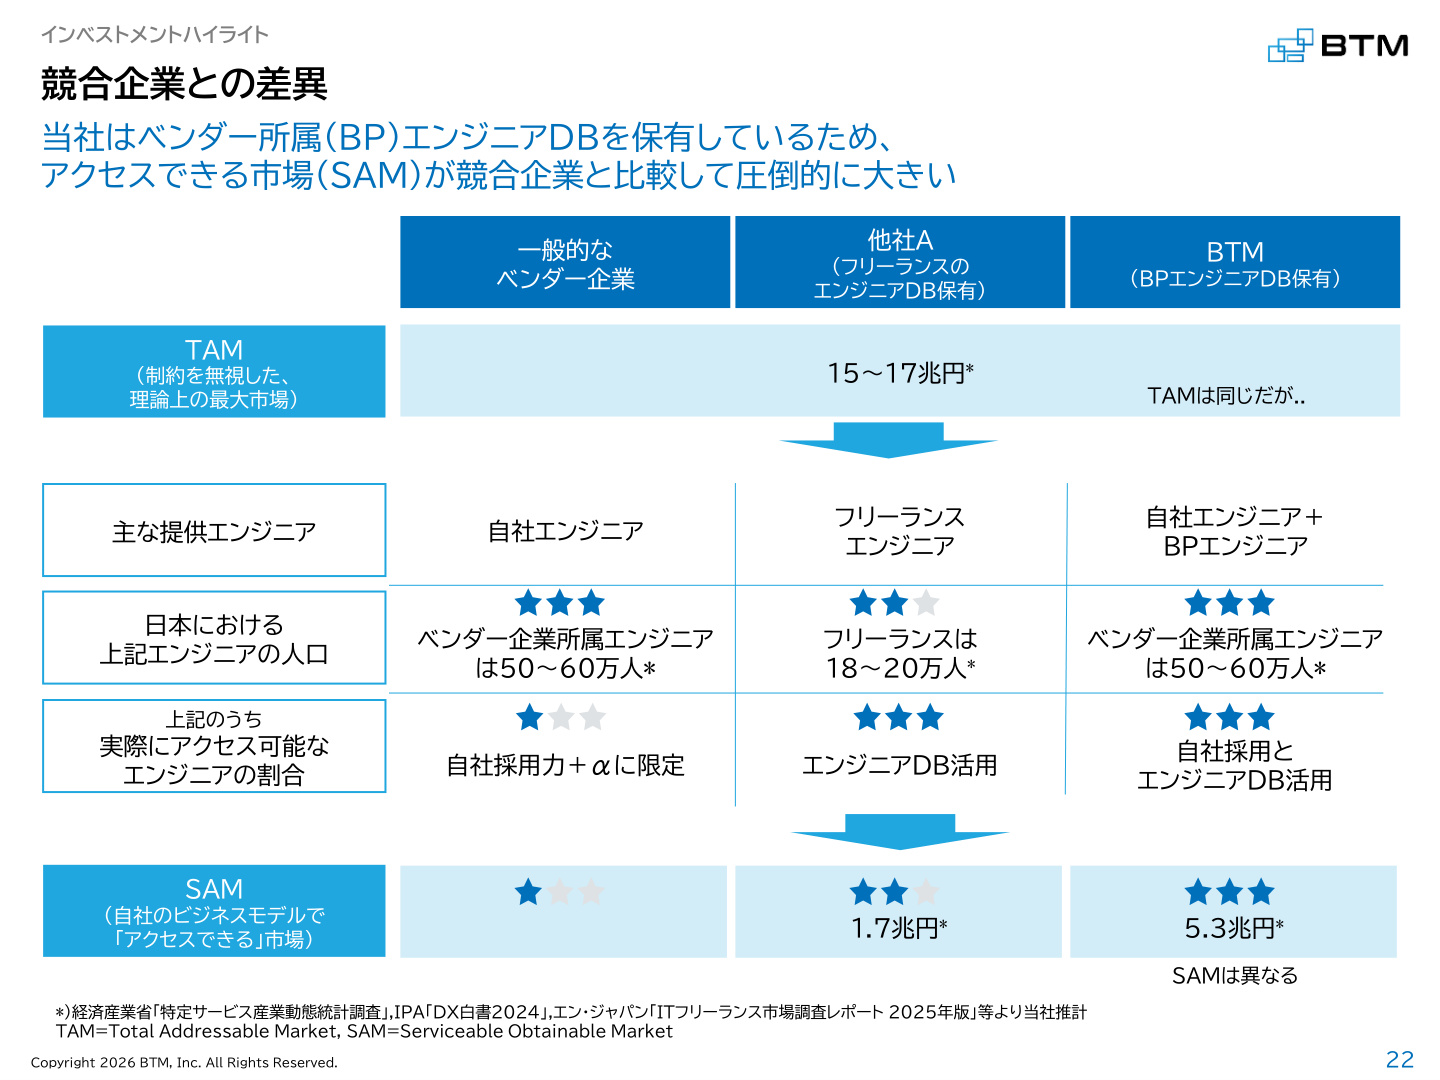
The greatest strength that sets BTM apart from its peers lies in its proprietary "Partner (BP) Engineer Database" and its "Regional Talent Utilization Model."
Why this slide matters (Slide Commentary)
The slide above is a crucial diagram proving the uniqueness of BTM’s business model and the overwhelming size of its Serviceable Addressable Market (SAM). Typical IT vendors can only handle projects within the scope of their own engineers (limited market size), and other companies dealing with freelance databases can only access about 180,000 to 200,000 engineers (SAM of ¥1.7 trillion). In contrast, BTM has built a database of over 11,200 partner companies nationwide, allowing it to access engineers belonging to vendor companies (500,000 to 600,000) . As a result, its SAM (the market it can actually access) reaches ¥5.3 trillion , providing it with overwhelming order opportunities and talent supply capabilities compared to competitors.
7. Conclusion and Future Outlook
BTM’s Q1 FY2027 earnings were of exceptionally high quality, achieving significant growth in both gross profit and operating profit while aggressively pursuing investments in talent and M&A .
- Improved Profitability : With revenue up 15.3% and operating profit up 136.2%, operational leverage is beginning to take effect.
- Fusion of Organic and Inorganic Growth : The company is operating on two wheels: expanding existing business through increased sales staff and achieving non-linear growth through disciplined M&A.
- Unique Strengths : Its market advantage of a "¥5.3 trillion SAM," backed by a database of over 10,000 accounts nationwide, and its expansion into cutting-edge areas like TracisAI form a solid foundation.
Moving forward, attention will be focused on the full realization of results from sales staff in the second half, the progress of new M&A deals, and trends in acquiring regional DX projects.
This content is not intended as investment advice or a recommendation. Any opinions expressed are solely the personal views of each article.