


Startline (477A) Q1 FY2027 Earnings Deep Dive: Robust Growth Driven by Steady Stock-Based Expansion and Front-Loaded Flow Revenue

StockClub
Published: Aug 14, 2026, 11:20 AM
Sentiment Analysis

Introduction: Overview of Financial Results and Key Takeaways
Startline Co., Ltd. (Securities Code: 477A) , a company specializing in employment support for individuals with disabilities, delivered a strong start to the fiscal year ending March 2027, with Q1 results significantly exceeding the same period last year across both top-line and bottom-line metrics.
This report extracts 10 key topics from the disclosed earnings materials, providing a comprehensive analysis of the company's current performance trends, revenue structure, growth strategy, and the impact of the macroeconomic environment.
1. Q1 FY2027 Earnings Highlights and Drivers of Profit Growth
1.1 Significant Revenue Growth and Record-High Sales
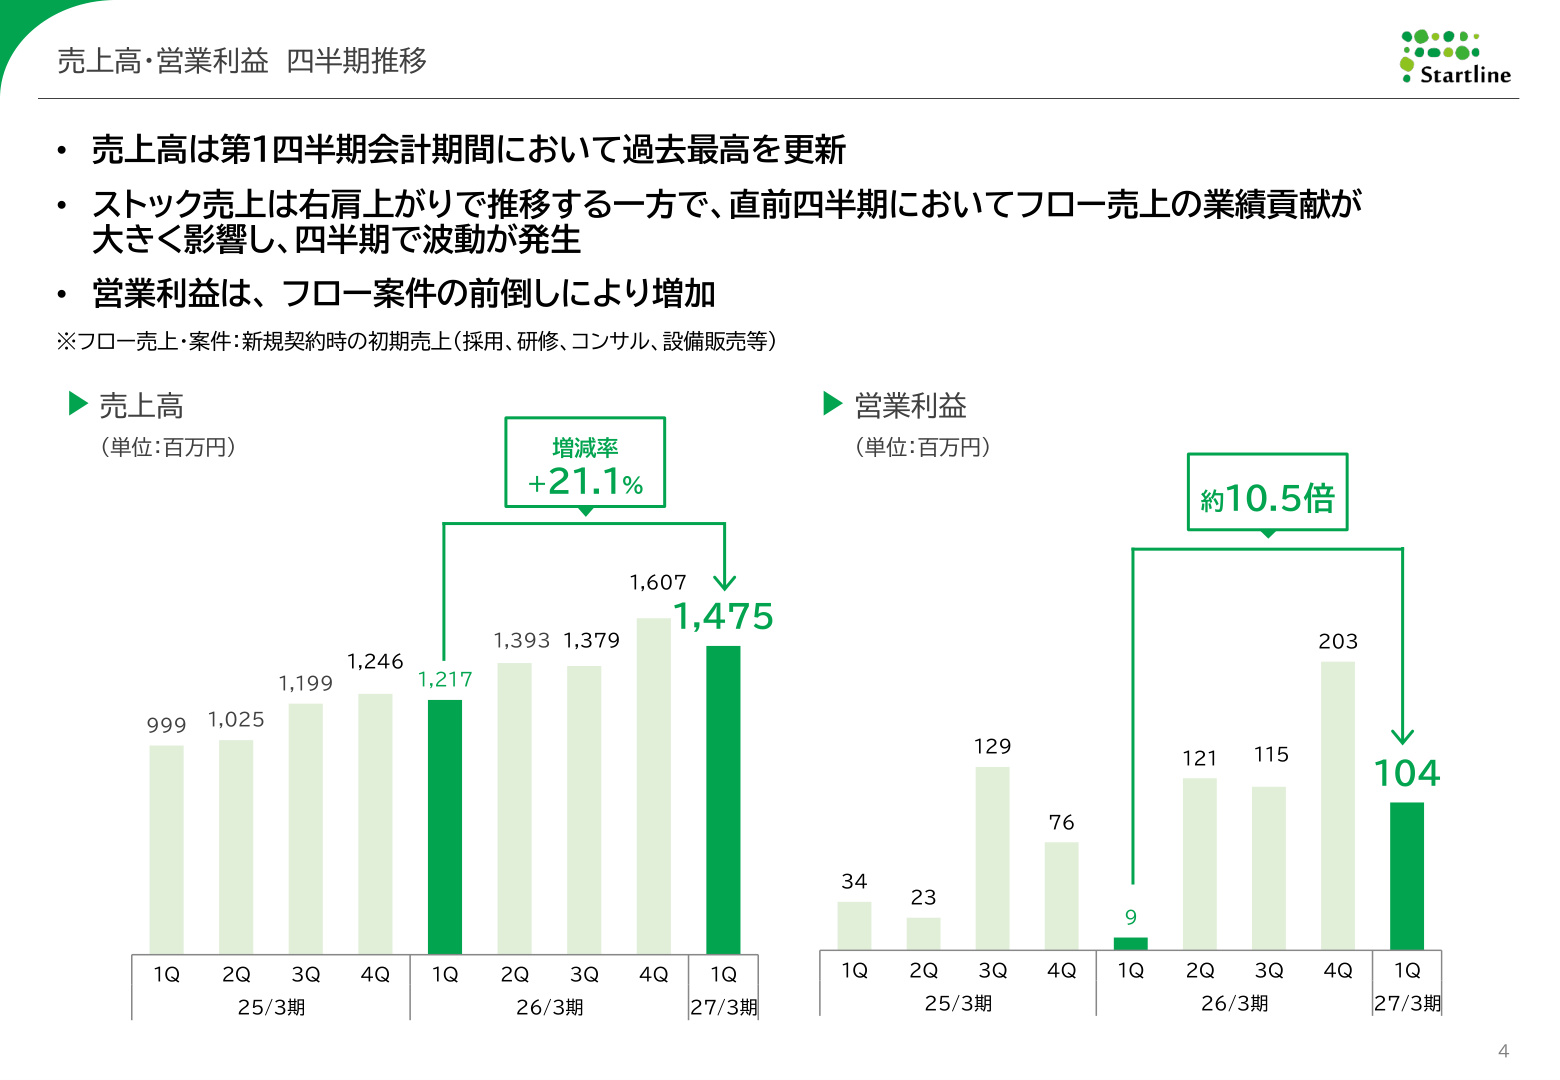
Performance for Q1 FY2027 (April–June 2026) was as follows: Net Sales of 1,475 million JPY (+21.1% YoY) , Operating Profit of 104 million JPY (+949.4% YoY, approx. 10.5x) , EBITDA of 219 million JPY (+128.1% YoY) , Ordinary Profit of 91 million JPY (vs. -2 million JPY in the same period last year) , and Net Income of 56 million JPY (vs. -14 million JPY in the same period last year) .
Q1 net sales reached a record high , and operating profit surged from 9 million JPY in the same period last year to 104 million JPY.
1.2 Front-Loading of Flow Revenue Exceeds H1 Plan
The significant profit growth was driven not only by the steady expansion of core stock-based revenue but also by the front-loading of flow revenue (initial revenue from recruitment, training, consulting, and equipment sales) originally scheduled for Q2 . This factor resulted in progress that significantly outperformed the H1 operating profit plan.
The slide below illustrates the quarterly trends in net sales and operating profit.
[Slide Commentary: Importance of Quarterly Sales and Operating Profit Trends]
The slide above (Slide 4) is crucial for understanding the combined behavior of "stock" and "flow" elements in the company's performance. The sales graph shows a steady upward trend on a quarterly basis over the past few years. Conversely, as the operating profit bar chart indicates, profits fluctuate based on the timing of new site openings and the realization of initial flow revenue. In this Q1, the 21.1% YoY increase in sales, combined with the concentrated effect of front-loaded flow projects, caused operating profit to jump approximately 10.5x from 9 million JPY to 104 million JPY. This graph clearly demonstrates the resilience of the company's stock-based business model and the mechanism of short-term profit amplification driven by the timing of flow revenue.
2. Trends in Key KPIs Supporting Growth
2.1 Upward Trend in Corporate Clients and Supported Individuals
The company's business model is a high-retention, stock-based model with very low churn, and its growth is directly linked to two KPIs: number of corporate clients and number of supported individuals with disabilities .
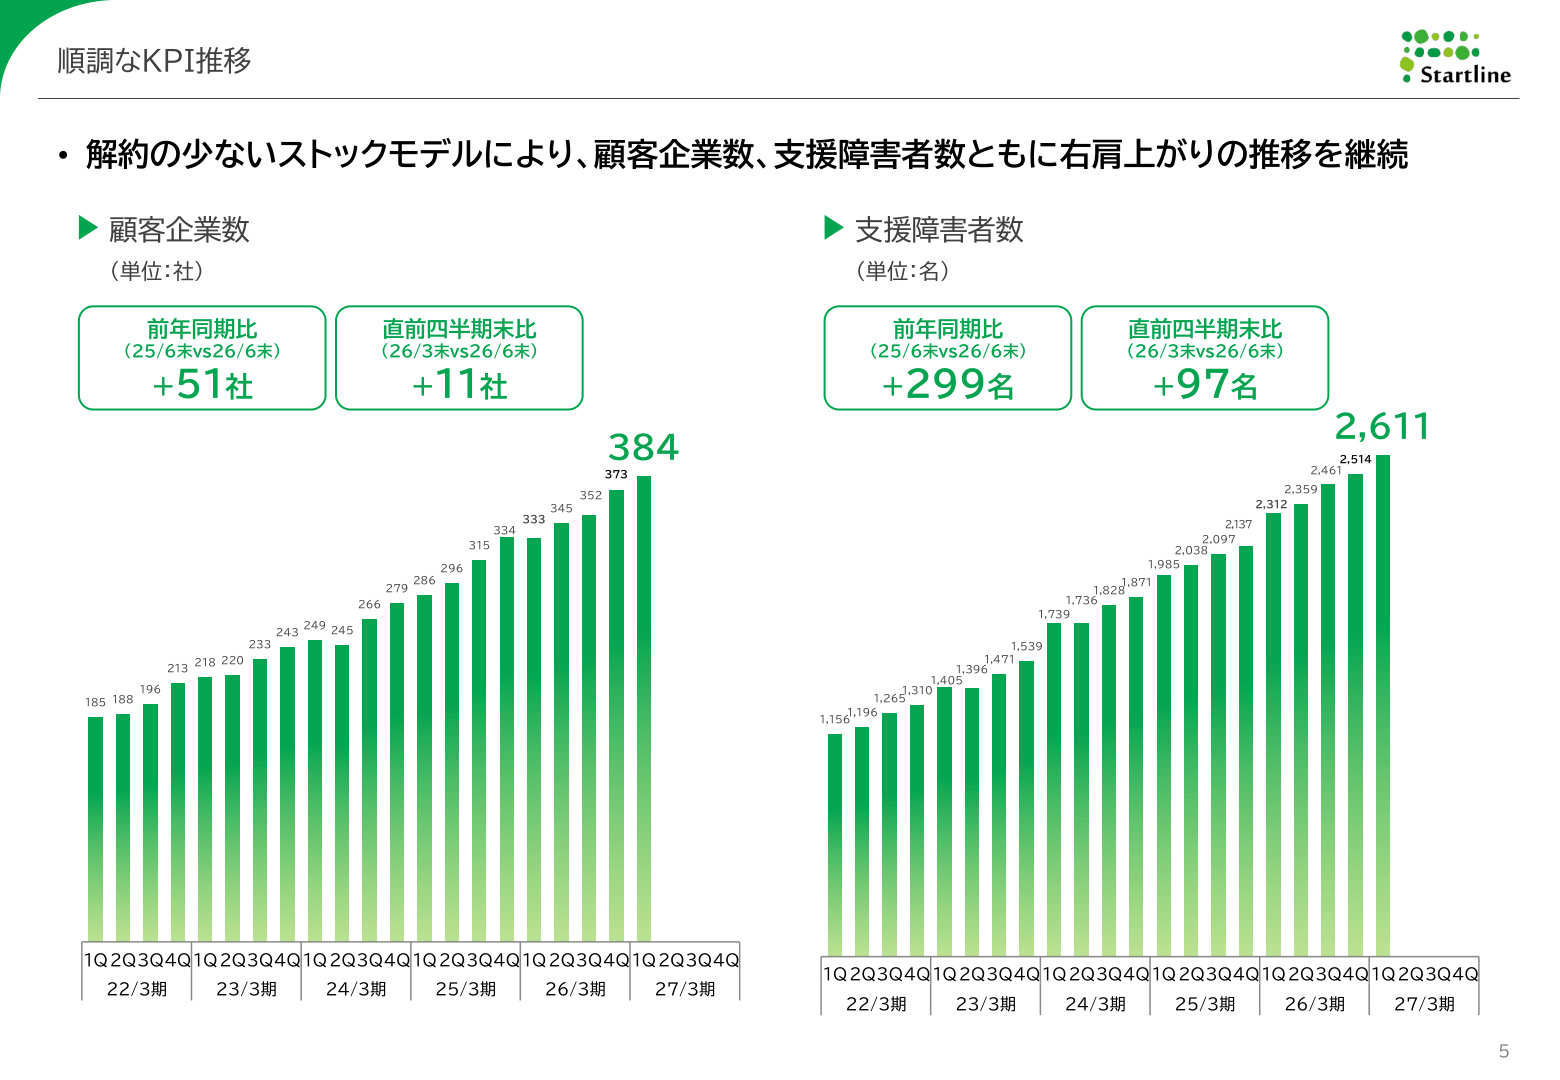
- Number of Corporate Clients : 384 (+51 YoY, +11 QoQ)
- Number of Supported Individuals : 2,611 (+299 YoY, +97 QoQ)
Both indicators have maintained a consistent upward trend over the long term, proving the steady accumulation of the customer base.
[Slide Commentary: Background and Significance of KPI Trends]
The slide above (Slide 5) provides fundamental data proving that the company maintains a robust stock model with a low churn rate . The number of corporate clients has doubled from 185 in Q1 FY2022 to 384, and the number of supported individuals has expanded significantly from 1,156 to 2,611. This indicates an extremely high intent for continued service usage in the disability employment support sector. The service structure, which makes churn difficult ( churn rate of 2.1% ), is the driving force that directly translates the accumulation of new clients into top-line growth.
3. Progress in Site Strategy and Area Expansion
3.1 Securing 8 Sites and Creating 600 Employment Slots for the Current Fiscal Year
The company is expanding employment opportunities through the comprehensive deployment of satellite-type sites. For the current fiscal year, the company has already secured a total of 8 sites : 2 in H1 (Nagoya, Aichi; Yokohama, Kanagawa) and 6 in H2 (Itami, Hyogo; Maebashi, Gunma; Nagoya, Aichi; Edogawa, Tokyo; Kyoto, Kyoto; Osaka, Osaka). This has established an environment where approximately 600 additional individuals with disabilities can be employed , and preparations for site openings for the next fiscal year (FY2028) are progressing smoothly.
3.2 Expansion from Major Metropolitan Areas to Regional Cities
The number of satellite sites is expected to nearly double from 29 at the end of FY2022 to 54–56 by the end of FY2027. The company is moving beyond its traditional focus on major metropolitan areas, actively expanding into municipalities with populations of over 100,000 and new regions such as Tokai (Aichi), Northern Kanto (Gunma), and Kansai (Hyogo, Kyoto, Osaka) in collaboration with local governments.
4. Revenue Structure and Unit Economics
4.1 Quarterly Earnings Guidance and Reasons for "H2 Weighting"
The company's earnings plan is structurally weighted toward the second half .
- Net Sales : As stock revenue forms the base, it accumulates steadily each quarter.
- Operating Profit : H1 tends to have lower profit margins due to upfront investment costs for property acquisition, recruitment, and training for new sites. Profits then surge in H2 as these investments are recovered and stock revenue matures.
4.2 Investment Recovery Model per Site
- Initial Investment : Generally offset and recovered by initial flow revenue (consulting, equipment sales, etc.) obtained at the time of a new contract.
- Monthly Profitability : Achieved within approximately six months of opening.
- Cash Flow Recovery : While it varies depending on site scale and simultaneous openings, full recovery is typically achieved in 18 to 36 months .
This high investment efficiency enables rapid, continuous site openings using internal funds.
5. Macro Environment and Regulatory Tailwinds
5.1 Impact of Statutory Employment Rate Increase (2.5% → 2.7%)
Effective July 1, 2026, the statutory employment rate for individuals with disabilities was raised from 2.5% to 2.7% . This has further increased corporate obligations and demand, leading to a significant rise in inquiries and business negotiations following company-hosted events and online seminars (e.g., 416 attendees at HR EXPO).
5.2 Industry Standardization and Guidelines
As the Ministry of Health, Labour and Welfare works on creating guidelines for the "disability employment business," Startline, as a core member of the Japan Association of Disability Employment Promotion, is engaging in dialogue with the ministry to develop sound, industry-specific guidelines . The company is solidifying its position as a leader driving the quality and integrity of employment.
6. Competitive Advantages of "Diverse Village" and Other Formats
The company's "Diverse Village" is the industry's first composite satellite site that consolidates multiple job functions—such as office work, plant cultivation (IBUKI), and coffee bean hand-picking/roasting (BYSN)—into a single location. With dedicated support staff on-site, it provides diverse career options for individuals with disabilities while enabling client companies to generate deliverables that match their specific business needs, leading to rapidly increasing demand.
7. Full-Year Earnings Forecast for FY2027
7.1 Progress Against Full-Year Plan and Maintenance of Guidance
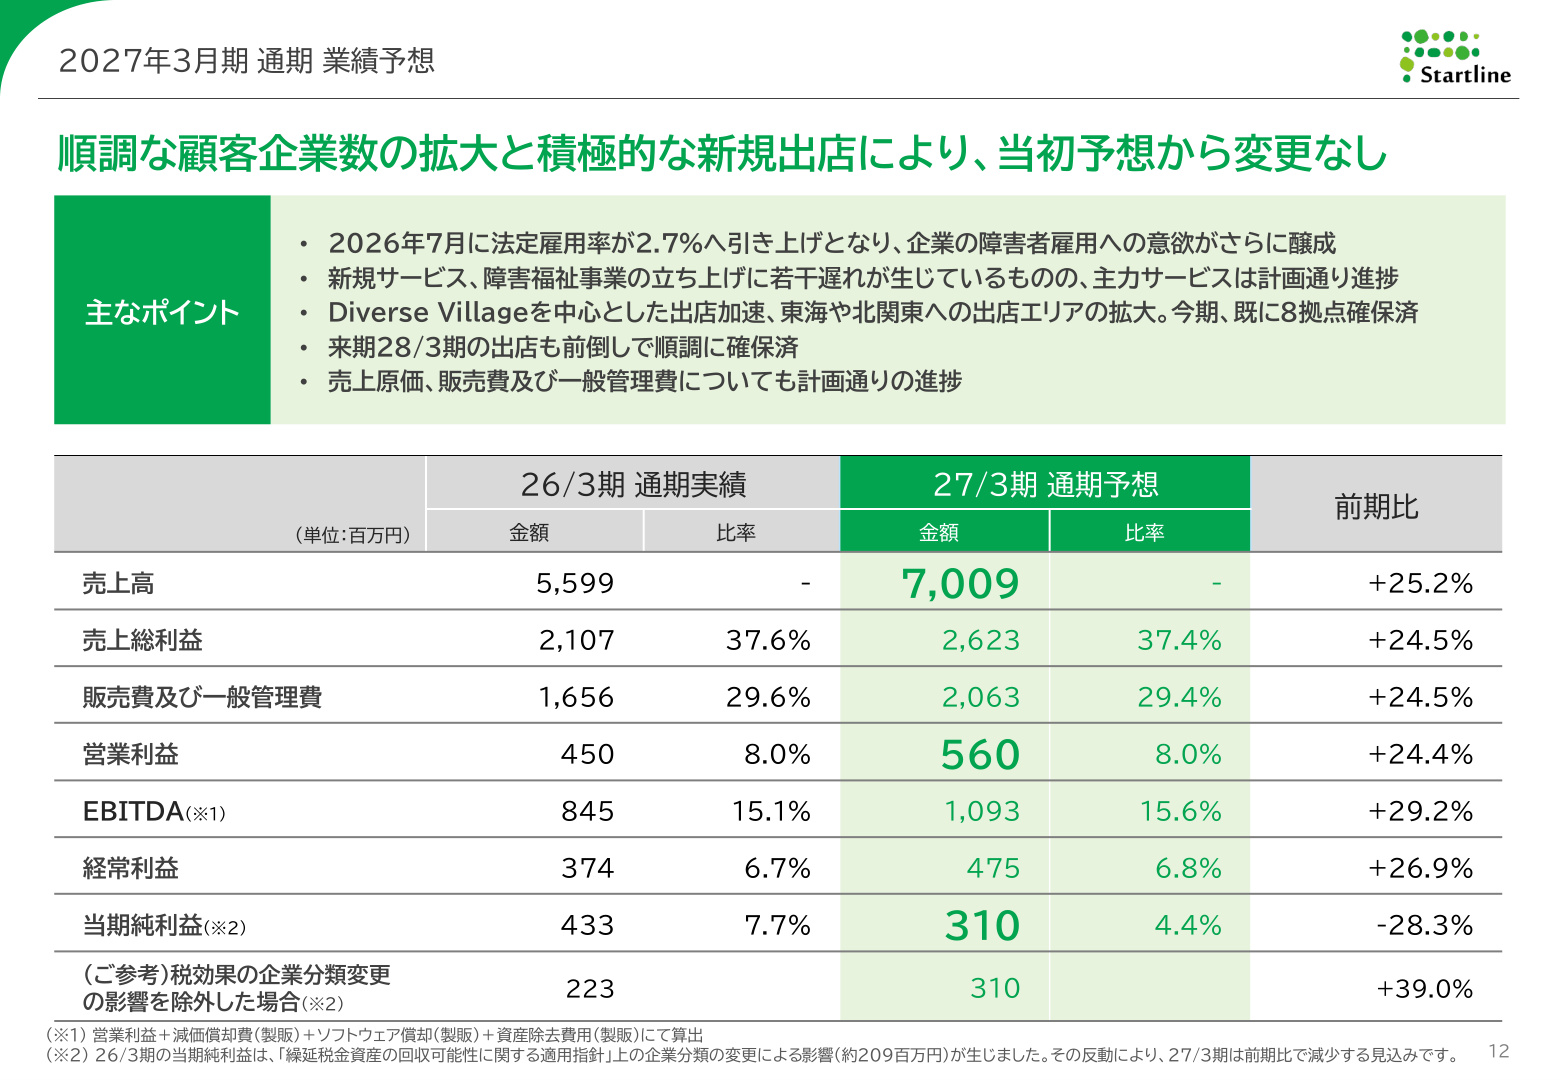
Although Q1 performance exceeded the H1 plan due to front-loaded flow revenue, the full-year earnings forecast remains unchanged .
[Slide Commentary: Overview of FY2027 Full-Year Forecast]
The slide above (Slide 12) shows the company's growth targets and revenue structure for the current fiscal year:
- Net Sales : 7,009 million JPY (+25.2% YoY)
- Operating Profit : 560 million JPY (+24.4% YoY)
- EBITDA : 1,093 million JPY (+29.2% YoY)
- Ordinary Profit : 475 million JPY (+26.9% YoY)
- Net Income : 310 million JPY (-28.3% YoY)
The high-growth plan of exceeding 7 billion JPY in sales and achieving 24.4% operating profit growth is maintained. The YoY decline in net income is due to a one-time profit addition (approx. 209 million JPY) in the previous fiscal year (FY2026) resulting from a change in corporate classification for tax effect accounting. Excluding this, the plan represents a substantial real-term net income increase of +39.0% YoY . Q1 progress is at approximately 21% of the full-year forecast, which is considered very steady given the "H2-weighted" seasonality.
7.2 Strong Customer Base and High Stock Ratio
65% of the company's clients are listed companies or their subsidiaries , building a portfolio centered on large enterprises that are less susceptible to economic fluctuations. Furthermore, the business foundation is supported by high-quality metrics: stock revenue ratio of 64.4% , churn rate of 2.1% , upsell ratio of 35.6% , and cross-sell ratio of 15.0% .
Conclusion: Investor Perspective
Startline's Q1 FY2027 results demonstrate a successful balance between the strong tailwind of the increased statutory employment rate , the steady expansion of its stock-based business , and the proactive securing of new sites . While the significant Q1 profit growth includes front-loaded flow revenue, the growth in corporate clients (384) and supported individuals (2,611), combined with the 6-site opening plan for H2, indicates that progress toward full-year targets is extremely solid. Moving forward, the speed of new site launches and the penetration of high-value-added formats like "Diverse Village" will be key to further growth.
This content is not intended as investment advice or a recommendation. Any opinions expressed are solely the personal views of each article.