


Unite and Grow FY2026 Q2 Earnings Deep Dive: Analysis of Record-Breaking Performance and Strategic Shift Toward a 'Scale-Oriented' Growth Model

StockClub
Published: Aug 14, 2026, 11:15 AM
Sentiment Analysis

Unite and Grow FY2026 Q2 Earnings Deep Dive Report
Unite and Grow Inc. (Securities Code: 4486) delivered a robust performance for the second quarter of the fiscal year ending December 2026, with both net sales and operating profit reaching record highs for a first-half period. This success underscores the value of the company's proprietary "Shared Employee®" time-share service, which addresses the critical talent shortages and digital transformation (DX) challenges faced by small and medium-sized enterprises (SMEs).
This report extracts and analyzes key topics from the official earnings presentation materials across 10 sections, providing a systematic overview of current performance, future growth strategies, and the full scope of investment plans.
1. Q2 Earnings Highlights: Record-Breaking Net Sales and Operating Profit
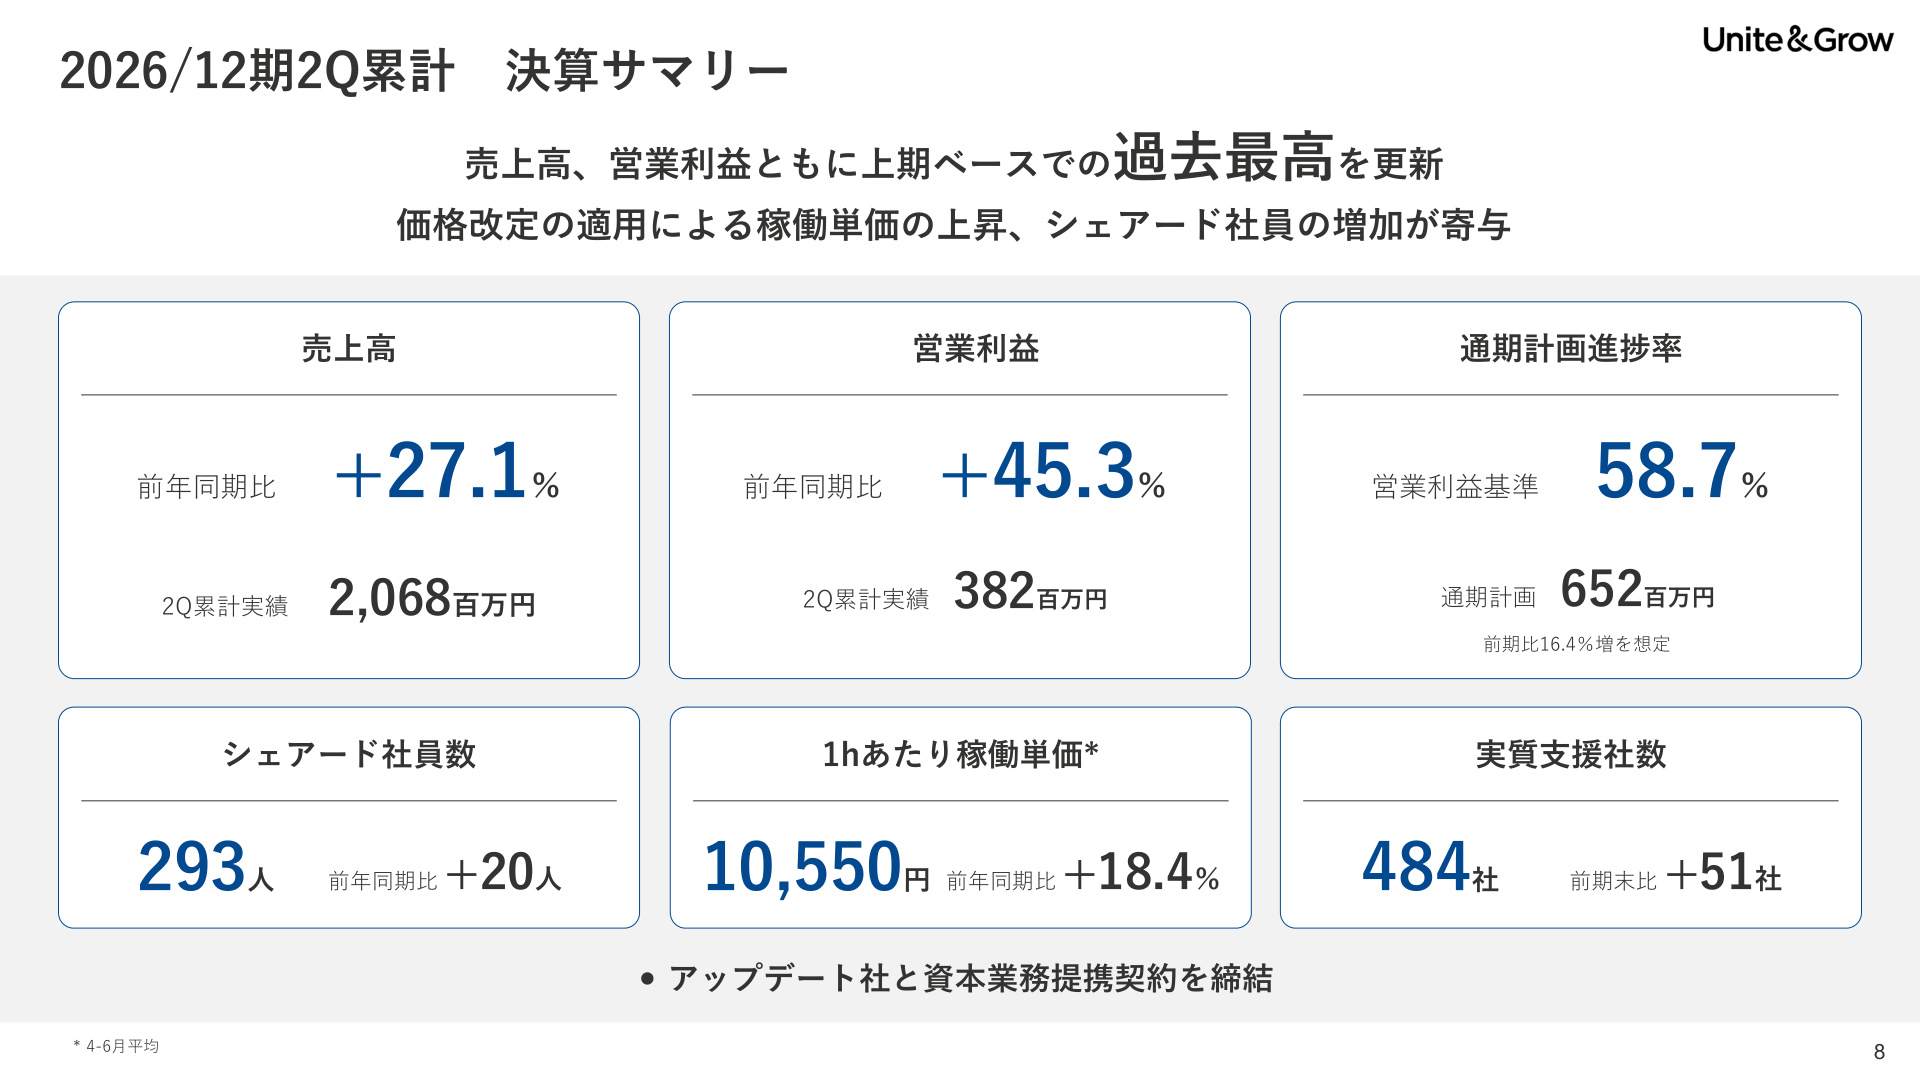
For the first half of the fiscal year ending December 2026, net sales reached 2,068 million yen (+27.1% YoY) , and operating profit hit 382 million yen (+45.3% YoY) , marking the highest first-half performance in the company's history.
The primary drivers of this growth were the increase in hourly billing rates resulting from price revisions for both existing and new clients, and the steady expansion of the Shared Employee headcount , which serves as the engine for service delivery.
[Significance and Background of the Slide Above]
The earnings summary above is a critical slide for grasping the overall picture of these results. It demonstrates that not only are the top-line and profit growth rates strong, but the key KPIs supporting them (Shared Employee headcount, hourly billing rates, and the number of companies supported) are all showing robust growth . Notably, the operating profit progress rate against the full-year plan has reached 58.7% , visually confirming that the company is on a very steady trajectory toward its initial full-year target (652 million yen).
2. Q2 Income Statement Analysis: Improved Gross Profit Margin and Profitability
A comparison of key items in the Income Statement (P/L) against the same period last year (H1 FY2025) reveals significant profit growth across all levels.
- Net Sales : 2,068 million yen ( +27.1% YoY , increase of +441 million yen)
- Gross Profit : 1,012 million yen ( +33.6% YoY , increase of +254 million yen)
- Gross Profit Margin : 48.9% ( +2.3pt YoY )
- Operating Profit : 382 million yen ( +45.3% YoY , increase of +119 million yen)
- Ordinary Profit : 384 million yen ( +45.2% YoY , increase of +119 million yen)
- Net Income : 283 million yen ( +45.8% YoY , increase of +89 million yen)
Despite an increase in SG&A expenses, including personnel costs, the improvement in the gross profit margin (from 46.6% to 48.9%) driven by higher billing rates more than absorbed the cost increases, leading to a substantial rise in operating profit.
3. Quarterly Performance Trends and the Diversification of "Specialized Services"
Focusing on quarterly net sales, the company has achieved five consecutive quarters of QoQ growth since Q2 of the fiscal year ending December 2025. In Q2 alone, net sales reached 1,072 million yen (+25.1% YoY) , maintaining a high growth pace.
A notable qualitative shift in the revenue structure is the differentiation and expansion of "Specialized Services" built upon the core "General IT Department" service:
- In-house Development : Support for internal system development using low-code tools (Q2 sales: 55 million yen)
- IT Infrastructure : Construction and maintenance of servers, networks, etc. (Q2 sales: 58 million yen)
- Accounting IT : Building IT foundations for core business operations such as accounting and management (Q2 sales: 54 million yen)
The sales ratio of these specialized services has risen to 16% of the total as of Q2 , meeting diversified customer needs and acting as a driver for higher unit prices. The slight decline in Q2 operating profit (165 million yen) compared to Q1 (216 million yen) is due to seasonal factors , such as a temporary dip in average unit prices and increased personnel costs following the intake of new employees.
4. Business KPI Trends (1): Surge in Shared Employee Headcount and Billing Rates
The most important KPIs supporting the company's expansion are the "Shared Employee headcount" and "hourly billing rate."
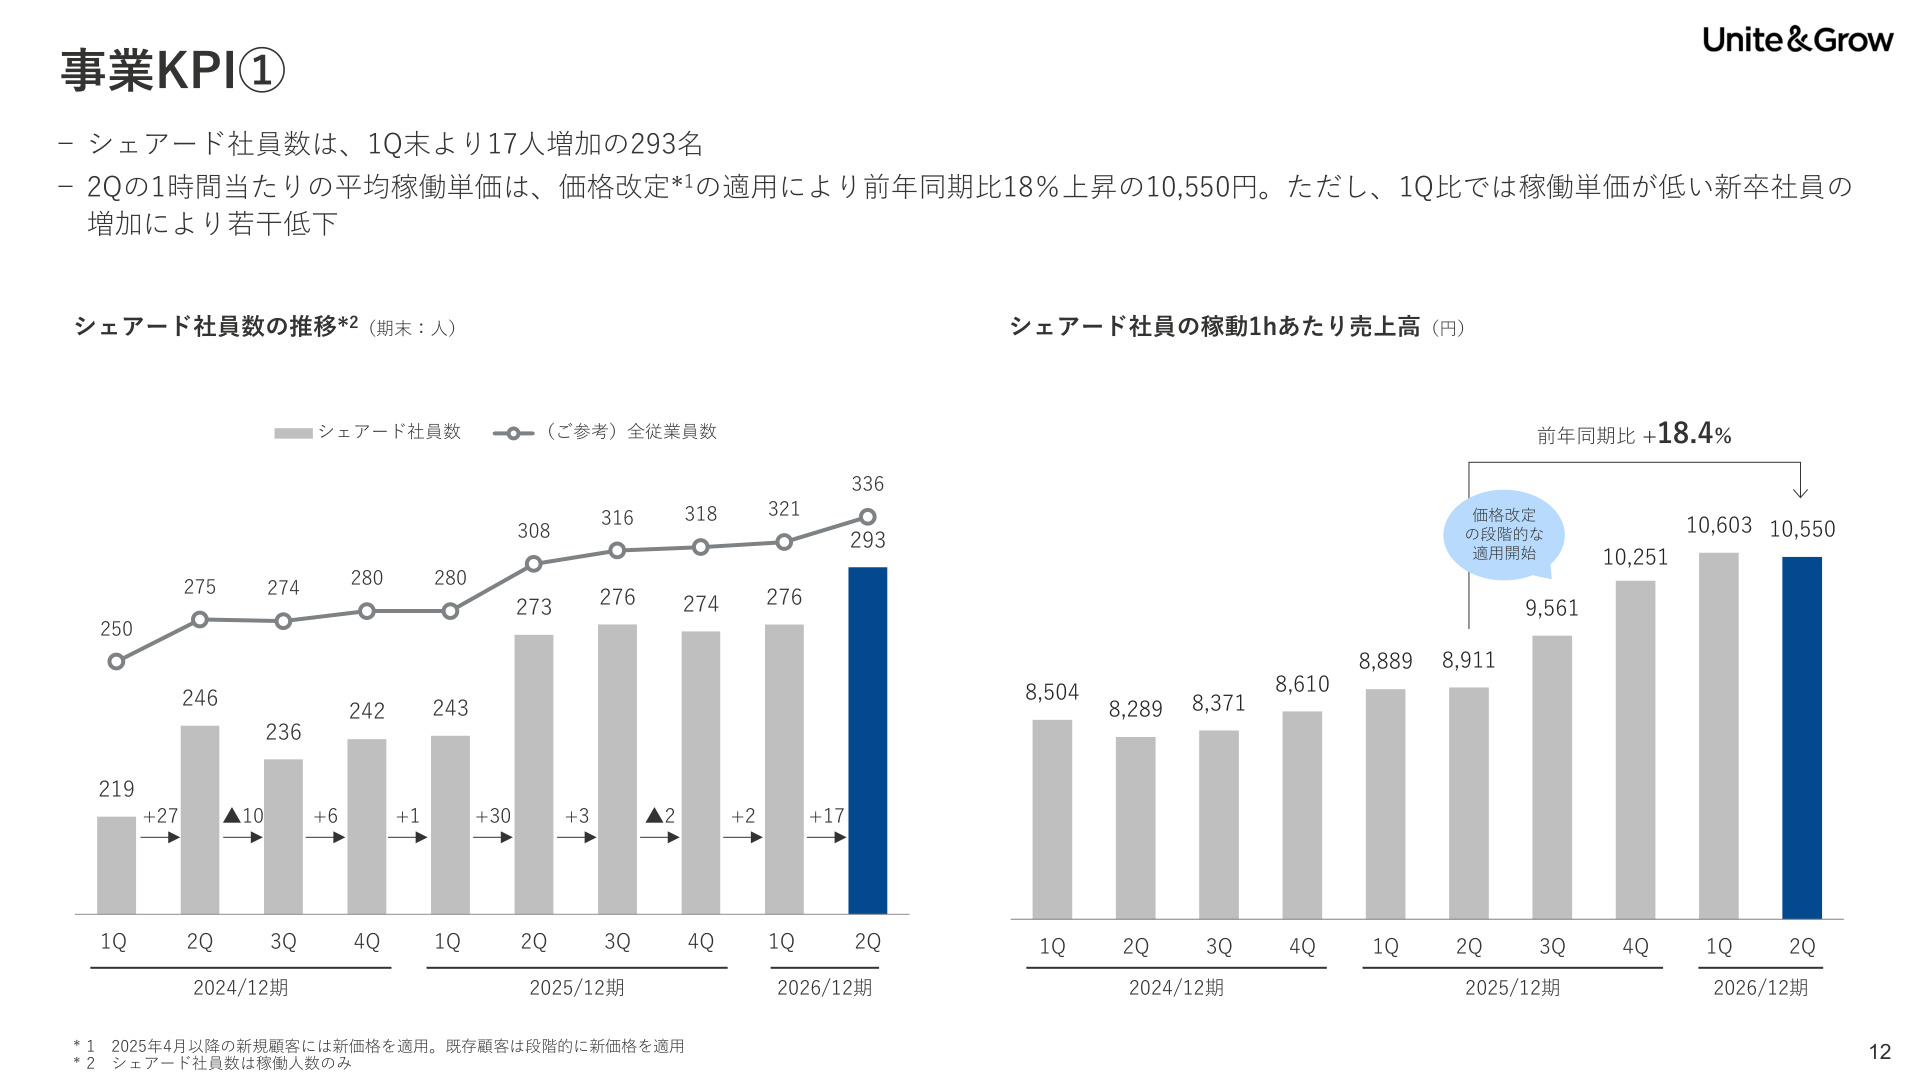
- Shared Employee Headcount : 293 as of the end of June 2026 (+17 from end of Q1, +20 YoY)
- Average Hourly Billing Rate : 10,550 yen in Q2 (+18.4% YoY)
[Significance and Background of the Slide Above]
This slide presents the historical trend of business KPIs (headcount and unit price) , proving the process by which the company's growth scenario is coming to fruition. In particular, as shown in the graph on the right, the 18.4% surge in the hourly billing rate from 8,911 yen to 10,550 yen is the highlight of these earnings. It is clear that the price revisions for new clients starting in April 2025 and the gradual implementation of revisions for existing clients have brought about a significant improvement in profitability.
5. Business KPI Trends (2): Stable Trends in Supported Companies, Utilization, and Retention
Solid figures are also being maintained regarding the customer base and human resources.
- Number of Companies Supported : 484 (+51 from previous fiscal year-end, +6 from end of Q1)
- Utilization Rate : 65.2% (Down 1.5pt from Q1, but remaining within the company's optimal range of around 70% )
- Retention Rate : 90.5% (as of Q2 FY2026)
- Gender Ratio : 61.1% Male, 38.9% Female
Although the intake of new graduates has caused a temporary, minor impact on the utilization rate and average unit price, these figures remain within the scope of sustainable operations. Furthermore, the high retention rate (90.5%) demonstrates a strong competitive advantage in an industry characterized by high IT talent mobility.
6. Operating Profit Variance Analysis: Strong Positive Impact from Price Revisions and Skill Upgrades
The breakdown of the operating profit increase from the previous year (263 million yen) to the current period (382 million yen) for a +119 million yen gain is as follows:
- Billing Rate Change : +328 million yen (Significant positive impact from price revisions and employee skill upgrades)
- Shared Employee Headcount Change : +77 million yen (Business scale effect from personnel expansion)
- Cost of Sales/Personnel/Unit Price Change : -126 million yen (Increase in costs due to salary hikes and higher compensation levels)
- Personnel Expenses (SG&A) : -73 million yen (Increase in non-billable time and back-office personnel costs)
- Recruitment and Other Expenses : -62 million yen (Increased spending on recruitment activities for future growth)
- Working Hours Change : -25 million yen
The total cost increase (-286 million yen) , including personnel and upfront investment, was outweighed by the total gain from higher unit prices and headcount (+405 million yen) , resulting in a substantial increase in operating profit.
7. FY2026 Full-Year and Second-Half Outlook: Maintaining Plan and Aggressive Investment
The full-year earnings forecast remains unchanged from the initial plan.
- Net Sales : 4,114 million yen (+17.1% YoY)
- Operating Profit : 652 million yen (+16.4% YoY, Operating Margin 16.0%)
- Net Income : 485 million yen (+18.2% YoY)
Characteristics and Strategic Background of the Second-Half Outlook
Compared to the first half (2,068 million yen in sales, 382 million yen in operating profit), the second-half outlook projects 2,045 million yen in sales and 269 million yen in operating profit , incorporating a YoY increase in sales but a decrease in profit. This does not signify a slowdown in performance; rather, it reflects the conservative yet aggressive allocation of funds toward capital investment, recruitment, training, and branding for strategic growth . The plan aims to solidify the growth foundation and achieve sustainable growth with a Compound Annual Growth Rate (CAGR) of 15% .
8. Shareholder Returns and Capital Allocation Policy
The company maintains a policy of balancing the allocation of generated cash between business investment and shareholder returns.
- FY2026 Dividend Forecast : 16 yen per share (A 3-yen increase from the previous year's ordinary dividend of 13 yen)
- Return Metrics : Targeting a payout ratio of 30% or a Dividend on Equity (DOE) of 5%
- Use of Funds : Sourced from operating cash flow, funds are prioritized for growth investments —including system investment, human capital investment, and LP investment/M&A—in addition to dividend payments.
9. Redefining Positioning: Shifting from "Natural Growth" to a "Scale-Oriented Enterprise"
Supported by high profitability and customer satisfaction—with a client retention rate of around 80% and 100% inbound orders—the company has achieved a CAGR of 16.5% (since 2010) through "natural growth." However, the business environment surrounding corporate IT is changing rapidly, driven by the expansion of IT governance needs due to AI evolution and system restructuring (IT separation/integration) needs following M&A activities among SMEs .
Capitalizing on these tailwinds, the company has declared a shift in its stage: moving from a "Tokyo-centric, naturally growing company" to a "Scale-oriented enterprise that is conscious of capturing the Total Addressable Market (TAM) and expanding value delivery to SMEs nationwide."
10. Growth Strategy: Decomposition of Revenue Components and Aggressive Investment Plan
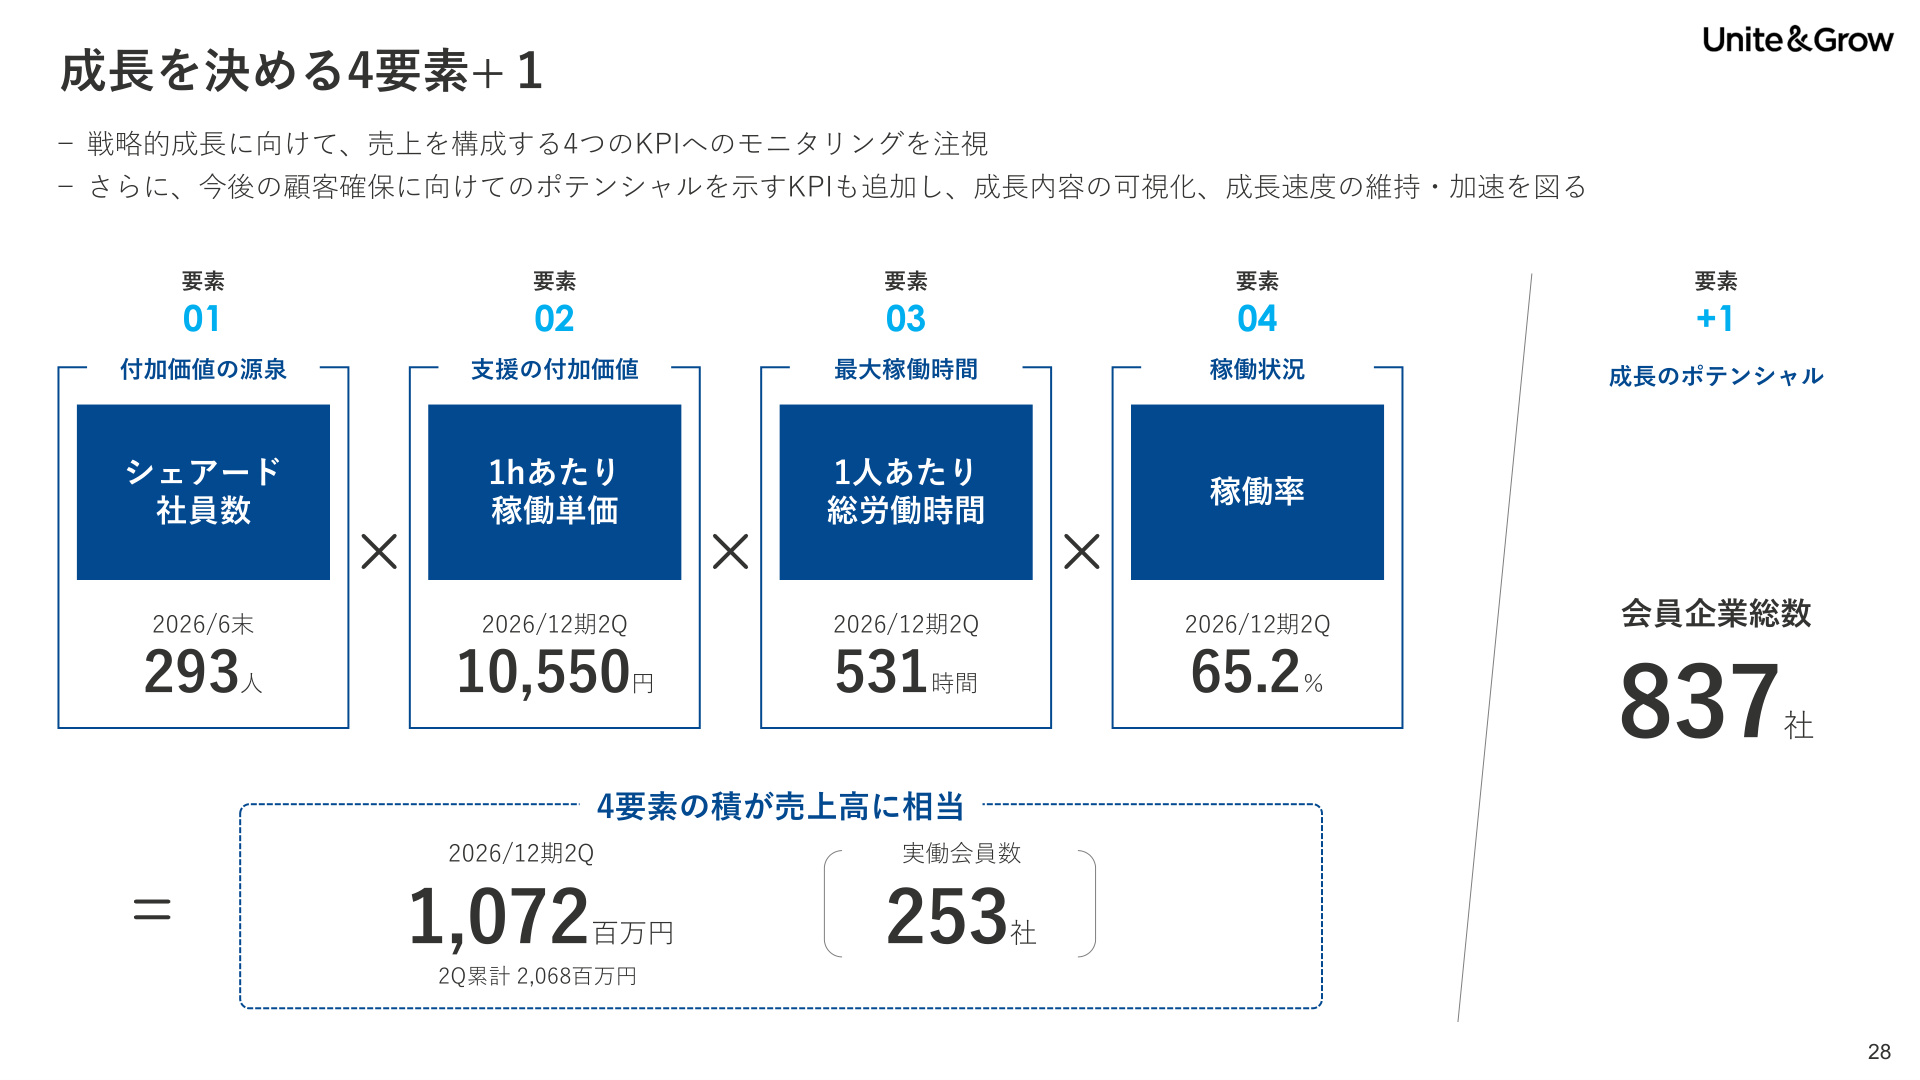
To scale the business, the company visualizes and monitors the components of its net sales:
$$\text{Net Sales} = \text{Shared Employee Headcount} \times \text{Hourly Billing Rate} \times \text{Total Working Hours per Person} \times \text{Utilization Rate}$$
[Significance and Background of the Slide Above]
This slide models the company's business model and growth equation in an extremely concise and clear manner. By decomposing net sales into these "four components," the company positions metrics with physical upper limits (working hours and utilization rate) as "Sustainability KPIs (risk management indicators)" and defines "Shared Employee Headcount" and "Hourly Billing Rate" as the two "Growth Drivers (indicators to be increased)." This logical framework clarifies where the company should concentrate its resources.
Future Recruitment and Branding Investment Policy
To increase the "Shared Employee headcount"—a key growth driver—the company has set a growth target of a 12% annual increase in headcount . To achieve this, it plans to invest 600 million yen in recruitment and branding over the next three years , actively promoting the strengthening of new graduate and mid-career hiring and enhancing corporate awareness.
Summary
Unite and Grow's Q2 FY2026 earnings were highly robust, achieving record-breaking results through the success of price revisions (higher unit prices) and steady personnel growth . Beyond mere strong performance, the company is executing a clear strategic shift from "natural growth" to a "scale-oriented" model by reinvesting its high profits into future recruitment, branding, and system infrastructure. Under clear KPI management, the company's growth story—expanding its approach to the SME market nationwide—is progressing steadily.
This content is not intended as investment advice or a recommendation. Any opinions expressed are solely the personal views of each article.