


Yappli, Inc. FY2026 Q2 Earnings Deep Dive: Record-High Revenue and Operating Profit Driven by Multi-Product Strategy and HR Solutions

StockClub
Published: Aug 14, 2026, 10:53 AM
Sentiment Analysis

Yappli, Inc. FY2026 Q2 Earnings Deep Dive Report
Yappli, Inc. (Securities Code: 4168), the provider of the app development platform "Yappli," delivered a robust performance in its cumulative Q2 results for the fiscal year ending December 2026 , achieving record highs across revenue, gross profit, and operating profit. Notably, operating profit saw a significant year-on-year increase, highlighting a marked improvement in profitability.
This report provides a comprehensive analysis of the company's latest performance, key KPI trends, cost structure, progress by solution, and mid-to-long-term growth strategies—including AI integration—based on 10 key topics identified from the earnings materials.
1. Earnings Highlights: Record-High Revenue and Operating Profit
For the cumulative Q2 (Q1-Q2) of the fiscal year ending December 2026, consolidated results showed revenue of 3.376 billion JPY (+15.7% YoY) and operating profit of 649 million JPY (+44.6% YoY) , marking a significant increase in both top and bottom lines. Ordinary profit reached 637 million JPY (+41.8% YoY), and net profit attributable to owners of the parent company stood at 636 million JPY (+42.7% YoY), all demonstrating strong growth rates.
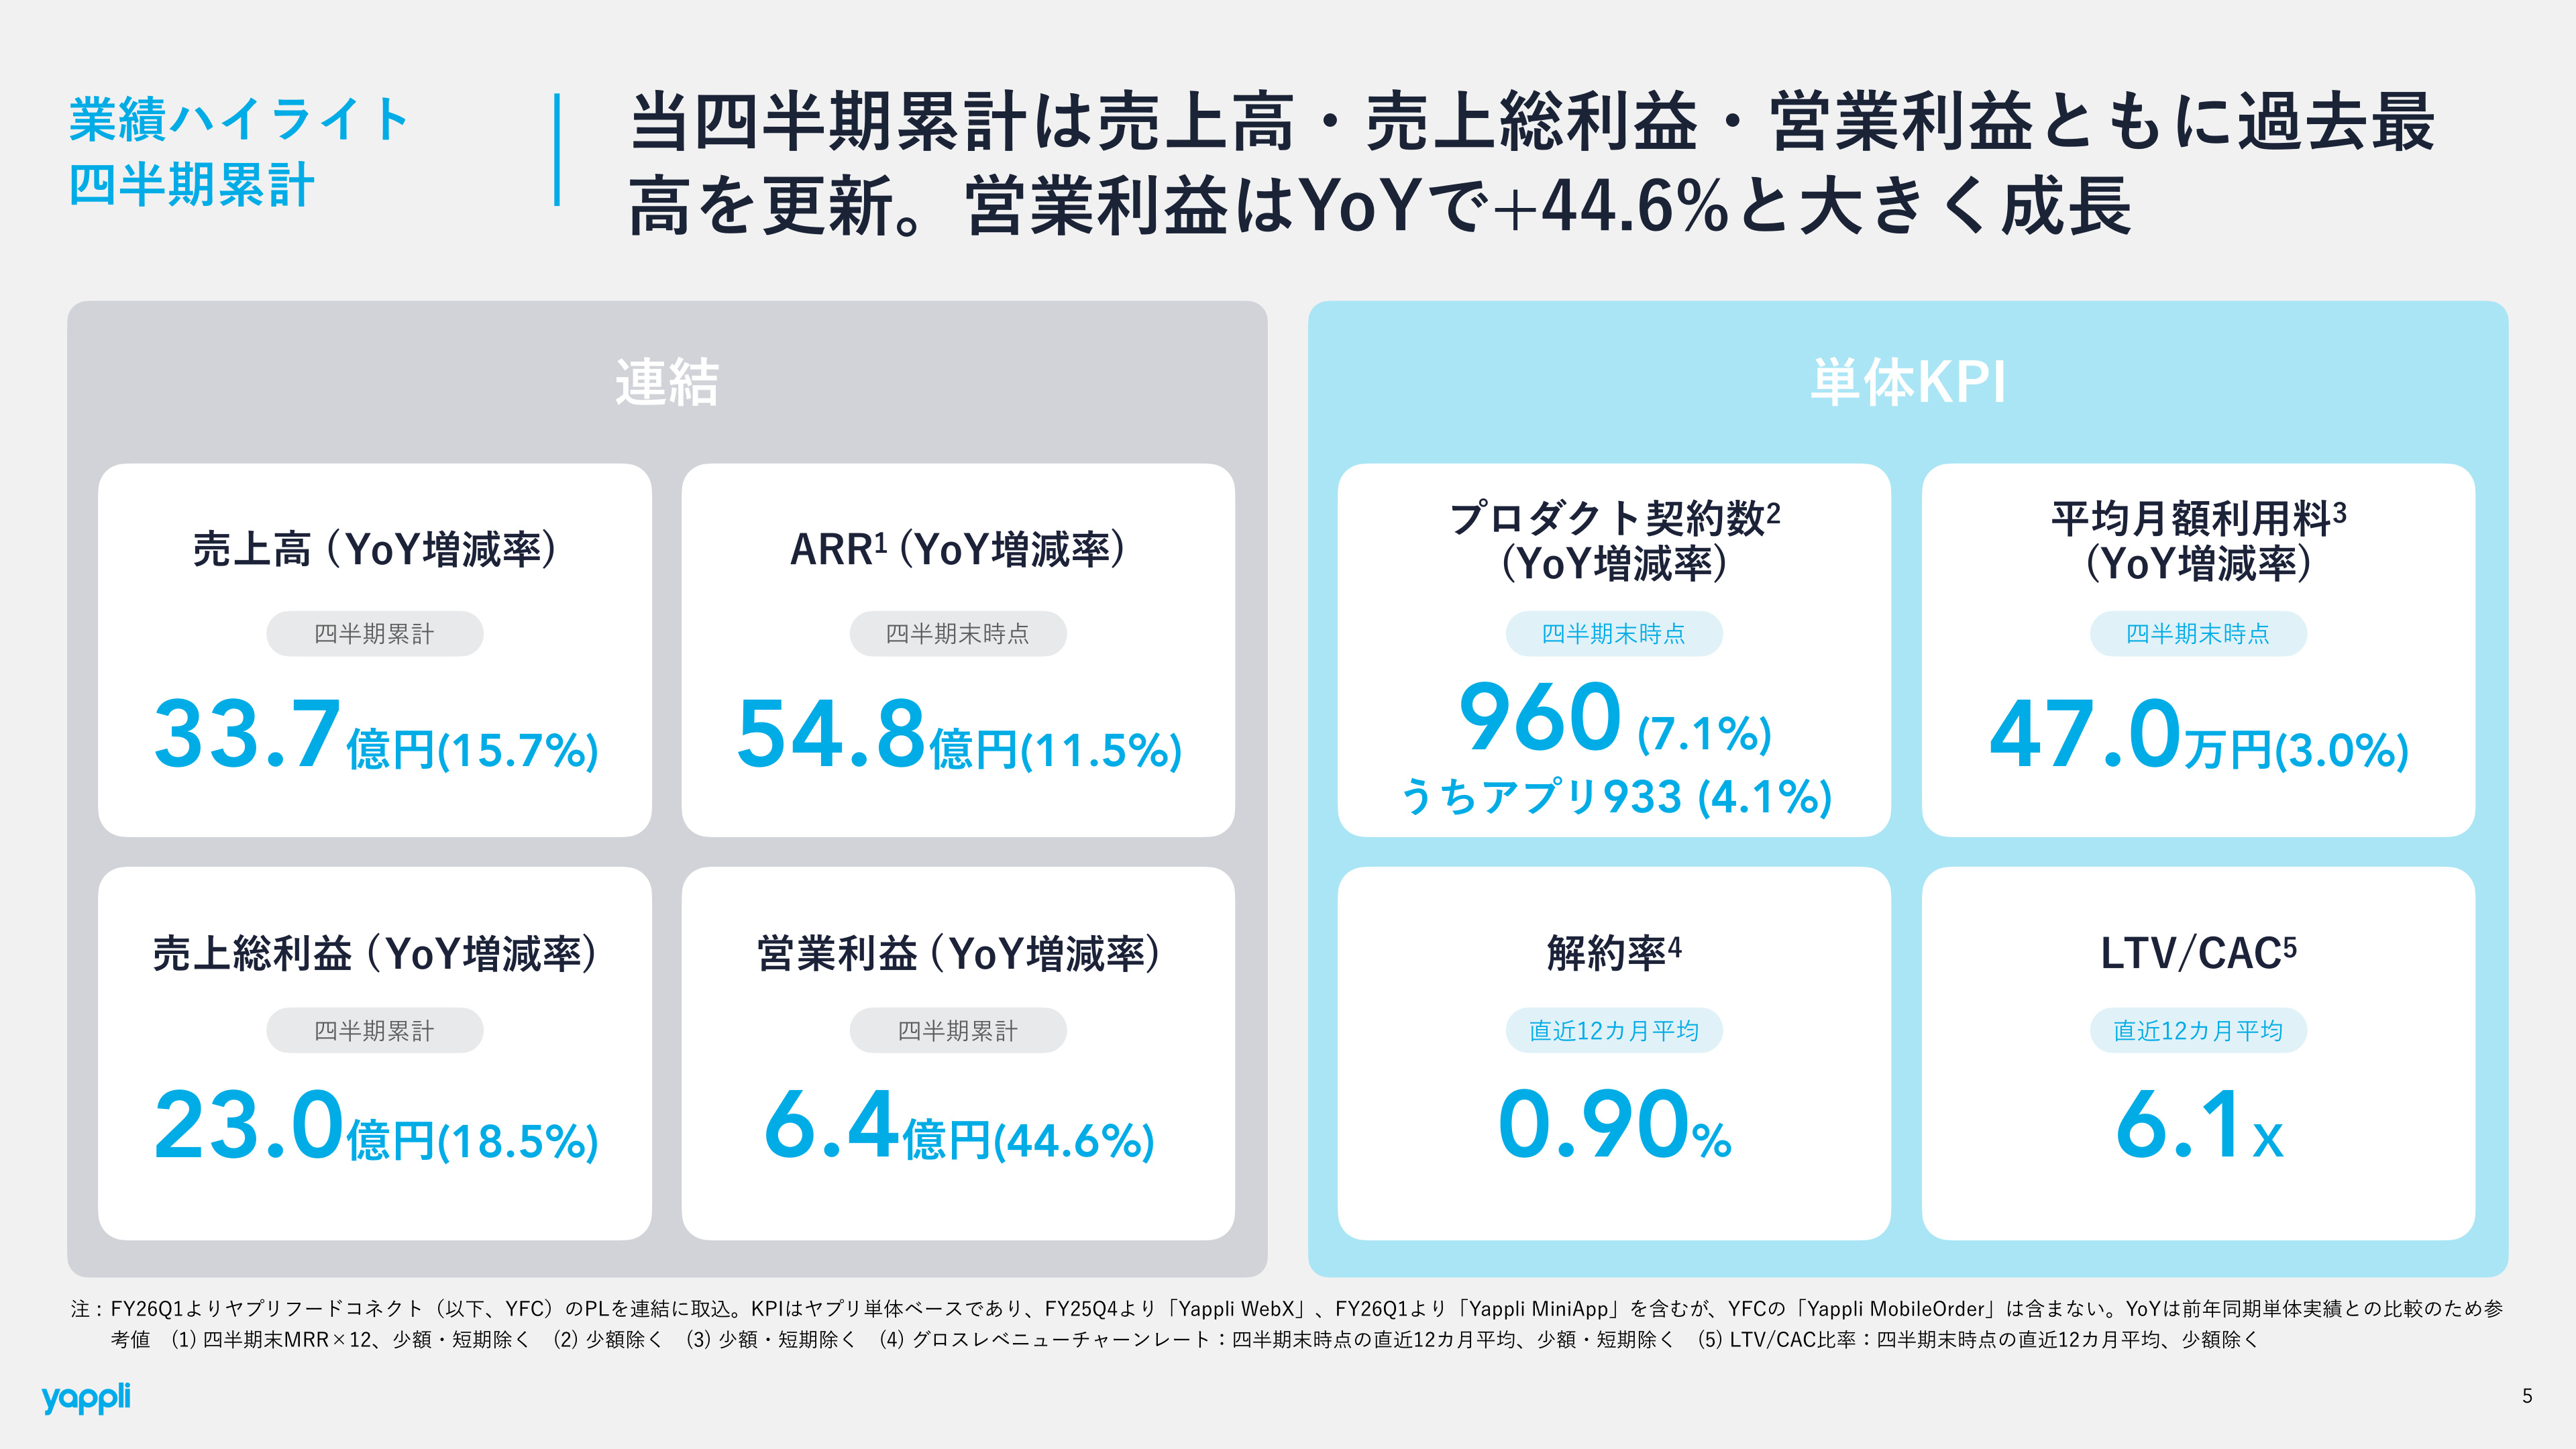
The earnings highlights slide above (PAGE 4) summarizes the critical metrics that define this period's strong performance. While revenue and gross profit maintained double-digit growth, the 44.6% growth in operating profit clearly illustrates the improvement in operating profit margin (expanding by 3.8pt from 15.4% in the same period last year to 19.2%) as revenue scales. Furthermore, it confirms that ARR, representing the scale of recurring revenue, has steadily grown to 5.48 billion JPY (+11.5% YoY) , and unit economics such as churn rate and LTV/CAC remain at healthy levels.
2. Progress Against Full-Year Forecasts: Significant Outperformance in Profitability
Progress against full-year earnings forecasts is proceeding smoothly and at a pace exceeding initial plans:
- Revenue Progress Rate : 49.7% (3.376 billion JPY against a full-year forecast of 6.80 billion JPY / 47.0% in the same period last year)
- Operating Profit Progress Rate : 65.0% (649 million JPY against a full-year forecast of 1.00 billion JPY / 59.9% in the same period last year)
- Net Profit Attributable to Owners of Parent Progress Rate : 68.4% (636 million JPY against a full-year forecast of 930 million JPY / 61.1% in the same period last year)
- Adjusted EBITDA Progress Rate : 61.6% (677 million JPY against a full-year forecast of 1.10 billion JPY / 59.0% in the same period last year)
While revenue is tracking largely in line with plans when considering seasonality (a tendency toward second-half weighting), profit items have already exceeded 60% progress by the end of the first half , clearly outpacing the progress rate of the previous year. This is a positive sign indicating the stabilization of the revenue base and progress in cost efficiency.
3. Revenue Structure and Growth of Stock Business (PF vs. PS Revenue)
The company's revenue consists of PF revenue (Platform revenue: recurring stock income) , primarily from monthly subscription fees, and PS revenue (Professional Services revenue: one-time/spot income) , associated with production support, implementation, and growth consulting.
Q2 standalone revenue was 1.668 billion JPY (+12.5% YoY). Of this, the stock-based PF revenue was 1.364 billion JPY (+12.0% YoY) , showing steady accumulation. Meanwhile, PS revenue reached 340 million JPY (+14.5% YoY) , also recording double-digit growth. Active demand for spot implementation projects and app upgrades contributed to the overall top-line growth.
4. Key Standalone KPI Analysis: Trends in Product Contracts and ARPU
Looking at the standalone KPIs that drive Yappli's growth, it is evident that both the introduction of new products and the improvement in unit prices are functioning effectively.
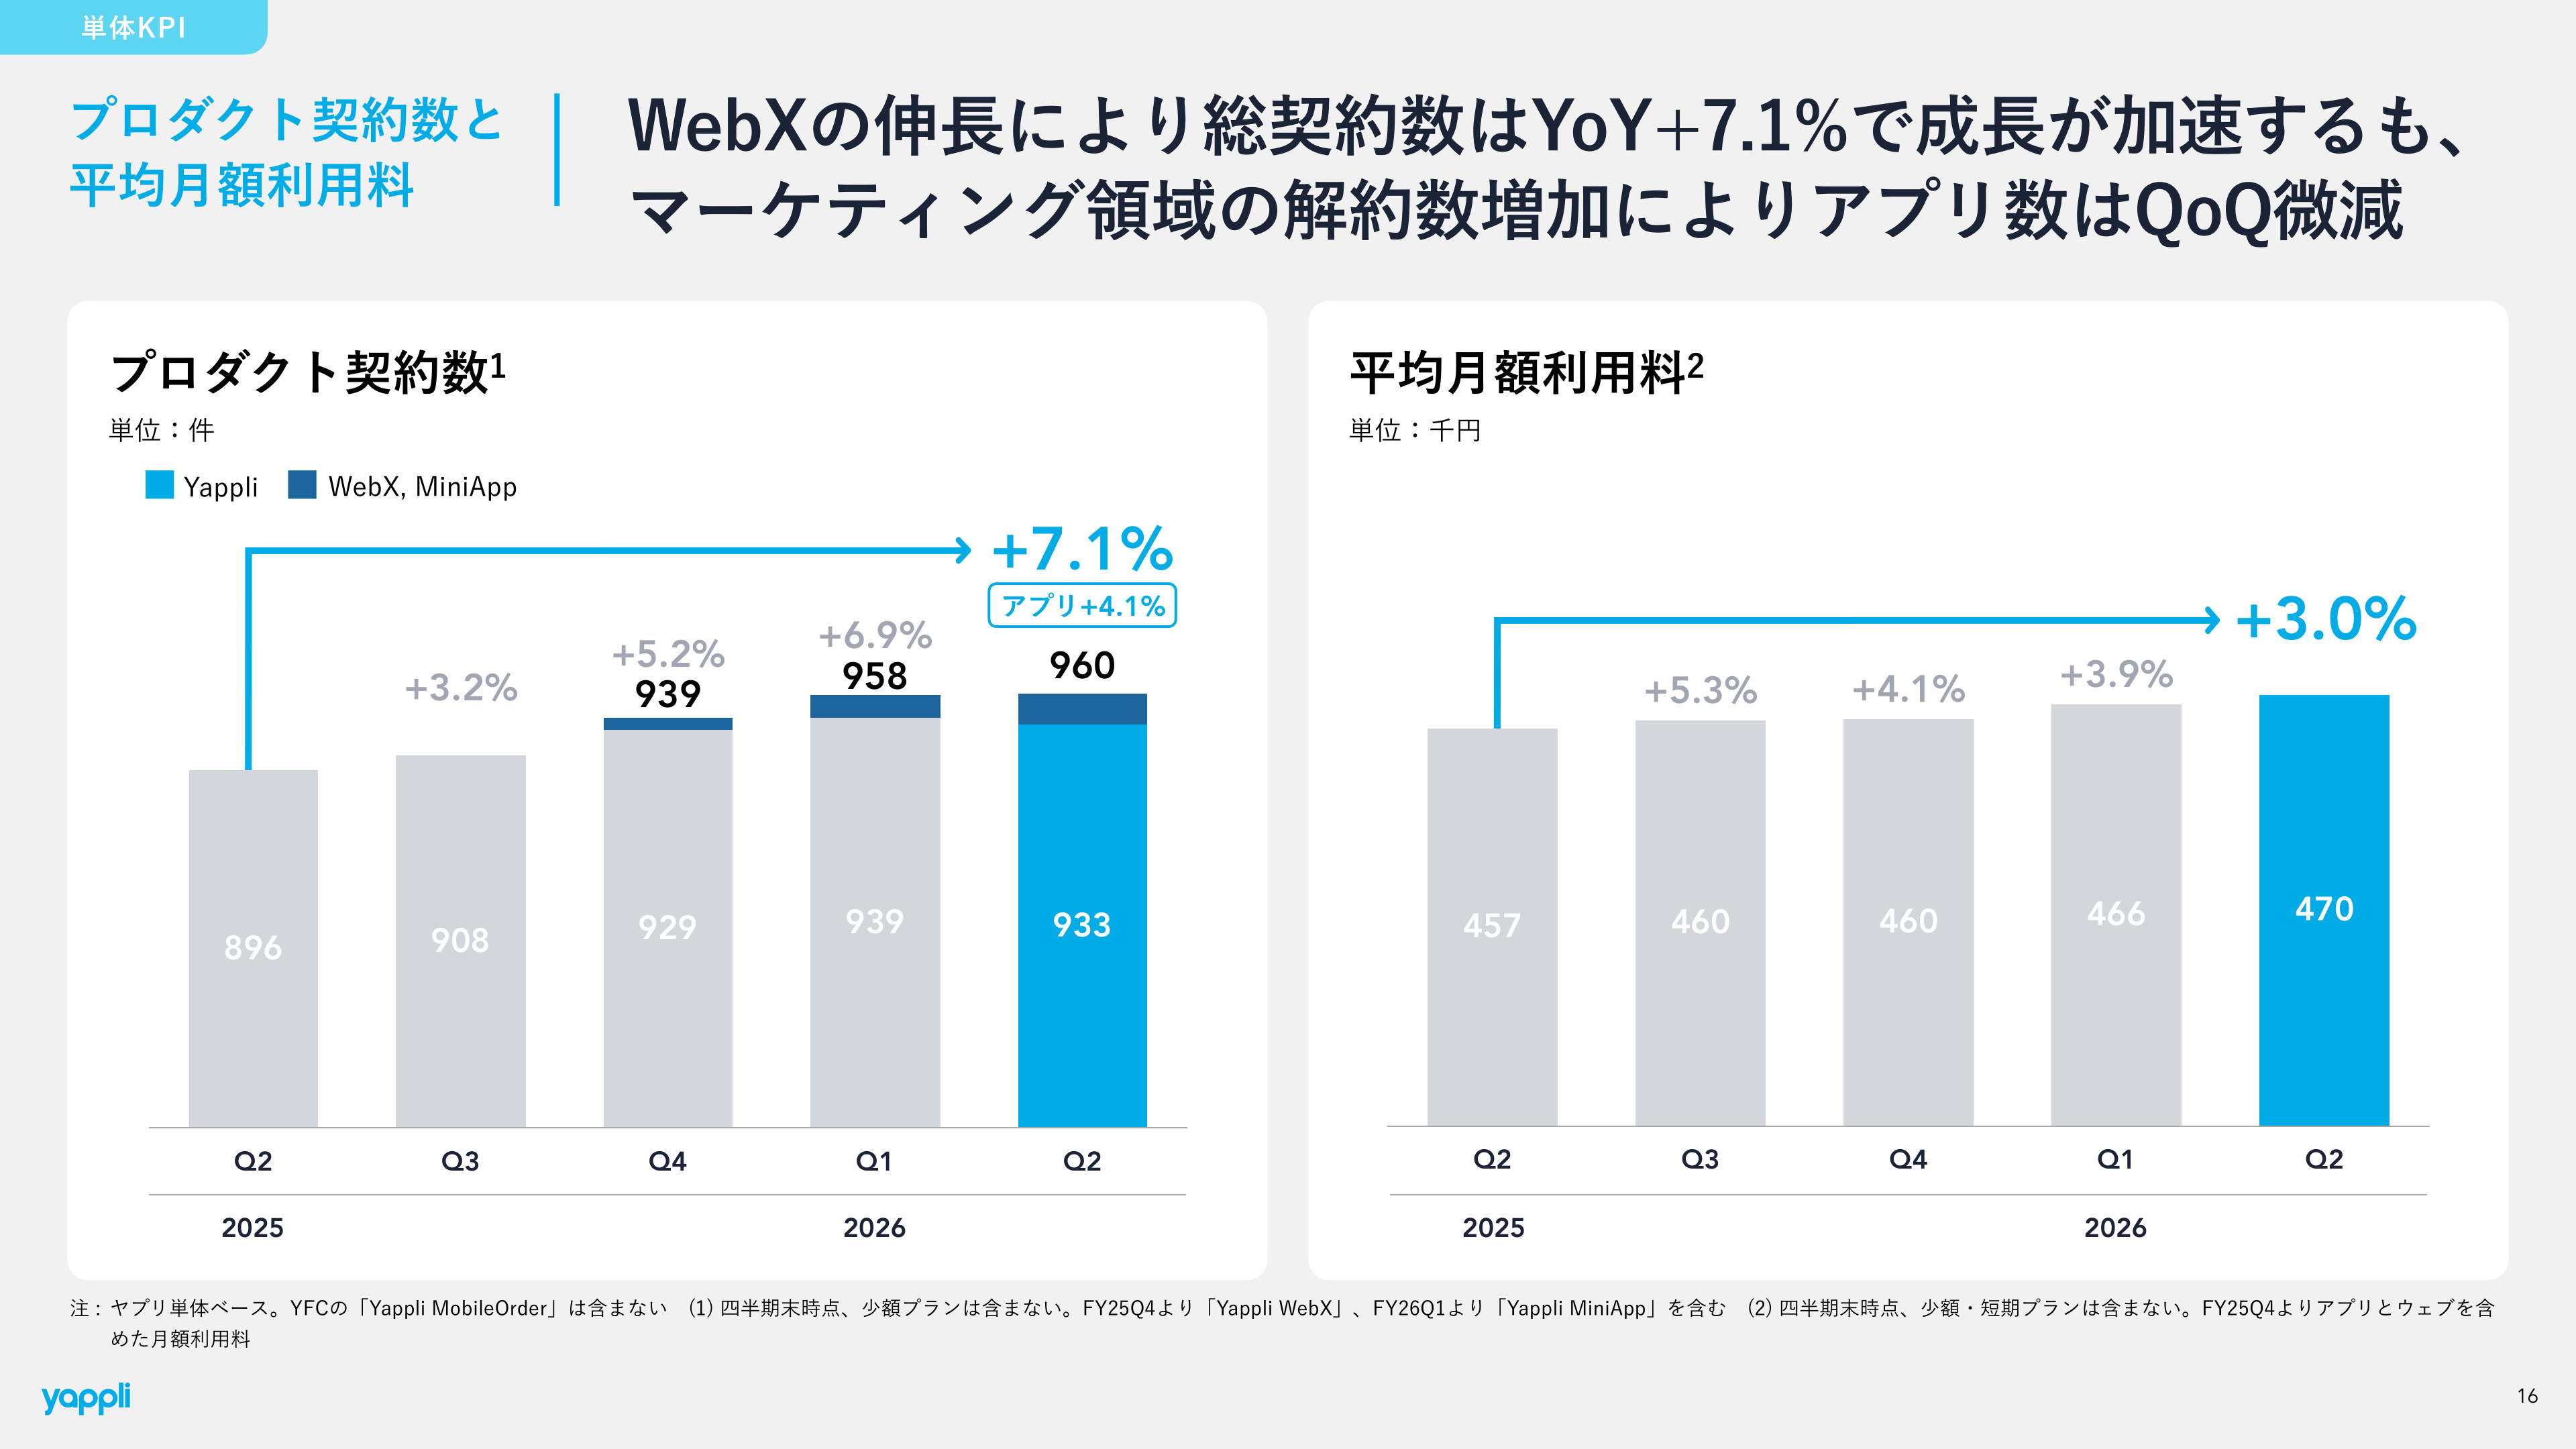
The slide above (PAGE 15) shows the trends in "Product Contracts" and "Average Monthly Subscription Fee (ARPU)," the sources of Yappli's top-line growth. Product contracts increased to 960 (+7.1% YoY) . Notably, while the core product "Yappli (App)" saw a stable trend with 933 contracts (+4.1% YoY), the acquisition of multi-product contracts , such as the web products "Yappli WebX" and "Yappli MiniApp," is accelerating the growth of total contracts.
Additionally, the Average Monthly Subscription Fee (ARPU) continues to trend upward at 470,000 JPY (+3.0% YoY) . This reflects the increase in high-value new contracts and the success of cross-selling and up-selling multiple products.
5. Transformation of Solution Mix: Rapid Growth in the HR Sector "UNITE"
A breakdown of product introductions reveals a clear diversification in customer segments and use cases.
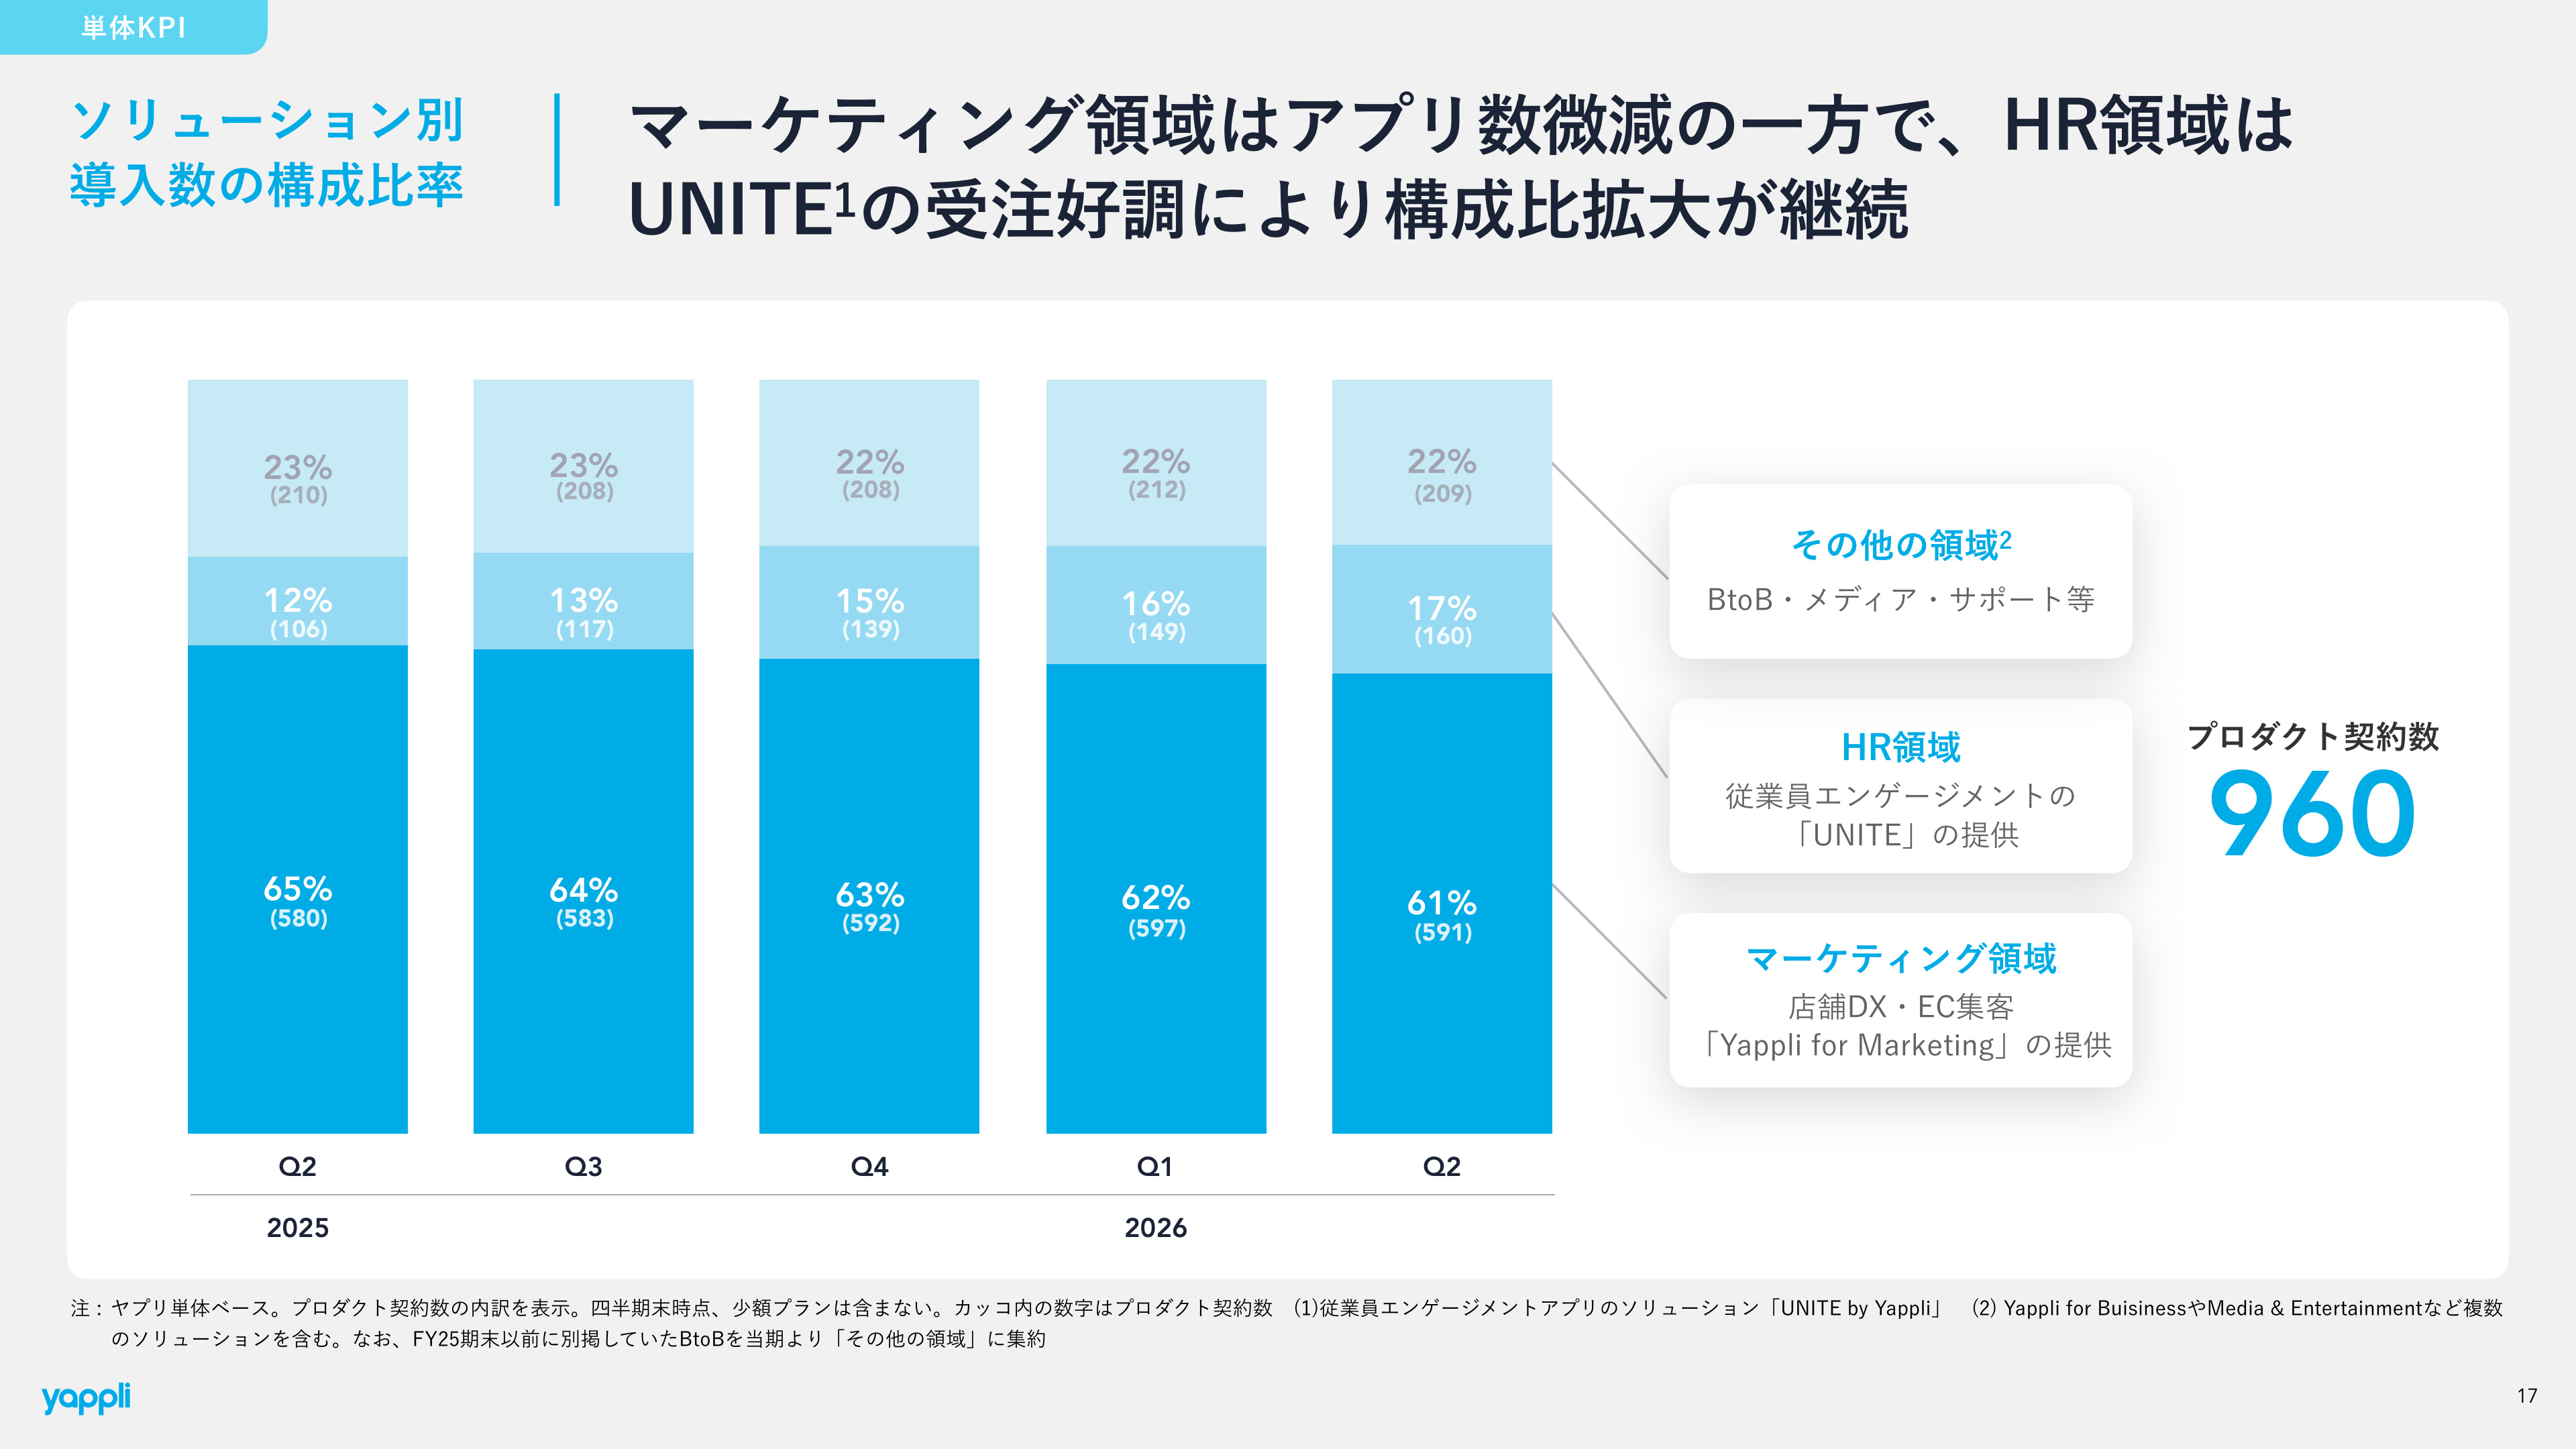
According to the slide above (PAGE 16) showing the composition by solution, the "Marketing Sector (Yappli for Marketing)," centered on store DX and EC customer acquisition, still accounts for the majority at 61% (591 contracts) , though its share is gradually declining (65% in the same period last year).
Conversely, the internal app solution for enhancing employee engagement, "HR Sector (UNITE by Yappli)," has steadily expanded to a 17% share (160 contracts) (up from 12% in the same period last year). "UNITE" is seeing a surge in demand as a tool to strengthen internal communication and learning experiences for "non-desk workers," such as factory staff in manufacturing and retail store employees. This is helping the company establish a position as corporate infrastructure rather than just a promotional tool.
6. Unit Economics: Health of Churn Rate and LTV/CAC
The churn rate (12-month average gross revenue churn rate) , the most important metric for measuring the health of a SaaS business, was 0.90% . Although this is a slight increase from the previous quarter (0.86%) due to some churn in the marketing sector, it firmly maintains the "under 1.0%" level that the company sets as a key benchmark.
Furthermore, the LTV/CAC (Lifetime Value / Customer Acquisition Cost) ratio was 6.1x . This remains well above the 3.0x level generally considered a benchmark for health in the SaaS industry, proving that the company is generating very high returns on its marketing and sales investments.
7. Cost Structure and Investment Strategy: Trends in Advertising and Personnel Expenses
In the structure of SG&A expenses and cost of sales, a disciplined investment strategy is evident:
- Gross Profit Margin : The Q2 standalone gross profit margin was 66.7% . The QoQ decline from Q1 (69.8%) was temporarily impacted by changes in the ratio of one-time PS revenue and increased costs associated with office expansions across all locations.
- Advertising Expenses : The company reallocated advertising investments that were focused in Q1 toward Q2, spending 187 million JPY primarily on exhibiting at large-scale trade shows. The plan is to continue marketing investments at the same level as Q2 in the second half to strengthen lead acquisition.
- Number of Full-time Employees and Personnel Expenses : The number of full-time group employees increased by 7 from the end of the previous fiscal year to a 301-person structure . The company continues to invest in strengthening organizational capabilities such as R&D and Customer Success, with Q2 personnel expenses reaching 570 million JPY (+9.9% YoY).
8. Human Capital and Facility Investment: Office Expansion and Relocation Across All 3 Locations
To aim for organizational expansion, improved employee engagement, and the maximization of group synergies, investments in human capital and facilities are being actively pursued:
- Tokyo Headquarters : Expanded office space in June 2026 to revitalize internal communication.
- Fukuoka Branch : Relocated to "CIC Fukuoka," directly connected to Tenjin Station, in May 2026 to maximize group synergies.
- Osaka Branch : Expanded office space in August 2026 to accommodate personnel growth.
These investments across all locations are part of building a robust infrastructure to support future business expansion.
9. Evolution of Product Alliances: Surpassing 300 Million Cumulative Downloads and LINE Yahoo Partnership
Important topics regarding market penetration and external partnerships have also been reported:
- Surpassing 300 Million Cumulative Downloads : The cumulative number of downloads for apps created with Yappli has surpassed 300 million in 13 years since its founding. Monthly Active Users (MAU) have reached 44 million, and annual viewing time has reached approximately 110 million hours, driven particularly by payments and mobile ordering in the food and beverage sector.
- LINE Yahoo "Technology Partner" Certification : The company was certified as a "Technology Partner" in the LINE Mini App category by LINE Yahoo. This significantly enhances the company's competitive edge in supporting corporate DX and strengthening customer touchpoints using LINE, which is expected to lead to new project acquisitions and expanded proposal opportunities for existing clients.
- Strengthening Enterprise Features : Independently developed a "SAML Authentication Infrastructure" to support multi-channel operations for large enterprises. This is expected to reduce implementation costs for the enterprise segment, which has high security requirements, by up to 80%.
10. Full-Scale AI Strategy: Advancing App Operations and Digital Experiences
The company is responding rapidly to the social implementation of AI technology, expanding and pilot-testing AI features in three main areas:
- User Experience AI : Provides an "AI Summary Function" that summarizes e-books and long-form content within apps, increasing the efficiency of user information consumption.
- App Operation Support AI : Began pilot-testing "AI Playground," a suite of tools that automates and streamlines tasks for operators, such as drafting push notifications and generating icons.
- Web Operation AI : Equipped the multi-product "Yappli WebX" with an AI multilingual automatic translation function, significantly reducing the man-hours required for operating global websites in English, Chinese, and other languages.
Summary and Outlook
In the second quarter of the fiscal year ending December 2026, Yappli achieved record-high revenue and profit, driven by stable stock revenue from its core "Yappli" app-building platform, as well as horizontal expansion into the HR sector represented by "UNITE" and multi-product offerings such as "Yappli WebX."
As indicated by the high LTV/CAC ratio (6.1x) and low churn rate (0.90%), the company is maintaining extremely healthy unit economics while steadily executing investments for future growth, such as advertising, office expansion, and AI feature implementation. Including the high progress rate against full-year profit targets (65.0% operating profit progress), the business foundation for the second half can be evaluated as extremely solid.
This content is not intended as investment advice or a recommendation. Any opinions expressed are solely the personal views of each article.