


Minoya Co., Ltd. FY2026 Financial Results Report: Record-High Sales Achieved; Focus Shifts to Structural Reform for Profitability and Enhanced Shareholder Returns

StockClub
Published: Aug 14, 2026, 10:33 AM
Sentiment Analysis

Minoya Co., Ltd. (Securities Code: 386A), the operator of the confectionery specialty store chain " Okashi no Machioka ," has announced its financial results for the fiscal year ended June 2026. This report provides a detailed analysis of the company's performance highlights, profit structure, future growth strategies, and shareholder return policies based on the latest financial disclosures.
1. FY2026 Financial Summary and Key Topics
In the fiscal year ended June 2026, Minoya achieved record-high sales of 25.666 billion yen (up 6.9% YoY) , driven by new store openings and an increase in average customer spend. However, profit figures fell short of initial projections due to sluggish sales at some newly opened stores, intensifying competition, and rising costs, including labor and property expenses.
Key highlights are as follows:
- Net Sales : 25.666 billion yen (+6.9% YoY), marking a record high.
- Operating Profit : 673 million yen (-0.8% YoY).
- Ordinary Profit : 735 million yen (-3.8% YoY).
- Net Profit : 200 million yen (-50.5% YoY). This was significantly impacted by an impairment loss of 209 million yen recorded as an extraordinary loss for underperforming stores.
- Number of Stores : 220 stores at year-end (16 new openings, 4 closures; net increase of 12).
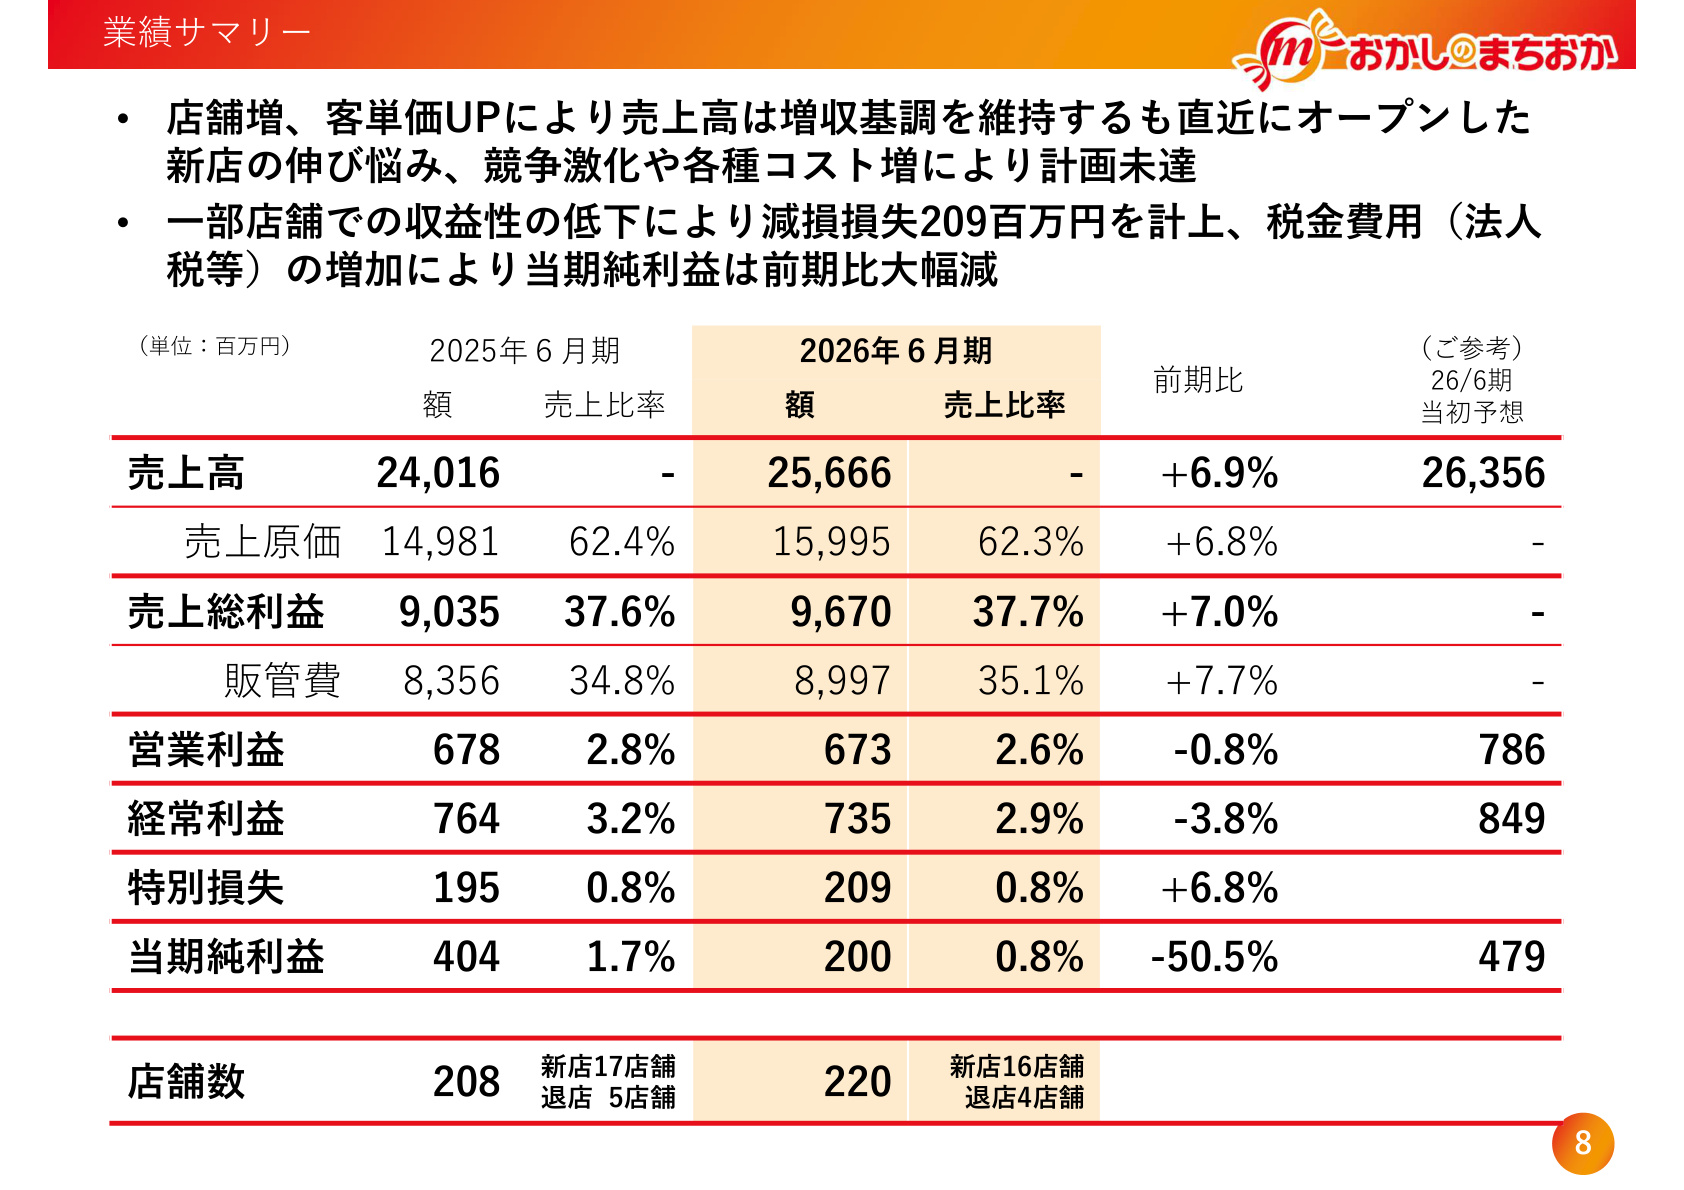
[Explanation and Significance of Slide 7]
The income statement summary above outlines the FY2026 performance, year-on-year comparisons, and variances from initial forecasts. The most critical takeaway is the impact of the extraordinary loss on the "higher sales, lower profit" result. While sales grew steadily by 6.9%, operating and ordinary profits saw slight declines, and net profit was halved from 404 million yen in the previous year to 200 million yen. This was driven by the 209 million yen impairment loss and increased corporate tax expenses. The results missed the company's initial targets (Sales: 26.356 billion yen; Operating Profit: 786 million yen; Net Profit: 479 million yen), highlighting the need for stricter profitability management in new store openings and improved performance in existing stores.
2. Analysis of Ordinary Profit Fluctuations
An analysis of the 29 million yen decrease in ordinary profit from the previous year (764 million yen) to the current year (735 million yen) reveals that while marginal profit increased due to higher sales , the rise in costs outweighed these gains.
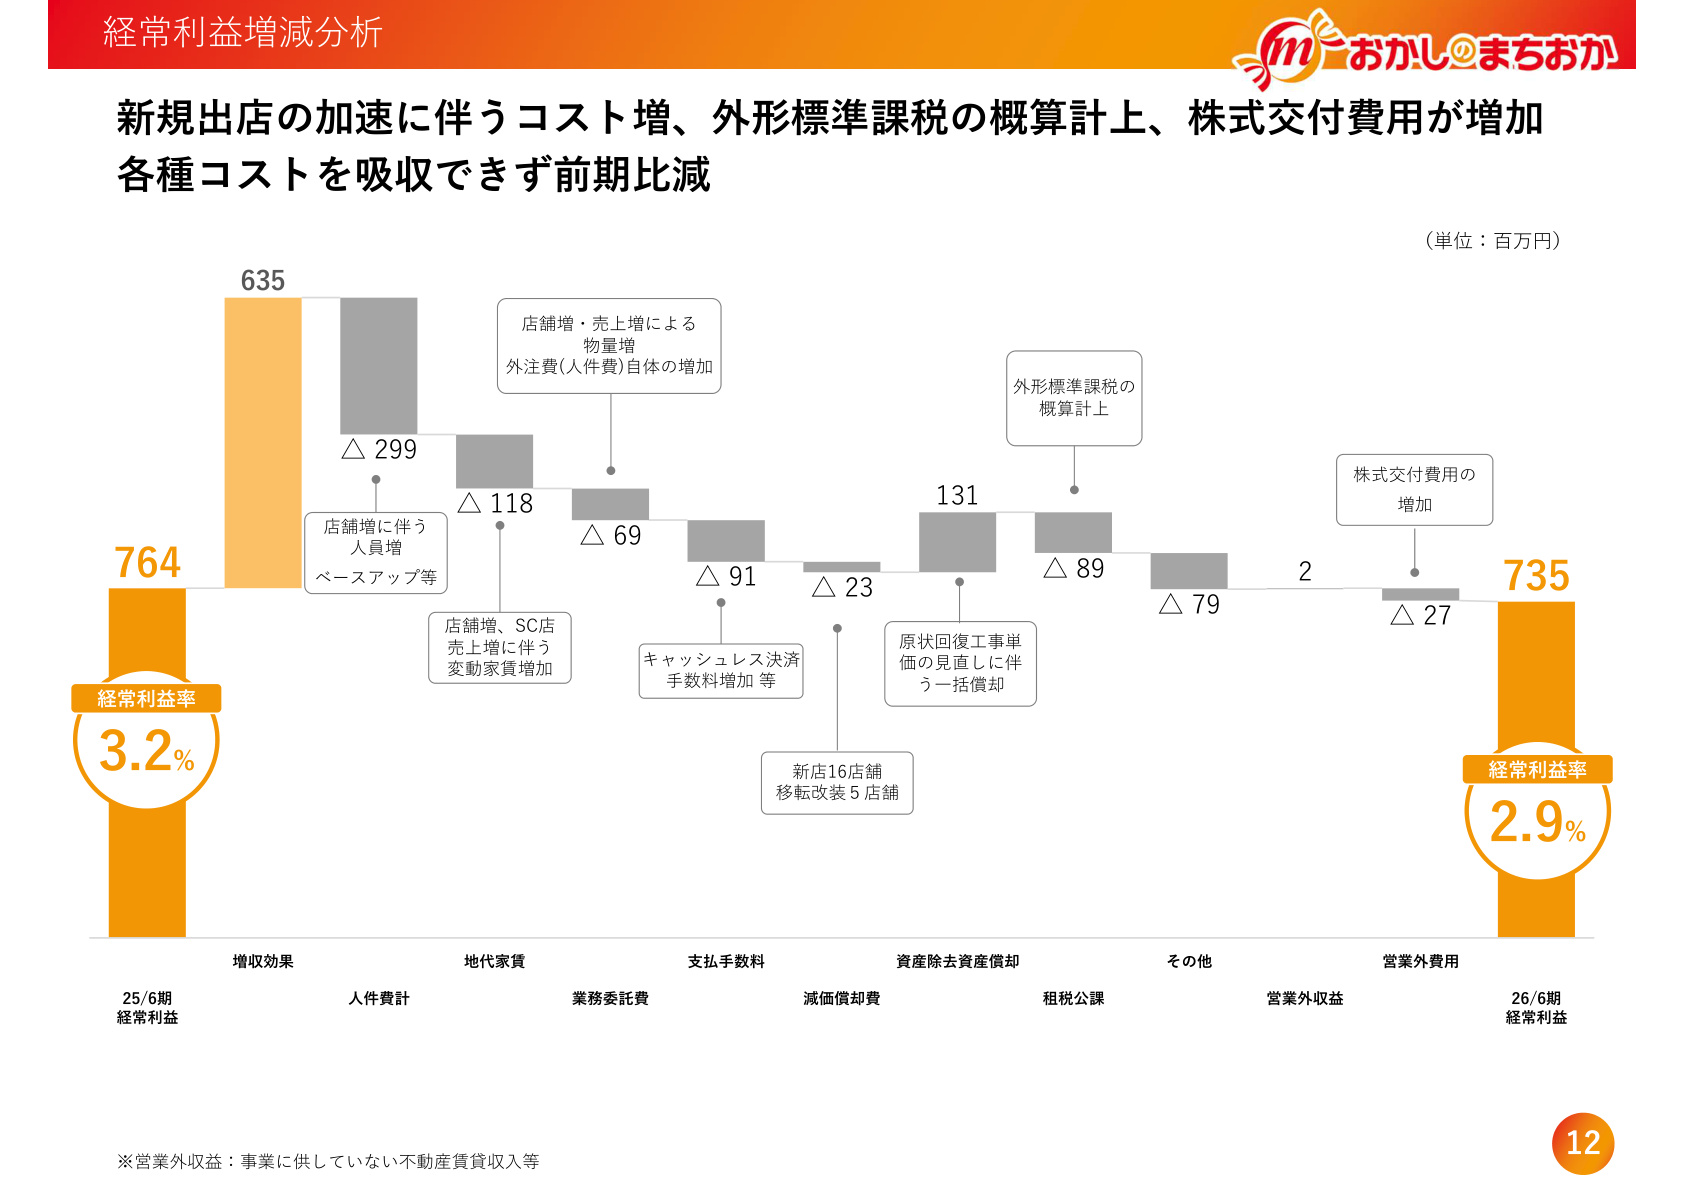
[Explanation and Significance of Slide 11]
This waterfall chart breaks down the factors contributing to the change in ordinary profit from 764 million yen to 735 million yen.
Key drivers include:
- Positive Factors (Sales Growth Effect) : Profit boost of +635 million yen due to store expansion and increased sales.
- Negative Factors (SG&A and Cost Increases) :
- Labor Costs : -299 million yen due to increased headcount and wage hikes.
- Rent : -118 million yen due to store expansion and higher variable rents at shopping center (SC) locations.
- Outsourcing Fees : -69 million yen due to increased volume and external service costs.
- Payment Processing Fees : -91 million yen due to the rise in cashless payment transactions.
- Taxes and Dues : -89 million yen due to estimated pro-forma standard taxation.
- Non-operating Expenses : -27 million yen related to costs for the new stock listing.
While the sales growth effect (+635 million yen) was robust, the visual data clearly shows that rising overheads (totaling over 660 million yen) pressured margins. Future profitability hinges on controlling these fixed and variable costs while increasing the earning power per store.
3. Monthly Trends and Store Strategy (SC Shift and Dominance)
Monthly Performance Trends
Existing store sales remained positive at 101.2% year-on-year. Breakdown:
- Existing Store Customer Traffic : 98.2% (a slight decline).
- Existing Store Average Spend : 103.1% (offsetting the decline in traffic).
- Total Store Performance : Sales 106.9%, Traffic 103.2%, Average Spend 103.6%, with new stores contributing to overall scale expansion.
Store Formats and Regional Trends
A clear strategic shift is evident in store openings and closures:
- By Format : Street-level stores decreased to 80 (3 closures), while Shopping Center (SC) stores expanded to 140 (net increase of 15) . All 16 new stores were opened in SCs.
- Sales per Store : Both formats are trending upward, with street-level stores at 120 million yen and SC stores at 114 million yen annually.
- By Region : In addition to the core Kanto region (165 stores), the company is promoting dominant expansion in the Chukyo (27 stores) and Kansai (28 stores) regions. Logistics infrastructure was strengthened with the opening of the Ibaraki Logistics Center (Osaka) in January 2024.
4. FY2027 Earnings Forecast and Improvement Measures
For the fiscal year ending June 2027, the company aims to continue sales growth while prioritizing profitability improvements .
FY2027 Full-Year Plan
- Net Sales : 27.183 billion yen (+5.9% YoY)
- Operating Profit : 770 million yen (+5.1% YoY)
- Ordinary Profit : 782 million yen (+6.4% YoY)
- Net Profit : 346 million yen (+73.2% YoY)
- Number of Stores : 230 (13 new, 3 closures; net increase of 10)
Three Major Profitability Measures
- Turnaround of Underperforming Stores : Focus on operational cost management.
- Strengthening Existing Store Profitability : Store renovations (heat shielding, wider aisles for better flow), setting monthly featured products, and leveraging SNS (approx. 40k Instagram followers, 170k X followers) to drive traffic.
- Review of New Store Criteria : Stricter budget management and precision in site selection to ensure profitability from the start.
5. Financial Position and Cash Flow
- Assets and Capital : Total assets as of June 2026 were 9.334 billion yen (+888 million yen YoY). The equity ratio improved significantly from 34.0% to 41.9% .
- Cash Flow (C/F) :
- Operating C/F : +619 million yen (generated by sales growth).
- Investing C/F : -547 million yen (new store openings, interior work, and security deposits).
- Financing C/F : +227 million yen (proceeds from new stock issuance).
- Cash and Equivalents : 1.471 billion yen , maintaining liquidity for growth investments.
6. Expansion of Shareholder Returns (Dividend Hikes and New Perks)
The company is committed to strengthening its corporate structure and securing funds for future investment while enhancing shareholder returns.
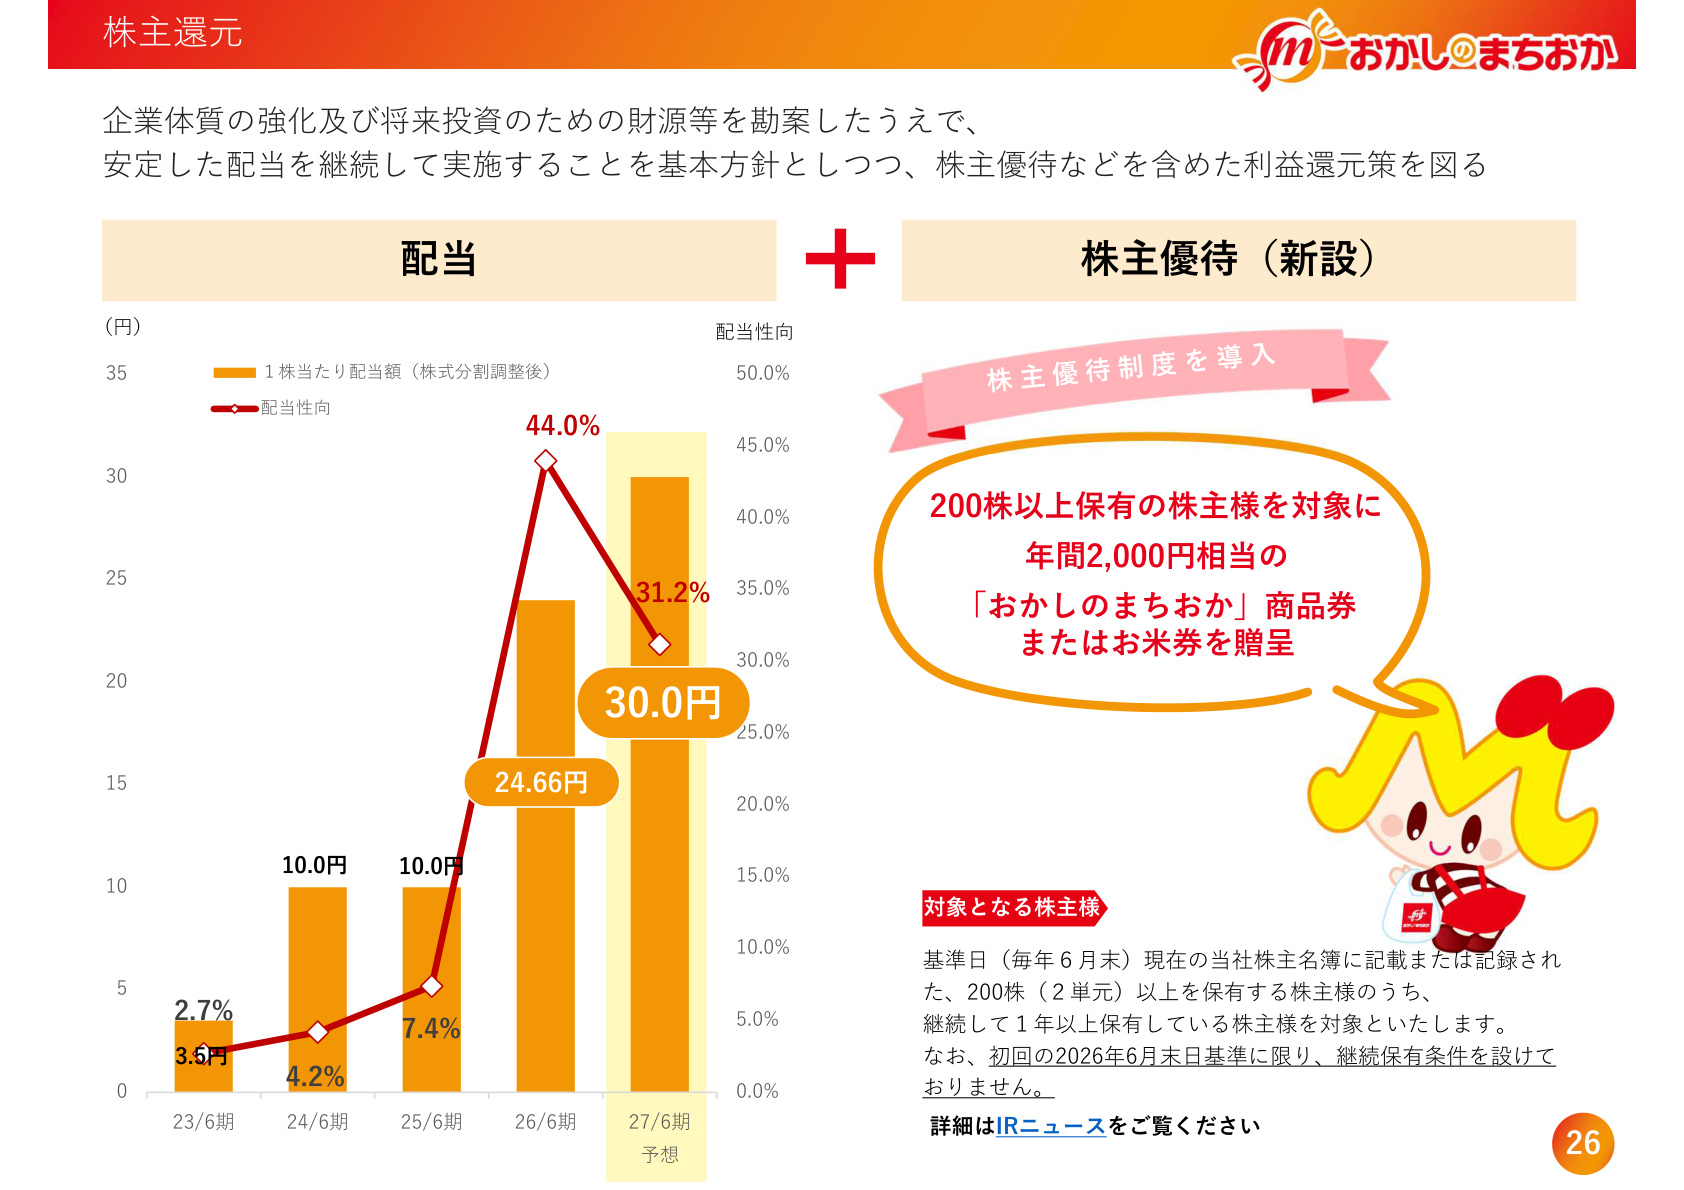
[Explanation and Significance of Slide 25]
This slide outlines the company's commitment to shareholder returns.
Two key points:
- Consecutive Dividend Hikes : Increased from 10.0 yen in FY2025 to 24.66 yen (44.0% payout ratio) in FY2026. A further increase to 30.0 yen (31.2% payout ratio) is planned for FY2027.
- New Shareholder Benefit Program : Shareholders holding 200 shares or more will receive 2,000 yen worth of "Okashi no Machioka Gift Certificates" or "Rice Coupons" annually (Record date: June 30). The initial distribution has no holding period requirement, aimed at attracting a broader investor base.
Conclusion
Minoya's FY2026 results showed record-high sales of 25.6 billion yen, though profits were impacted by expansion costs and impairment losses. For FY2027, the company aims to recover net profit to 346 million yen through stricter store opening criteria and existing store revitalization. With a planned dividend increase to 30 yen and the introduction of a new shareholder benefit program, the company is transitioning into a phase that balances growth with shareholder returns.
This content is not intended as investment advice or a recommendation. Any opinions expressed are solely the personal views of each article.