


And Do Holdings (3457) FY2026 Earnings Deep Dive Report

StockClub
Published: Aug 14, 2026, 10:13 AM
Sentiment Analysis
1. Overview of FY2026 Consolidated Financial Results and Summary
And Do Holdings reported consolidated financial results for the fiscal year ended June 2026, with net sales of 49,617 million yen (down 23.4% YoY) , operating profit of 1,120 million yen (down 57.3% YoY) , ordinary profit of 1,120 million yen (down 61.9% YoY) , and net profit attributable to owners of the parent of 1,452 million yen (down 38.0% YoY) .
The company is currently aggressively pursuing a "business portfolio restructuring" to enhance growth potential and capital efficiency. As part of this initiative, it has been executing business transfers (such as the renovation business) and reviewing its revenue structure (downsizing the House-Leaseback business and fund liquidation). These actions resulted in a significant decline in both sales and profits.
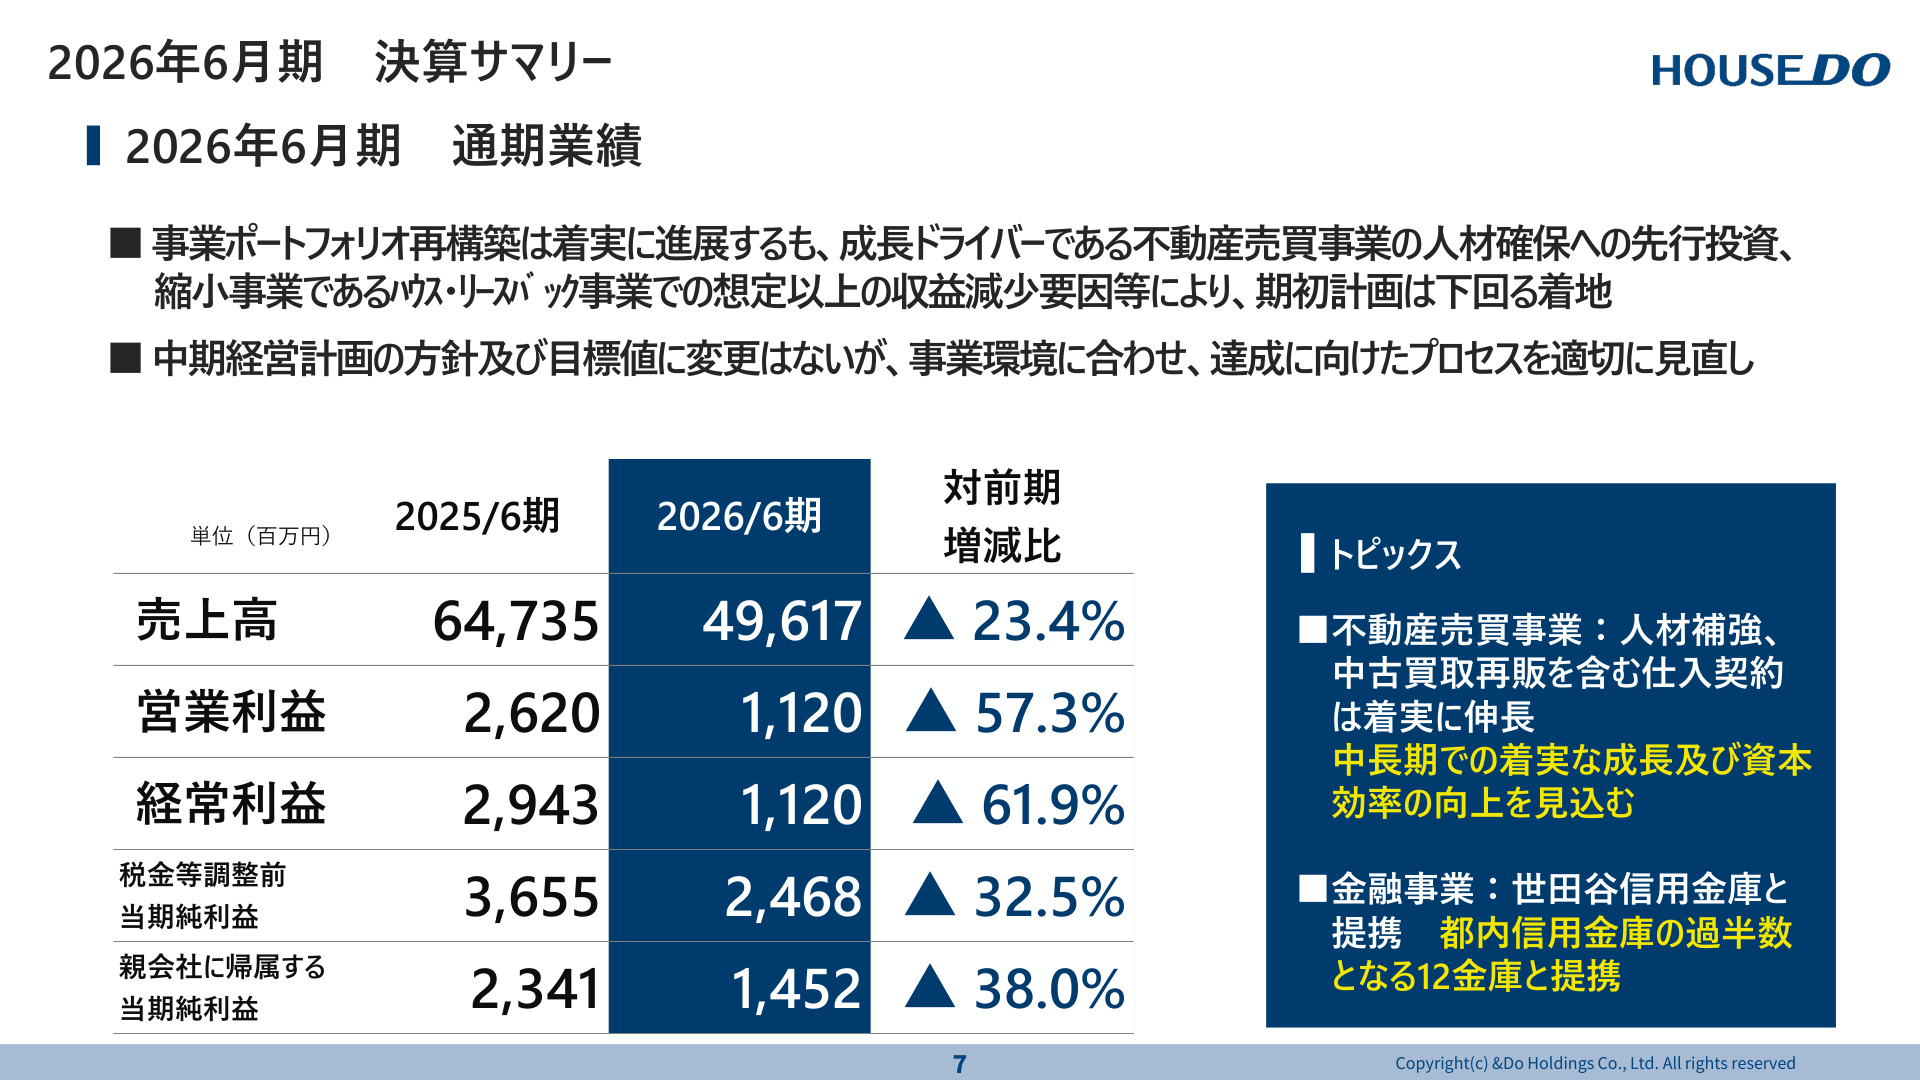
The earnings summary slide above aggregates quantitative data from this fiscal year, which represents a transitional period for the company's business structure. This slide is critical because it illustrates not merely a deterioration in performance, but a deliberate process of business restructuring aimed at improving long-term capital efficiency and financial health.
While the results fell short of the initial full-year forecast (net sales of 55,000 million yen, operating profit of 2,900 million yen), the primary factors are as follows:
- Partial non-realization of asset transfers to the HLB (House-Leaseback) fund and the reactionary decline from large-scale projects executed in previous years.
- Concentrated disposal of long-term stagnant inventory to improve inventory health (a factor in lower profit margins).
- Upfront investment in sales personnel for the real estate trading business and the postponement of new acquisitions and inventory buildup schedules.
- Revenue loss due to the downsizing and divestiture of non-core businesses (e.g., the renovation business).
Conversely, the qualitative transformation of the business foundation is progressing steadily, evidenced by the solid performance of the franchise business (a stock-type business), the expansion of the financial business (reverse mortgage guarantees) , and a significant reduction in selling, general, and administrative expenses (down 19.0% YoY to 9,651 million yen).
2. Initiatives for Financial Improvement, Inventory Health, and Capital Efficiency
The company has identified the improvement of capital turnover and the deleveraging of its balance sheet as top priorities. As of the end of June 2026, total assets stood at 67,798 million yen (a decrease of 4,174 million yen from the previous fiscal year-end) , reflecting progress in debt reduction. Notably, interest-bearing debt was reduced by 3.67 billion yen from the previous year-end, the D/E ratio improved by 0.3x to 2.3x , and the equity ratio rose to 28.0% (up 2.4 percentage points from 25.6% in the previous year) , indicating a significant improvement in financial soundness.
Regarding inventory management in the real estate trading business, the company strictly implemented a strategy to shift away from large-scale, multi-lot projects that require long development periods toward purchasing and reselling used homes and smaller projects with higher turnover rates.
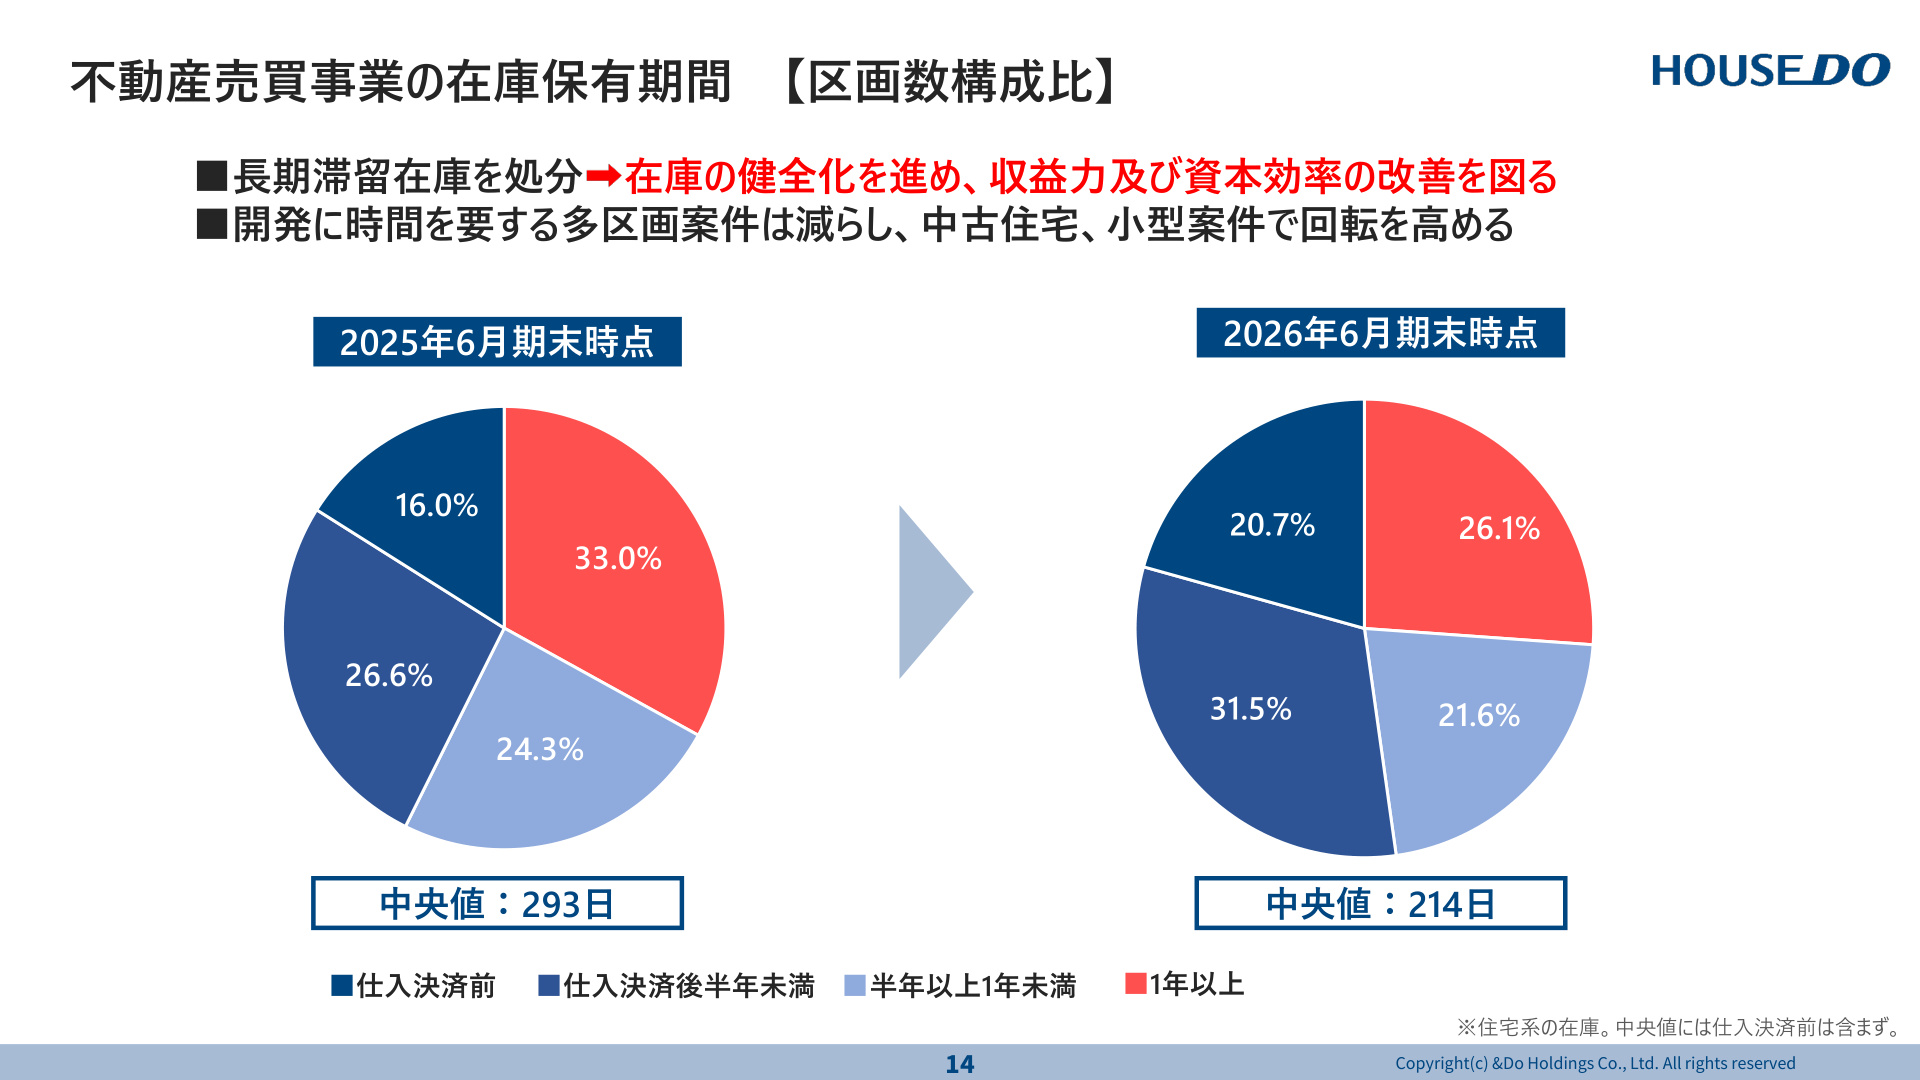
The inventory holding period (by lot composition) for the real estate trading business slide above provides definitive data on the tangible results of the company's inventory health initiatives. A deep analysis of the background and implications of this slide reveals that the efforts to clear long-term stagnant inventory are clearly reflected in the figures.
Specific changes include:
- Ratio of long-term stagnant inventory held for over one year : Decreased by 6.9 percentage points from 33.0% at the end of June 2025 to 26.1% at the end of June 2026.
- Ratio of fresh inventory held for less than six months after acquisition : Increased from 26.6% to 31.5% .
- Median inventory holding period : Shortened by 79 days, from 293 days at the end of June 2025 to 214 days at the end of June 2026.
By evaluating and disposing of past stagnant inventory during this fiscal year, the company temporarily pressured its operating profit margin; however, the replacement and sanitization of product inventory are now complete. This has prepared the company for improvements in capital turnover and ROIC (Return on Invested Capital) from the next fiscal year onward.
3. Segment Performance and Growth Strategy
Details of the performance and initiatives for each segment are as follows:
① Franchise Business (High-Profit Stable Foundation)
- Net Sales : 3,324 million yen (up 3.5% YoY)
- Operating Profit : 1,928 million yen (up 0.4% YoY)
- Operating Profit Margin : 58.0% (maintaining an extremely high margin)
- Cumulative Number of Stores : 733 (up 8 stores YoY), New Store Openings : 111 (up 32.1% YoY) The launch of new franchise stores proceeded smoothly, and stock-based revenue such as monthly membership fees and system fees remained solid. The company is strengthening new acquisitions by setting priority areas, primarily in urban centers.
② Real Estate Trading Business (Growth Driver and Shift to Used Homes)
- Net Sales : 35,246 million yen (down 10.8% YoY)
- Operating Profit : 1,713 million yen (down 32.7% YoY) Although profits declined due to the disposal of large-scale projects and the burden of personnel investment, the used home purchase and resale business, which the company is focusing on, grew with sales of 9,954 million yen (up 12.4% YoY) and 349 units sold (up 14.1% YoY) . The ratio of used homes in residential sales rose to 31.7% (from 29.0% in the previous year) , indicating a shift toward a turnover-based business model. Additionally, the average number of sales personnel during the period increased significantly from 59.3 to 91.1.
③ Financial Business (Steady Expansion of Reverse Mortgage Guarantees)
- Net Sales : 641 million yen (up 13.8% YoY)
- Operating Profit : 262 million yen (up 46.3% YoY)
- Operating Profit Margin : 40.9% The company expanded its network of partner financial institutions (partnering with 12 credit unions, representing the majority of credit unions in Tokyo, including Setagaya Shinkin Bank), and the balance of reverse mortgage guarantees grew significantly to 35,344 million yen , contributing to overall performance as a high-margin business.
④ House-Leaseback Business (Scale Optimization and Structural Transformation)
- Net Sales : 9,595 million yen (down 50.7% YoY)
- Operating Profit : 889 million yen (down 60.7% YoY) As a result of shifting from self-owned assets to a fund-utilization model and proceeding with asset compression, the business is undergoing a process of downsizing and optimization as planned.
4. Cash Flow and Shareholder Returns (Dividend Policy)
As a result of reviewing the pace of acquisitions and proceeding with asset sales in line with business restructuring, the company secured a positive free cash flow of 5,652 million yen (Operating CF: 5,836 million yen, Investing CF: -183 million yen), ensuring highly abundant liquidity.
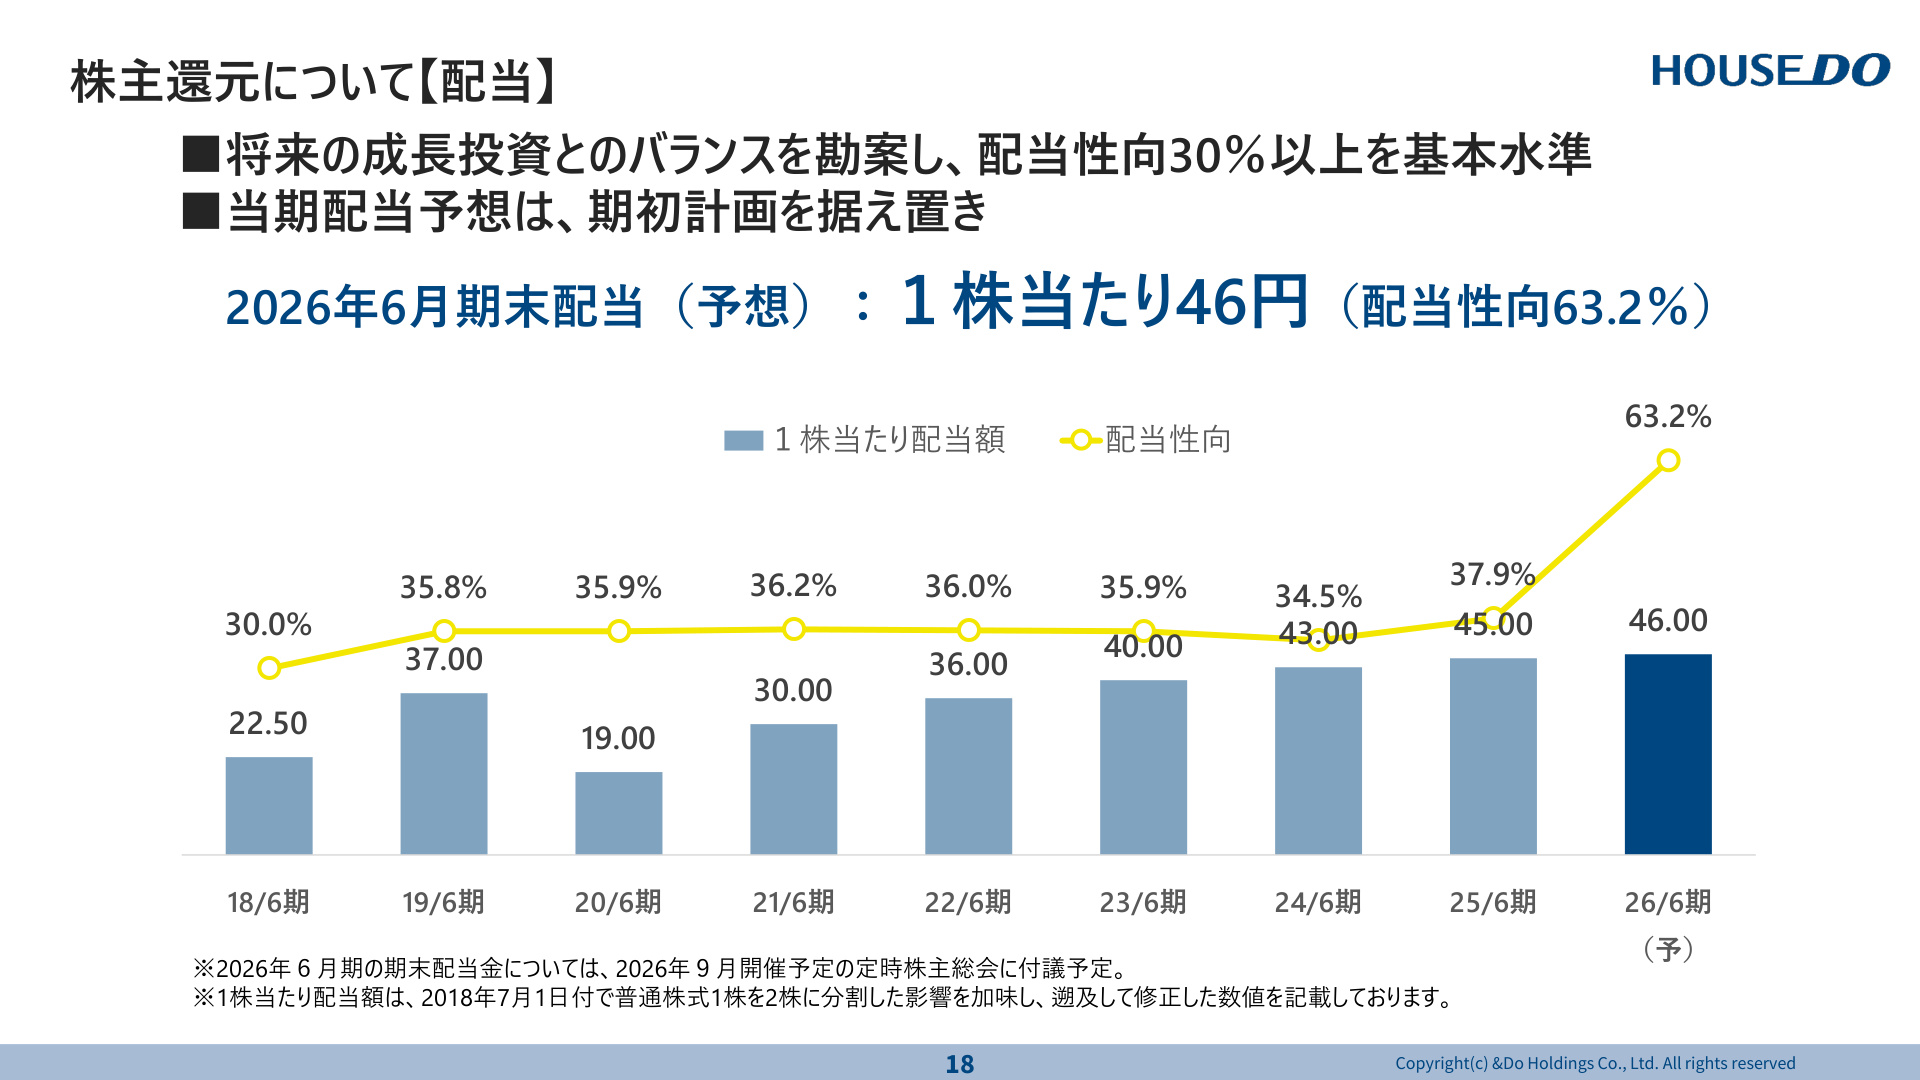
The shareholder return (dividend trend) slide above is an important document demonstrating the company's shareholder-oriented stance and capital policy. The significance of this slide lies in the fact that even during a transitional period where earnings declined, the company maintained the dividend level as planned at the beginning of the year, clearly demonstrating its commitment to shareholder returns.
Key dividend indicators are as follows:
- FY2026 Dividend per Share (Forecast) : 46.00 yen (maintaining the plan to increase the dividend by 1.00 yen from 45.00 yen in the previous year)
- Dividend Payout Ratio (Forecast) : 63.2% (a level significantly exceeding the basic policy of a "dividend payout ratio of 30% or more")
The company aims to continue stable dividends while balancing future growth investments (real estate acquisitions and personnel investment), demonstrating a high level of awareness regarding returns to investors.
5. Future Outlook and Mid-to-Long-Term Growth Story Toward 2030
Fiscal year 2026 can be described as a transitional year that completed the "clearing of negative legacies" and "business portfolio restructuring" through the disposal of stagnant inventory and the reorganization of non-core businesses.
Looking ahead, the following growth story is expected:
- Acceleration of acquisitions and sales in the real estate trading business : The results of personnel reinforcement (a structure of over 90 sales staff) will fully materialize, aiming for a recovery in turnover and sales centered on sanitized used home inventory.
- Expansion of stock revenue from the FC store network and financial guarantees : Leveraging the network of 733 FC stores while expanding high-margin stock through the accumulation of reverse mortgage guarantee balances.
- V-shaped recovery in capital efficiency (ROIC/ROE) : Setting a target of "ROIC of 6% or more" for the fiscal year ending June 2030, aiming to maximize corporate value through asset compression and profit margin improvement.
Having completed a cycle of business structural reform, the focus will now be on what trajectory of correction and re-growth the company will chart from the next fiscal year onward.
This content is not intended as investment advice or a recommendation. Any opinions expressed are solely the personal views of each article.