

![[In-Depth Analysis] HAKUTEN (2173) Q2 FY2026 Financial Results: Behind the Revenue Growth and Strategic Investments, and Progress Toward the Mid-Term Management Plan](https://news-images.stock-club.net/market_news/images/2173/140120260814521075/slide_eyecatch_en_9530bbd6.webp)
[In-Depth Analysis] HAKUTEN (2173) Q2 FY2026 Financial Results: Behind the Revenue Growth and Strategic Investments, and Progress Toward the Mid-Term Management Plan

StockClub
Published: Aug 14, 2026, 09:58 AM
Sentiment Analysis
The Q2 FY2026 financial results for HAKUTEN Corporation (Securities Code: 2173) demonstrate a year-on-year increase in both net sales and gross profit , successfully absorbing the reactionary decline from projects such as the Osaka-Kansai Expo. While operating profit temporarily declined due to changes in accounting treatment and accelerated investment in human capital for future growth, this report breaks down the key topics from the earnings presentation into 10 points, providing a comprehensive overview ranging from the background of these results to the strength of their customer base and progress toward their mid-term management plan.
1. Cumulative Q2 Results: Sustained Revenue Growth Despite Upfront Investments
For the first half (January–June) of the fiscal year ending December 2026, consolidated results were as follows: Net Sales of 11,113 million yen (+7.7% YoY) , Gross Profit of 3,507 million yen (+2.9% YoY) , Operating Profit of 968 million yen (-17.1% YoY) , and Profit Attributable to Owners of Parent of 658 million yen (-17.0% YoY) .
Looking at Q2 alone (April–June), Net Sales remained solid at 6,301 million yen (+3.7% YoY) , as the company steadily covered the reactionary decline from large-scale projects in the previous year by deepening relationships with existing and new clients.
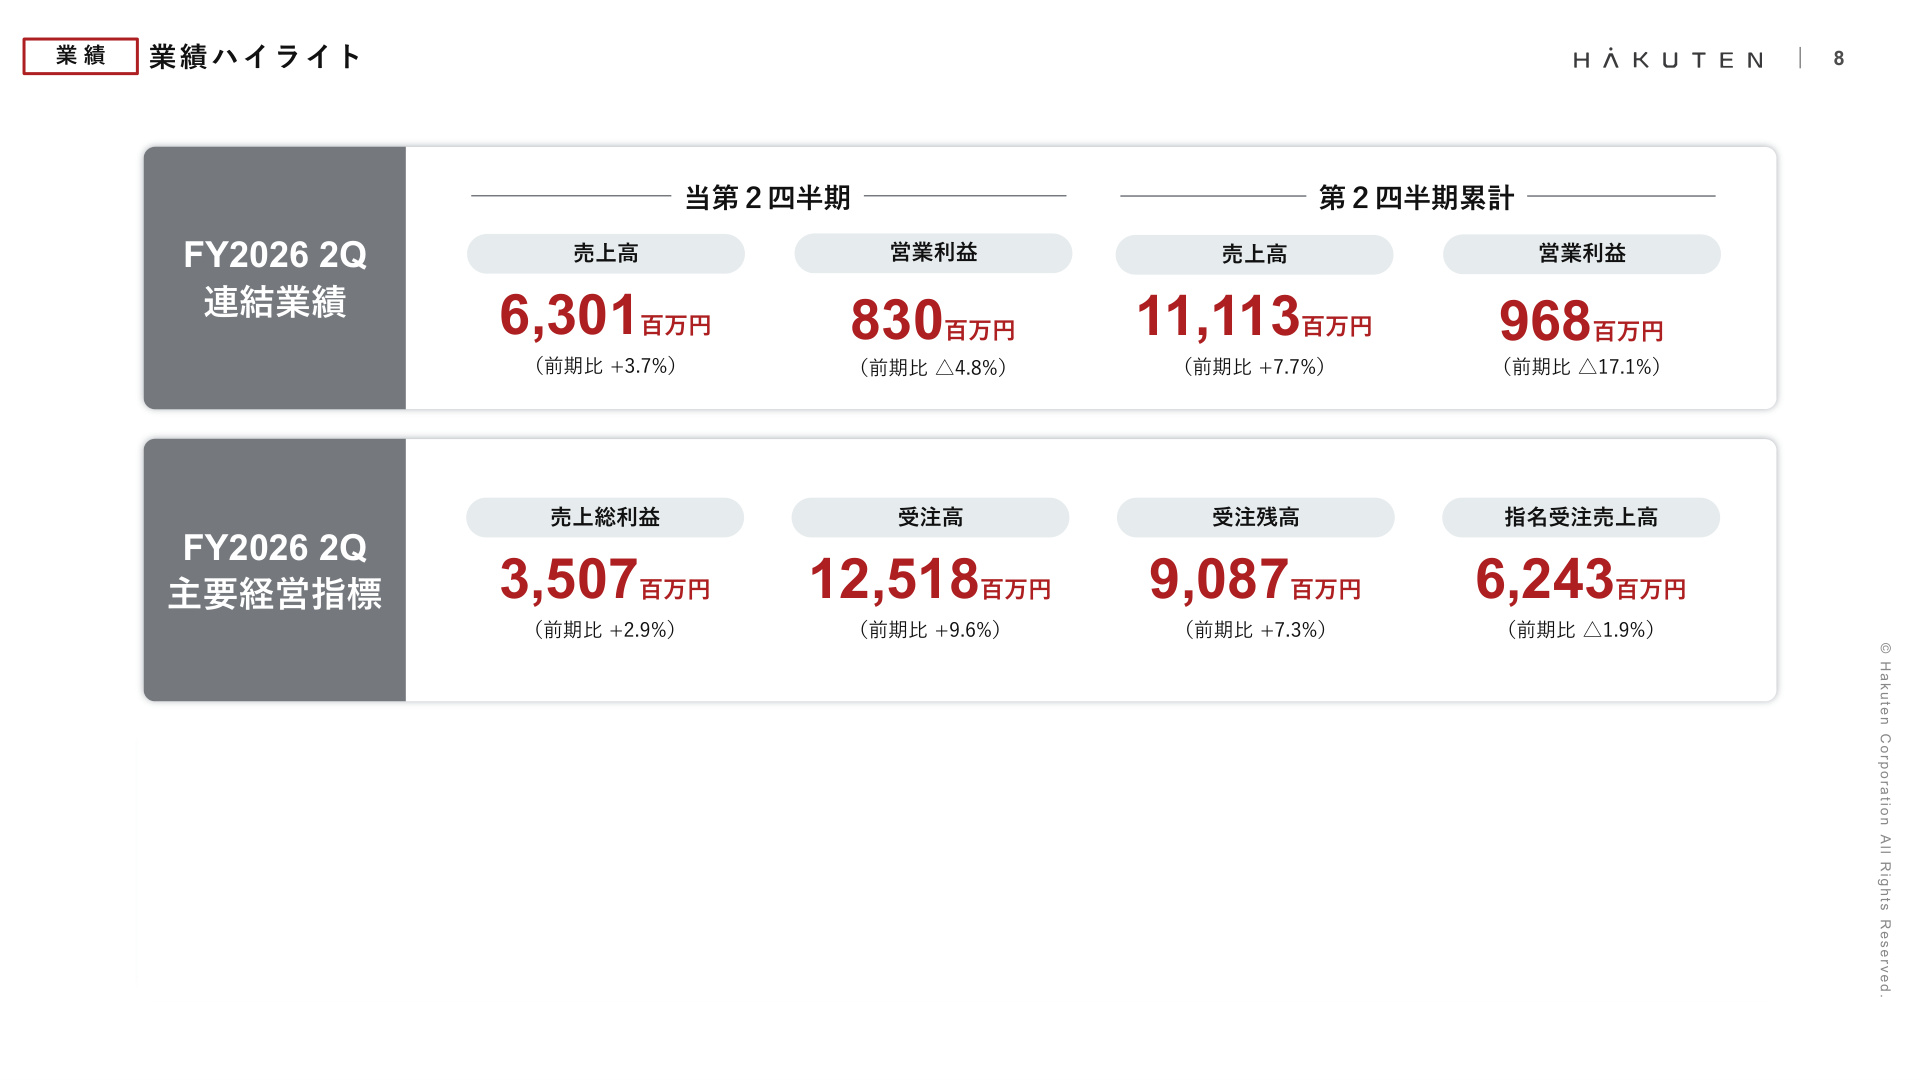
Slide Commentary: Performance Highlights (Slide 8)
This slide provides an overview of HAKUTEN's company-wide performance and key management indicators for Q2 FY2026 . Notably, alongside the expansion in net sales (11,113 million yen), both Order Intake of 12,518 million yen (+9.6% YoY) and Order Backlog of 9,087 million yen (+7.3% YoY) —the sources of future revenue—exceeded the figures from the same period last year. This visually confirms that the accumulation of projects for the second half is progressing smoothly.
2. Impact of Accounting Changes: Underlying Operating Profit Trends
Starting this fiscal year, the accounting treatment for bonus provisions has been standardized across the group. Previously, a portion of expenses recorded in Q4 has been changed to be allocated across each quarter. As a result, the cumulative Q2 figures were impacted by +64 million yen in gross profit and +101 million yen in SG&A expenses , resulting in a downward impact of 37 million yen on operating profit .
When compared to the previous accounting standards (reference values), the cumulative Q2 Operating Profit would have been 1,134 million yen (-2.9% YoY) , and Q2 alone (April–June) would have been 913 million yen (+4.7% YoY) , indicating that the underlying earning power of the core business remains equal to or better than the previous year .
3. Analysis of Operating Profit Fluctuations: Active Investment in Talent and Growth
The breakdown of the factors behind the decrease in operating profit from 1,168 million yen in the same period last year to 968 million yen is as follows:
- Increase in Gross Profit from existing clients : +216 million yen
- Increase in Gross Profit from new/dormant clients : +47 million yen
- Impact of lower gross profit margin : -164 million yen
- Growth investment (systems, environmental initiatives, etc.) : -18 million yen
- Investment in human capital (hiring, increased personnel costs, etc.) : -253 million yen
- Increase in other SG&A expenses : -28 million yen
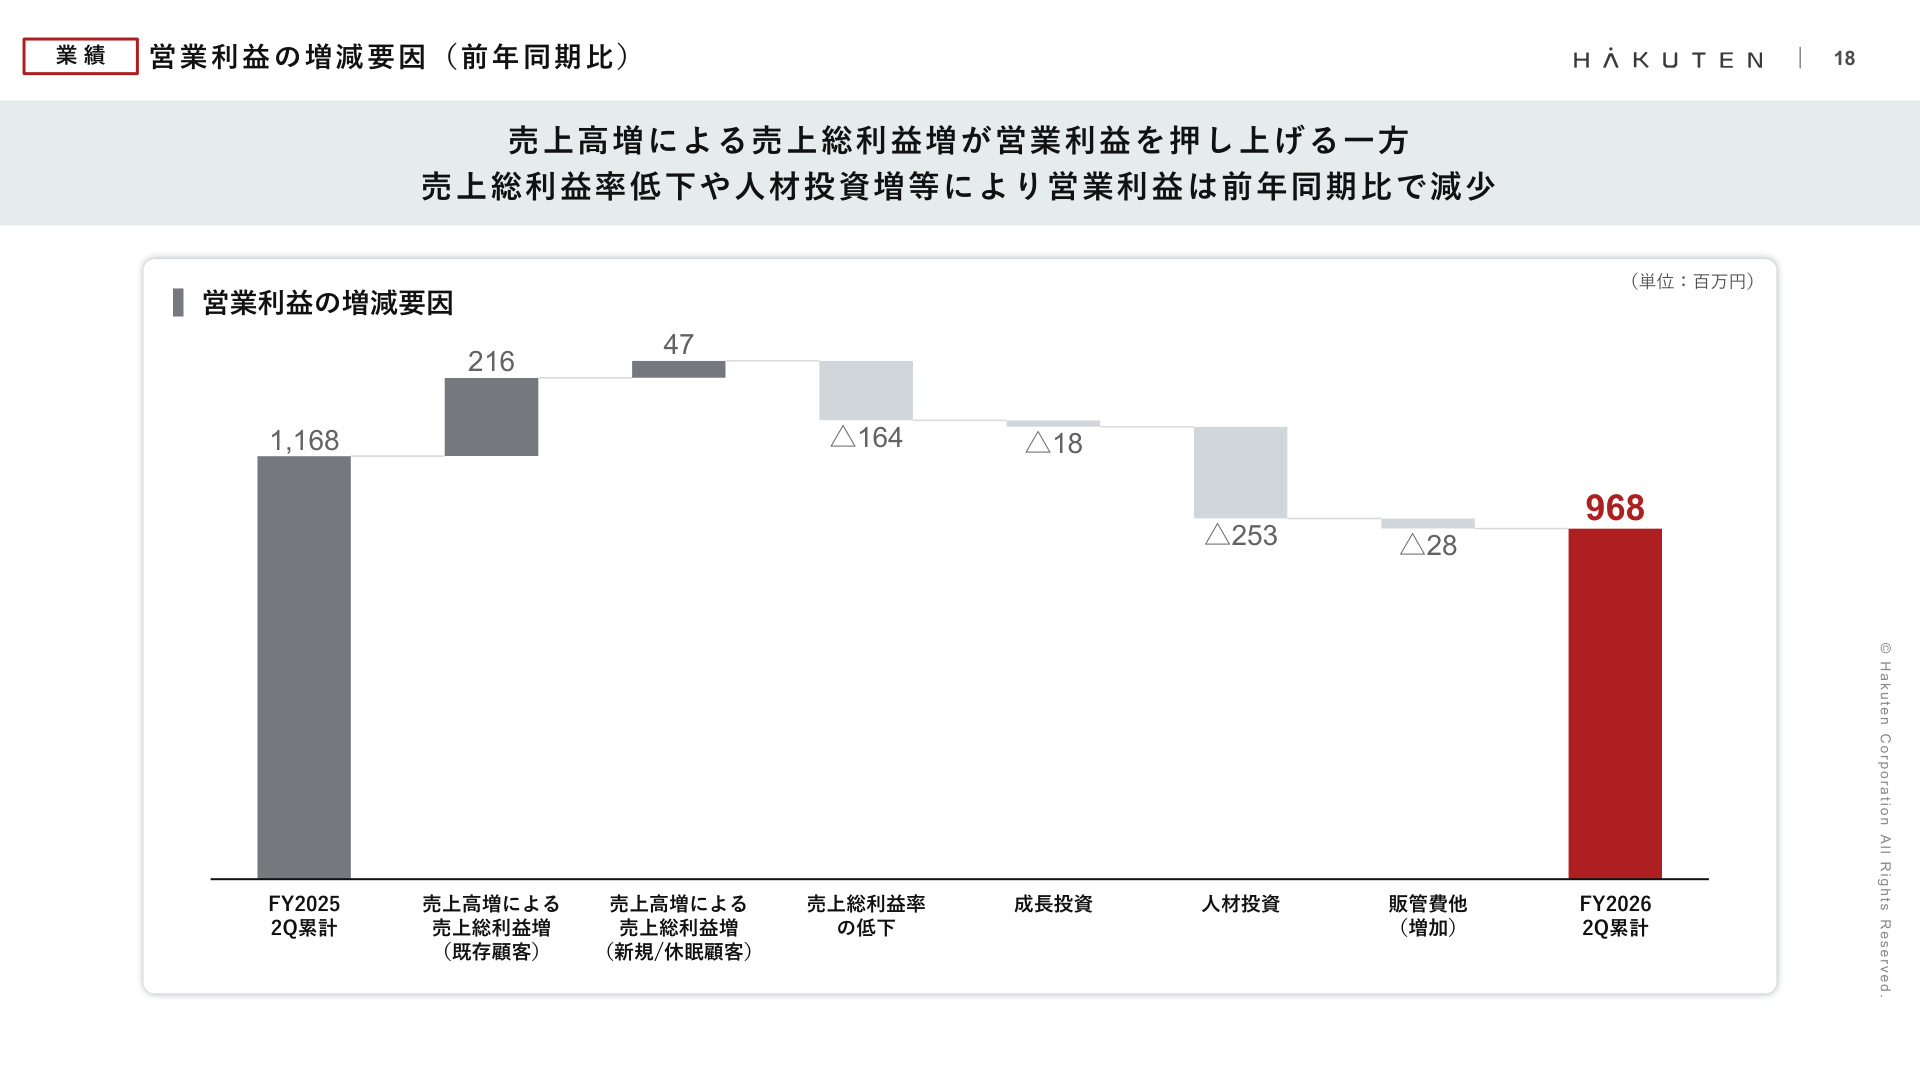
Slide Commentary: Factors for Operating Profit Change (Slide 18)
This waterfall chart is a crucial slide for grasping the factors behind operating profit fluctuations from the previous year at a glance. While the increase in net sales (a total of +263 million yen from existing and new clients) strongly boosted profits, it shows that investment in human capital (-253 million yen) to build a foundation for future growth was the largest factor in the profit decline. This can be interpreted as an "intentional allocation of resources" for mid-term business expansion rather than a simple deterioration in performance.
4. Profit and Loss by Business Unit: B2C and Regional Offices Lead the Way
The cumulative Q2 net sales by business category clearly reflect changes in market needs:
- Tokyo Metropolitan Area / B2B Marketing Business : Net Sales of 3,201 million yen (-607 million yen YoY) Despite the impact of the reactionary decline from large-scale projects, the gross profit margin improved to 33.9% (+3.1 points) .
- Tokyo Metropolitan Area / B2C Marketing Business : Net Sales of 3,929 million yen (+801 million yen YoY) Achieved significant revenue growth by capturing the vitality of large-scale events and brand promotions.
- Chubu / Western Japan Business : Net Sales of 1,208 million yen (+337 million yen YoY) Demonstrated high growth by capturing increasing demand in regional cities.
- Nationwide / Small-to-Medium Exhibition Business : Net Sales of 1,046 million yen (+161 million yen YoY)
- Commercial Environment Business (Permanent Spaces) : Net Sales of 783 million yen (+37 million yen YoY)
- Other Businesses / Subsidiaries : Net Sales of 943 million yen (+69 million yen YoY)
5. Trends in Order Intake and Backlog: Strong Accumulation for the Second Half
Order intake for Q2 alone grew significantly to 6,271 million yen (+12.2% YoY) . As a result, the order backlog at the end of Q2 reached 9,087 million yen (+7.3% YoY) .
The order backlog turnover period remains high at 4.6 months , indicating that the foundation for achieving the full-year performance forecast for the second half is being steadily built.
6. Designated Order Rate and Customer Engagement: Industry-Leading Competitiveness
HAKUTEN's strength, reflected in the high level of customer trust, is evident in various KPIs:
- Designated Order Rate (by number of projects) : 81.6% (continuously exceeding the 80% target)
- Designated Order Rate (by sales value) : 66.0% (a significant recovery from 55.2% in Q1)
This proves the company's high competitive advantage in winning projects through direct designation without going through competitive bidding, as well as its ability to propose solutions to customer challenges.
7. Stable Revenue Base: Trends in Repeat Rates and Customer Conversion
Repeat sales , which indicate long-term relationship building with existing clients, reached 4,732 million yen , with a high repeat rate of 81.7% .
Furthermore, the "conversion rate of new clients to existing clients" —a measure of retaining newly acquired customers—has risen steadily, with a 1-year conversion rate of 29.1% and a 2-year conversion rate of 46.7% . The circular model of a "growth engine" and a "stability engine" that connects new acquisition to repeat business is functioning effectively.
8. Growth in Sustainability Initiatives (Resource-Circulating Events)
As part of efforts to meet the demand for eco-friendly events, net sales from resource-circulating events that meet the company's unique standards reached 5,874 million yen (+2.6% YoY) in cumulative Q2, with 272 projects .
Advanced initiatives, such as Yamaha Motor's "KIDS POOL COUCH" project, which repurposes waste materials into interior decor and furniture, demonstrate how sustainable space design contributes to brand value enhancement and project acquisition.
9. Shareholder Return Policy: Continued Stable Dividends and Shareholder Perks
The following plans have been presented regarding shareholder returns:
- Annual Dividend Forecast : 27.0 yen per share (13.0 yen interim, 14.0 yen year-end)
- Dividend Payout Ratio Target : Continued stable dividends with a target of around 30.0% .
- Shareholder Benefit Program : In addition to JCB gift cards based on the number of shares held and the holding period, the company conducts a lottery to invite 20 shareholders to the "HAKUTEN OPEN STUDIO" special event held at its own factory, "T-BASE." This is a unique IR initiative that deepens understanding of the company's manufacturing and experience-creation processes.
10. Progress and Growth Strategy of the Mid-Term Management Plan (FY2026-FY2028)
The progress status and future numerical targets for the 3-year Mid-Term Management Plan (FY2026-FY2028) , which began in the fiscal year ending December 2026, are as follows:
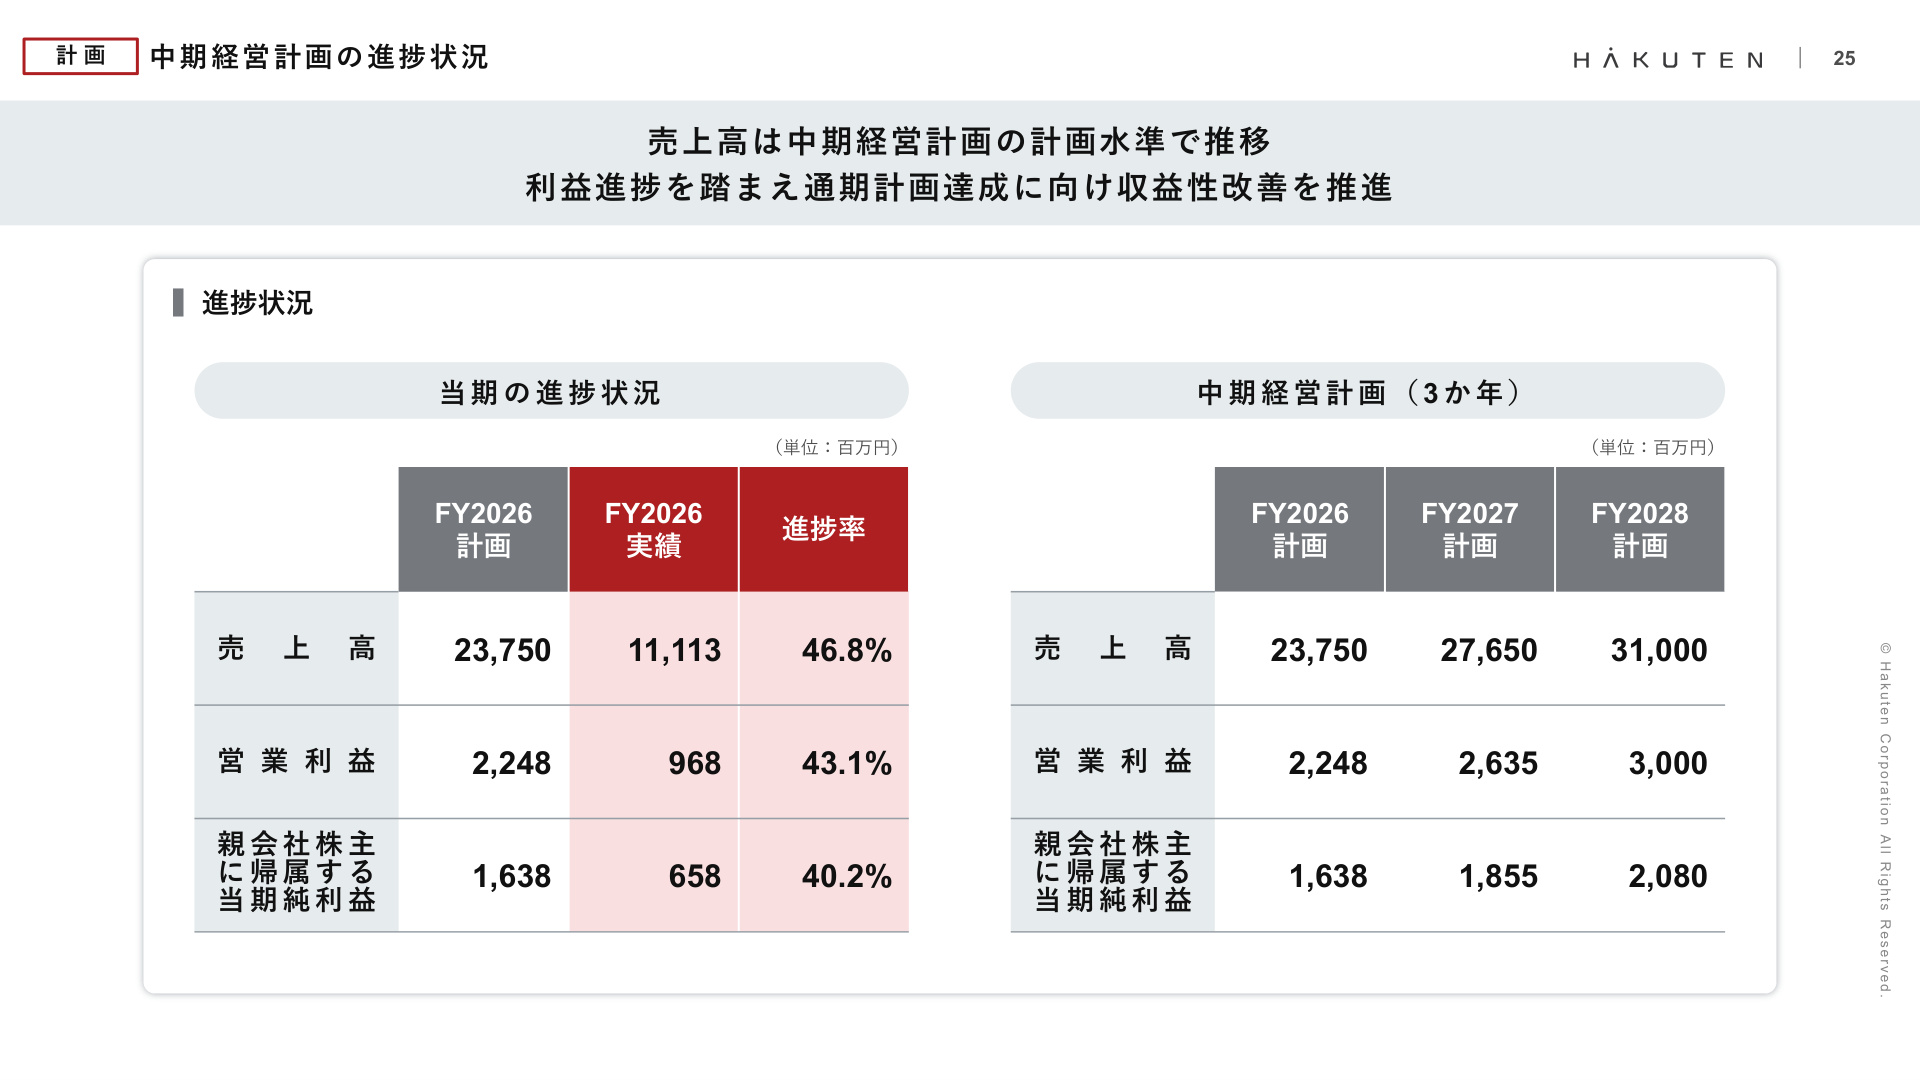
Slide Commentary: Progress of the Mid-Term Management Plan (Slide 25)
This slide clearly shows the progress rate against the current fiscal year's plan and the numerical targets for the 3-year mid-term plan . Against the full-year plan for FY2026 (Net Sales of 23,750 million yen, Operating Profit of 2,248 million yen), the cumulative Q2 progress rate for net sales is 46.8% , and the progress rate for operating profit is 43.1% . Considering the second-half weighting characteristic of the event industry (especially the increase in demand in Q4), this can be considered steady progress in line with the plan. The company aims for 31 billion yen in net sales and 3 billion yen in operating profit by FY2028 , the final year, and is pushing to expand its market share in the Experience Marketing domain.
Summary and Outlook
HAKUTEN's Q2 FY2026 financial results, while including a temporary decline in profit due to accounting changes and human capital investment, demonstrated the strength of its core business and the solidity of its business foundation through expanded net sales, a high designated order rate, and a robust accumulation of order backlog .
Centered on its unique strengths in "creative capabilities," "production and construction management," and "sustainable event design," the company is steadily increasing its position in the "Experience Marketing" (a market domain of 500 billion yen + α) , which integrates events, displays, and advertising. Attention will be focused on its performance trends toward the second half and its execution capability in achieving the mid-term management plan.
This content is not intended as investment advice or a recommendation. Any opinions expressed are solely the personal views of each article.