


Zoom Corporation FY2026 Q2 Earnings Deep Dive: Profit Recovery Driven by Structural Reform and Core Product Growth

StockClub
Published: Aug 13, 2026, 11:35 AM
Sentiment Analysis

Introduction
Zoom Corporation (Securities Code: 6694) has announced its FY2026 Q2 (interim) financial results , which demonstrate a significant profit recovery (return to profitability) . This turnaround is the direct result of the structural reforms implemented in Q4 2025 and the resolution of the "extraordinary circumstances" faced in the previous fiscal year.
This report provides a comprehensive analysis based on the earnings presentation materials, covering performance highlights, factors behind operating profit fluctuations, market trends by product and region, cash flow, and revisions to the full-year earnings forecast.
1. FY2026 Q2 Performance Highlights: A Strong Return to Profit
For the first half of FY2026, Zoom achieved a substantial improvement in both revenue and profit across all stages compared to the same period last year.
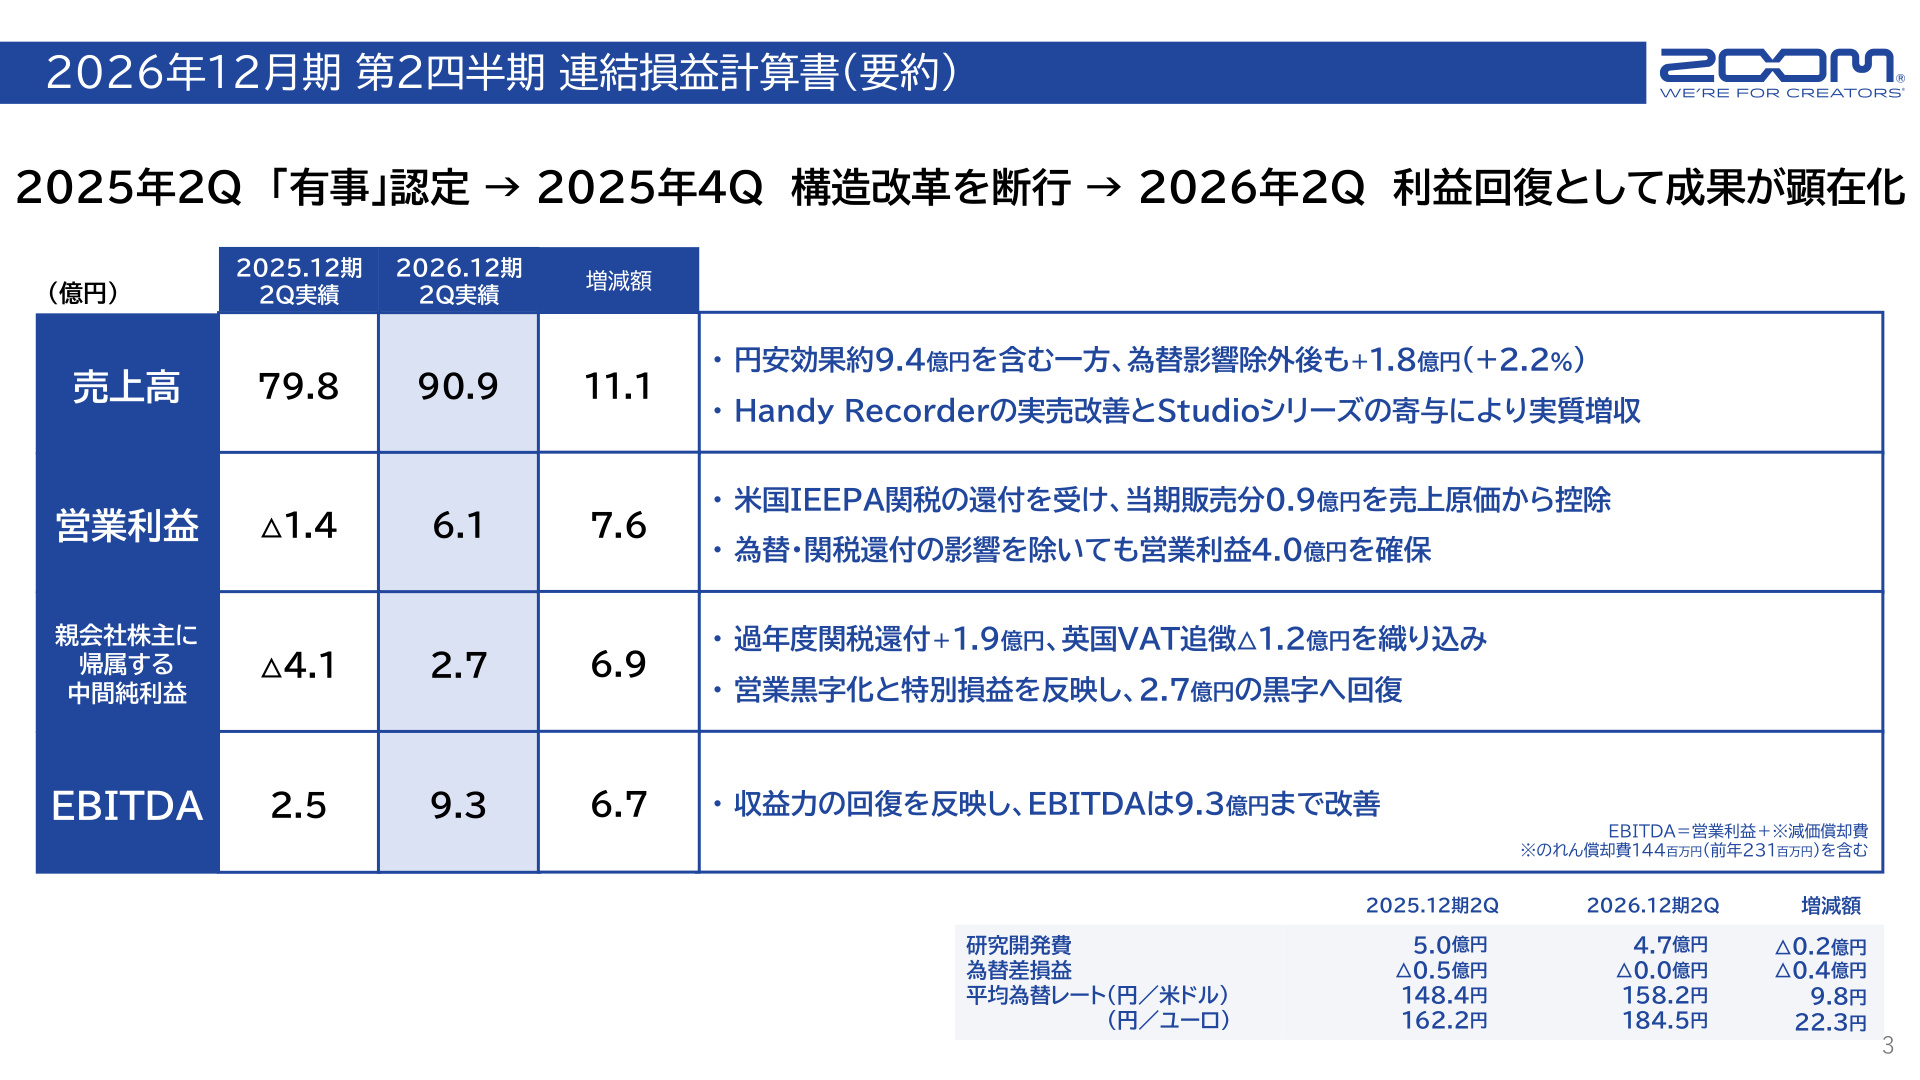
[Slide Commentary: Q2 Consolidated Statement of Income (Summary)]
Slide provides critical baseline data comparing the previous year's Q2 (FY2025) with the current period (FY2026). The company achieved a dramatic turnaround from an operating loss of ¥140 million in the same period last year to an operating profit of ¥610 million (+¥760 million YoY) . Key takeaways from this slide include:
- Net Sales : ¥9.09 billion (+¥1.11 billion / +13.9% YoY) . While this includes a ¥940 million tailwind from the weak yen , the company secured a real revenue increase of ¥180 million (+2.2%) even when excluding currency effects.
- Operating Profit : Expanded from a loss of ¥140 million to a profit of ¥610 million . While this includes a ¥90 million deduction in cost of sales due to IEEPA tariff refunds, the company maintained an operating profit of ¥400 million even excluding currency and tariff effects, signaling a steady recovery in core profitability.
- Net Income Attributable to Owners of Parent : A turnaround from a loss of ¥410 million in the previous year to a profit of ¥270 million (+¥690 million YoY) .
- EBITDA : Increased significantly from ¥250 million to ¥930 million (+¥670 million YoY) , confirming a robust recovery in cash-generating capability.
2. Analysis of Operating Profit Fluctuations: Cost and Fixed Expense Reforms Drive Profitability
The significant improvement in operating profit from a ¥140 million loss to a ¥610 million profit was driven by both internal structural reforms and external environmental factors.
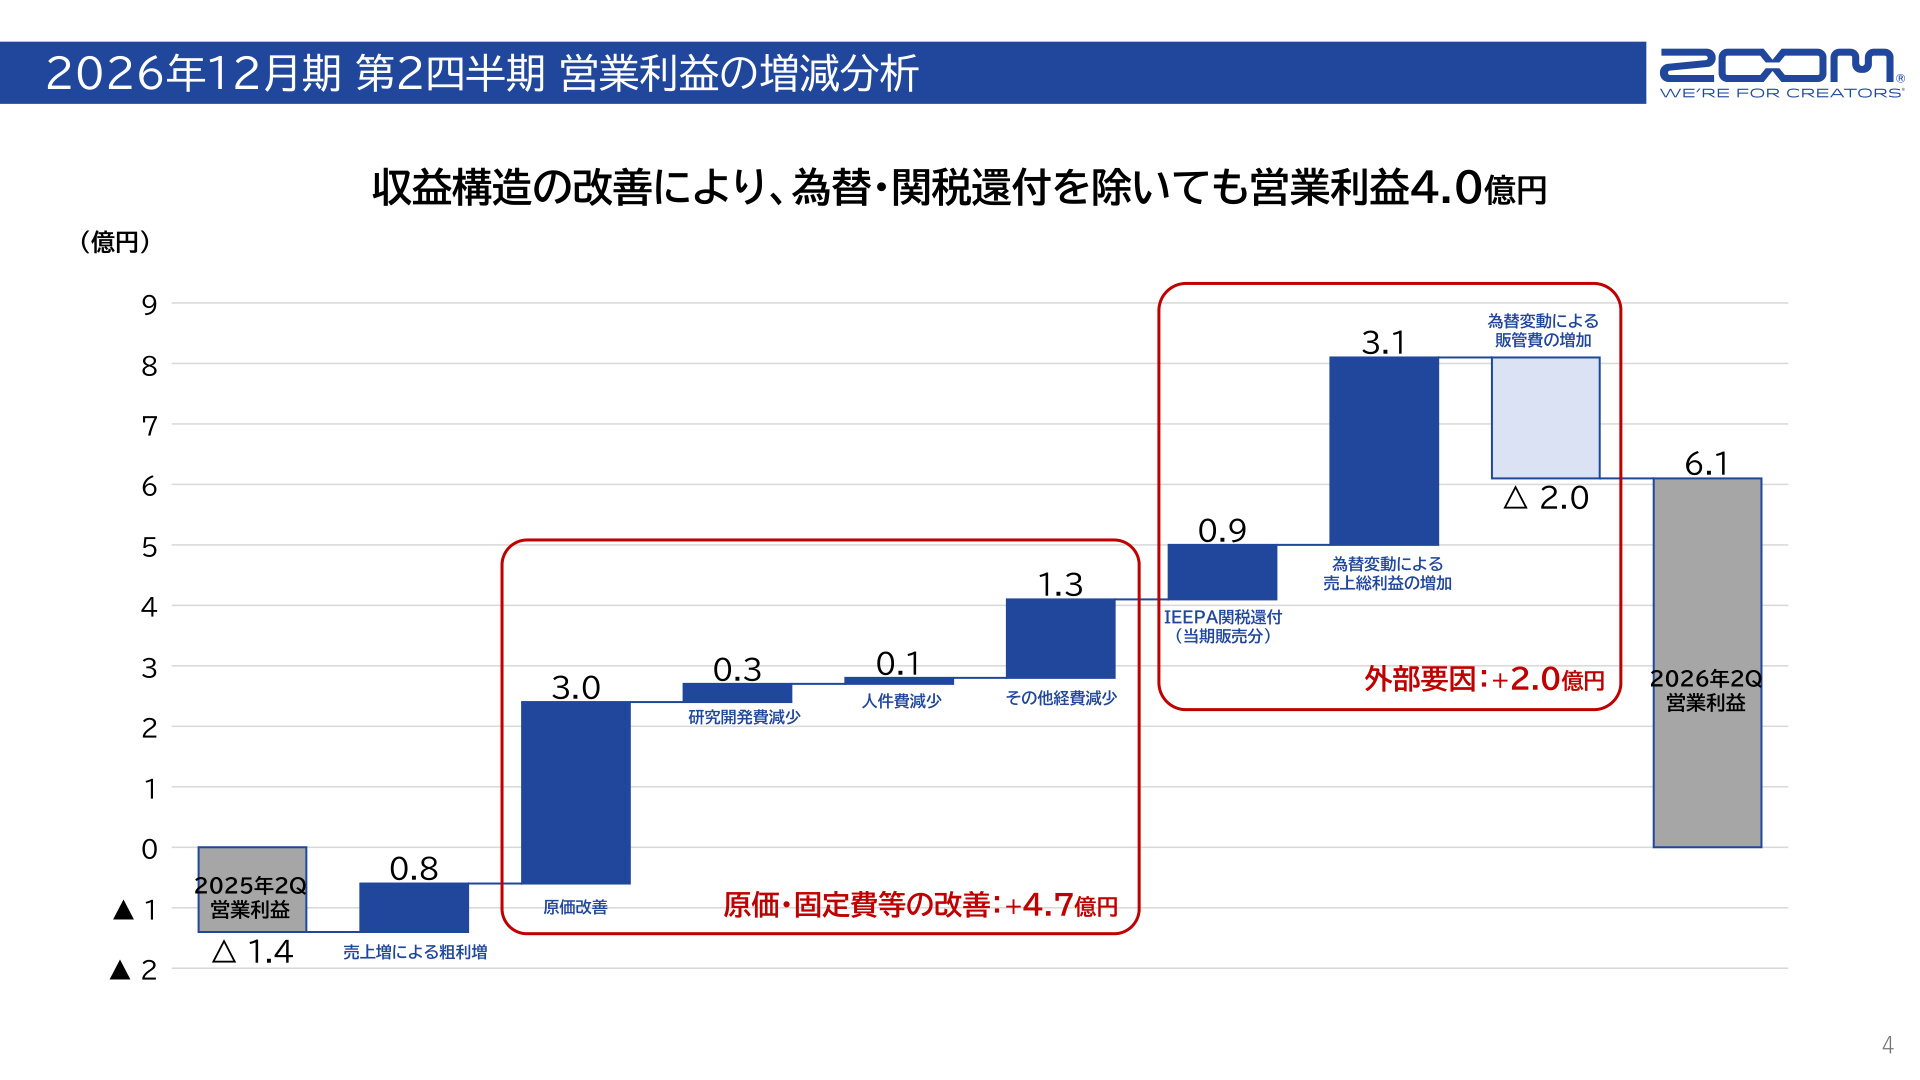
[Slide Commentary: Operating Profit Waterfall Analysis]
Slide visualizes the factors behind the profit change, separating "internal structural reform effects" from "external factors." This data is crucial for understanding that Zoom's recovery is not merely dependent on the weak yen, but is primarily driven by internal structural improvements (+¥470 million) .
Breakdown of factors:
-
Internal Measures & Structural Improvements (Total +¥470 million)
- Cost of Sales Improvement : +¥300 million (due to production efficiency and procurement reviews)
- Reduction in R&D Expenses : +¥30 million (optimization of development efficiency)
- Reduction in Personnel Expenses : +¥10 million
- Reduction in Other Expenses : +¥130 million (company-wide fixed cost reduction)
- Gross Profit Increase from Sales Growth : +¥80 million
-
External Factors (Total +¥200 million)
- IEEPA Tariff Refunds (Current period sales) : +¥90 million (deducted from cost of sales)
- Increase in Gross Profit due to FX : +¥310 million
- Increase in SG&A due to FX : -¥200 million (Net FX impact: +¥110 million)
As this analysis shows, even excluding external factors (+¥200 million), the company has shifted to a structure capable of generating ¥400 million in operating profit independently, proving the success of the reforms enacted in Q4 2025.
3. Market and Product Trends: Success of HAR/PFR and Regional Variations
Looking at product categories and regional performance, there is a clear contrast between growth-driving product lines and categories facing challenges.
Product Category Trends
- Handy Audio Recorder (HAR) : Sales surged from ¥1.46 billion to ¥1.96 billion (+34% YoY) , acting as the primary growth driver. In addition to improved sales of the "Essential Series," the "Studio Series" has contributed to revenue by capturing high-fidelity audio demand.
- Professional Field Recorder (PFR) : Sales expanded from ¥5.1 billion to ¥6.6 billion (+27% YoY) , bolstered by the growth of the "F2" and "F8n Pro" models, alongside positive currency effects.
- Digital Mixer / Multi Track Recorder (DMX) and Multi Effector (MFX) : DMX sales dipped from ¥9.2 billion to ¥8.9 billion , and MFX from ¥6.3 billion to ¥6.0 billion , indicating varying speeds of recovery across categories.
Regional Market Trends
- North American Market : While H1 sales (USD basis) remained flat YoY, sales of Handy Audio Recorders improved, particularly in the "Essential Series," with recovery seen in major online channels.
- European/Southern European Market : The "Sound Service" region (German HQ, SS UK) performed strongly in H1, exceeding the previous year in both sales and profit. The "Mogar" region (Southern Europe) was below the previous year in H1 but is currently showing signs of recovery.
- Japan and Other Markets : Domestic sales were down 2% YoY, and Hook Up, Inc. was down 8%, but "Other Regions" (China, Russia, UAE, etc.) performed well, up 43% YoY .
4. Financial Position and Cash Flow: Significant Recovery in Generating Power
Financial stability has improved in tandem with the recovery in profitability.
- Assets and Liabilities : Total assets at the end of Q2 FY2026 were ¥18.93 billion (+¥190 million from previous year-end) . Cash and deposits increased to ¥3.85 billion (+¥760 million), while inventory decreased to ¥7.6 billion (-¥180 million) due to the digestion of stock for the year-end shopping season. Total net assets reached ¥7.81 billion (+¥390 million) , strengthening equity.
- Cash Flow :
- Operating CF : Increased significantly from ¥590 million to ¥1.14 billion (+¥550 million YoY) , driven by income before income taxes of ¥630 million and a decrease in inventories (+¥420 million).
- Investing CF : -¥100 million (investment payments -¥70 million, acquisition of fixed assets -¥30 million).
- Financing CF : -¥330 million (offsetting ¥200 million in long-term borrowing with a net decrease in short-term debt of -¥70 million and long-term debt repayment of -¥20 million).
- As a result, the cash and cash equivalents balance at the end of the quarter was ¥3.79 billion , enhancing liquidity stability.
5. Revision of Full-Year Consolidated Earnings Forecast: Background and Extraordinary Items
Taking into account the strong H1 progress, the weak yen, and tariff refunds, Zoom has upwardly revised its full-year consolidated earnings forecast for FY2026.
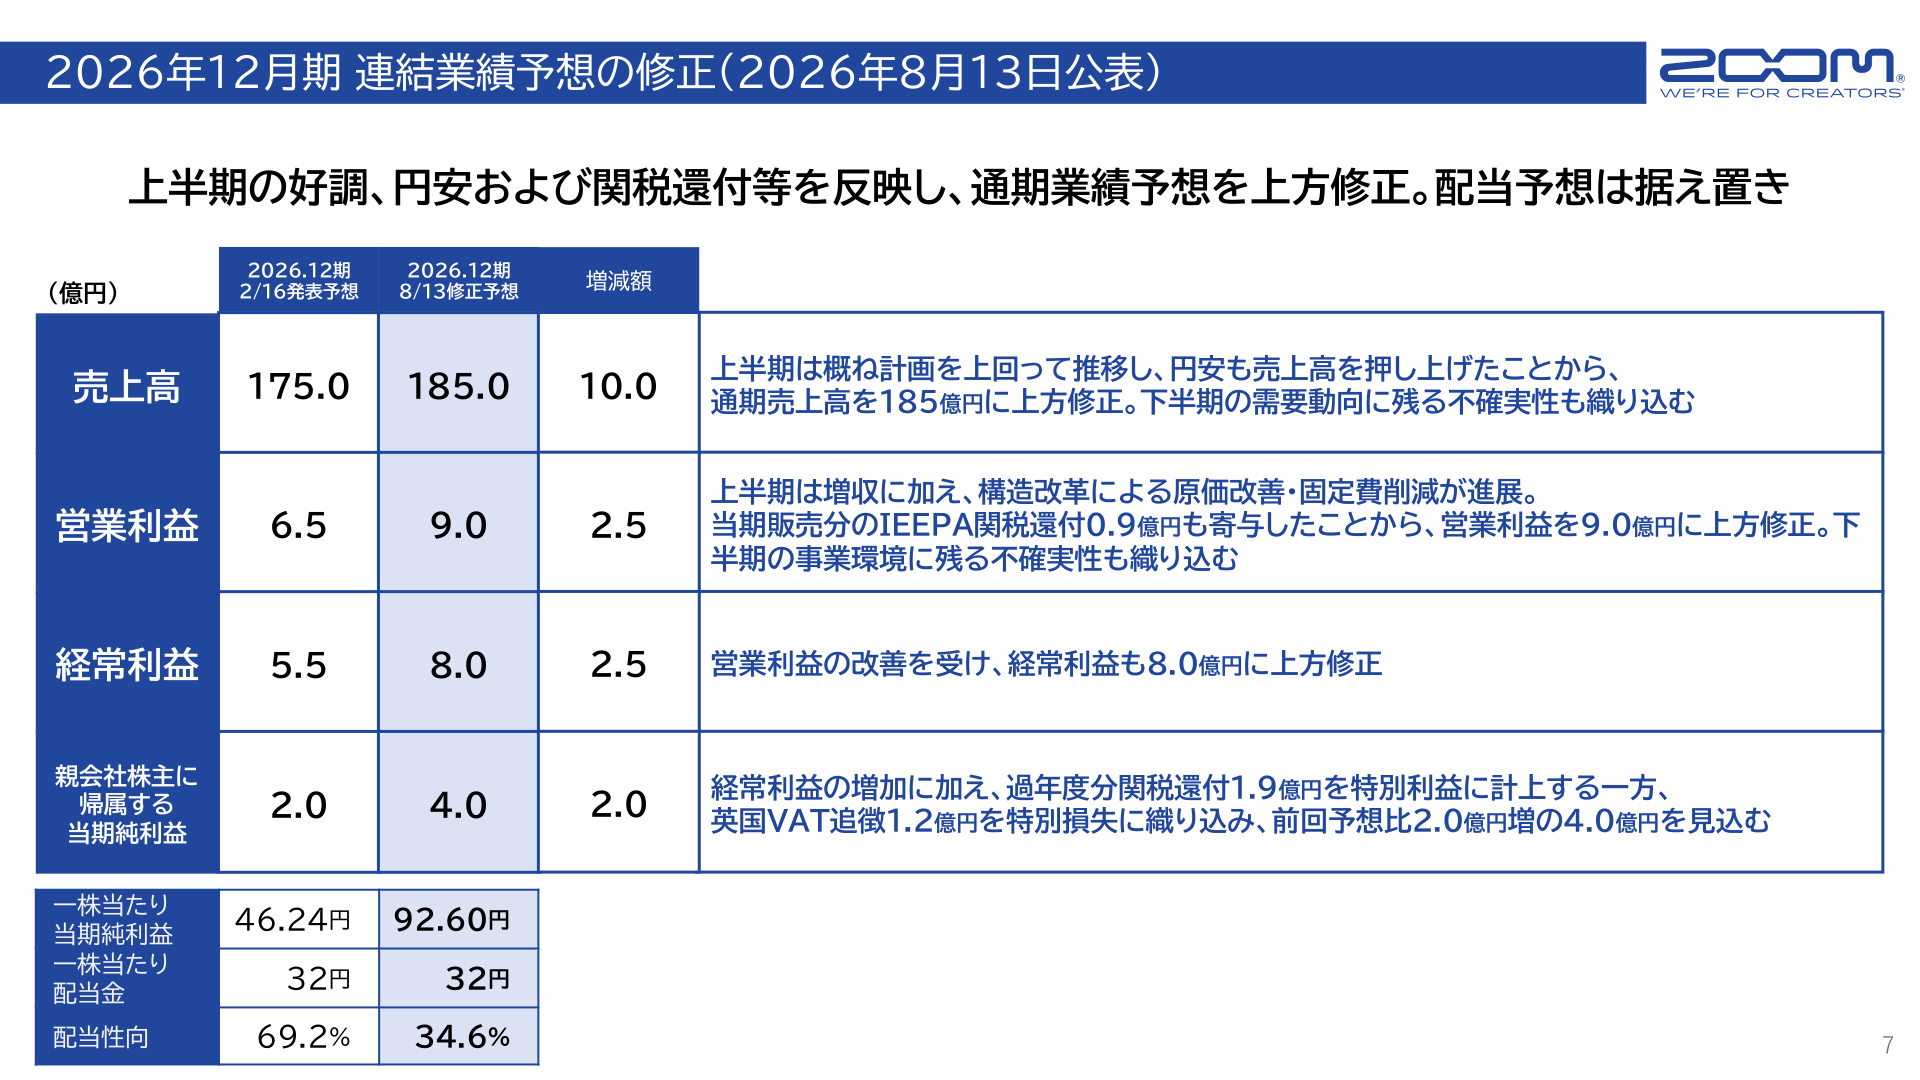
[Slide Commentary: Revision of FY2026 Full-Year Consolidated Earnings Forecast]
Slide compares the previous forecast (announced Feb 16, 2026) with the revised forecast (announced Aug 13), objectively showing the significant upgrade in the full-year outlook.
Key revisions:
- Full-Year Net Sales : Raised from ¥17.5 billion to ¥18.5 billion (+¥1.0 billion, +6.1% YoY) .
- Full-Year Operating Profit : Raised from ¥650 million to ¥900 million (+¥250 million, a turnaround of +¥950 million YoY) . This reflects sales growth, structural reforms (cost/fixed expense reduction), and the IEEPA tariff refund (¥90 million).
- Full-Year Ordinary Profit : Raised from ¥550 million to ¥800 million (+¥250 million) .
- Net Income Attributable to Owners of Parent : Doubled from ¥200 million to ¥400 million (+¥200 million) .
- Extraordinary Items :
- Extraordinary Income : +¥190 million for prior-year tariff refunds.
- Extraordinary Loss : -¥120 million for UK VAT assessments.
- Dividend Forecast : Maintained at ¥32.00 per share annually (expected payout ratio of 34.6%).
6. Mid-to-Long Term Topics: 20th Anniversary of Handy Recorder and Redefining Product Strategy
Zoom's flagship "Handy Recorder" series celebrated its 20th anniversary in 2026. The company continues to redefine product value to meet the evolving needs of creators.
- History and Evolution : Since the birth of the "H4" in 2006, followed by the "H4n" (2009) for DSLR video and the "H6" (2013) for podcasting, cumulative sales have surpassed 5 million units .
- New Value Creation : In response to market shifts like the rise of wireless mics and higher smartphone audio quality, the company launched the "Essential Series" (2024) to prevent clipping without level settings, and the "Studio Series" (2025) to compete on high-fidelity audio. These products aim to solve specific creator challenges.
Summary
Zoom Corporation's FY2026 Q2 results mark a milestone, with the effects of the structural reforms (cost and fixed expense reduction) implemented in 2025 resulting in a significant return to profitability with an operating profit of ¥610 million .
While benefiting from external tailwinds like the weak yen and tariff refunds, the primary driver of profit recovery (+¥470 million) remains internal structural reform. With the full-year forecast revised upward to ¥18.5 billion in sales and ¥900 million in operating profit, attention now turns to the continued growth of HAR/PFR products and the successful rollout of new product strategies.
This content is not intended as investment advice or a recommendation. Any opinions expressed are solely the personal views of each article.