

![[Rebase Q1 FY2027 Earnings] Revenue Grows 15% YoY, While Office Relocation Costs Impact Operating Profit: A Deep Dive into Strategic Investments and KPI Growth](https://news-images.stock-club.net/market_news/images/5138/140120260813519428/slide_eyecatch_en_cf41b893.webp)
[Rebase Q1 FY2027 Earnings] Revenue Grows 15% YoY, While Office Relocation Costs Impact Operating Profit: A Deep Dive into Strategic Investments and KPI Growth

StockClub
Published: Aug 13, 2026, 11:16 AM
Sentiment Analysis

Rebase Inc. (Securities Code: 5138) released its financial results for the first quarter of the fiscal year ending March 2027 (April–June 2026) on August 13, 2026. The company, which operates the rental space matching platform instabase , saw steady revenue growth of 15% year-on-year . However, the company reported an operating loss due to one-time expenses associated with an office relocation.
This report provides a detailed analysis based on 10 key topics derived from the disclosure materials, covering the background of the seemingly complex financial results, trends in major KPIs (number of bookings, average unit price, total transaction volume, and number of listed spaces), and future growth strategies.
1. Q1 Earnings Highlights: Revenue Growth and the Impact of One-Time Costs
The consolidated financial results for Q1 FY2027 are as follows:
- Revenue : 568 million JPY (+15% YoY)
- Operating Profit : -47 million JPY (vs. 61 million JPY profit in the same period last year)
- Net Profit : -18 million JPY (vs. 42 million JPY profit in the same period last year)
- Revenue Progress Rate : 24% against the full-year forecast of 2,400 million JPY (vs. 21% in the same period last year)
Revenue reached a record high, and the progress rate of 24% against the full-year forecast outperformed the 21% recorded in the same period last year, marking a strong start for the top line. While the bottom line shows an operating loss, this is primarily due to the concentration of one-time, non-recurring expenses related to the move to a new office.
2. Verification of "Adjusted Operating Profit" Excluding Relocation Costs
To correctly understand the background of the negative operating profit, it is necessary to examine the breakdown of the one-time expenses recorded this quarter.
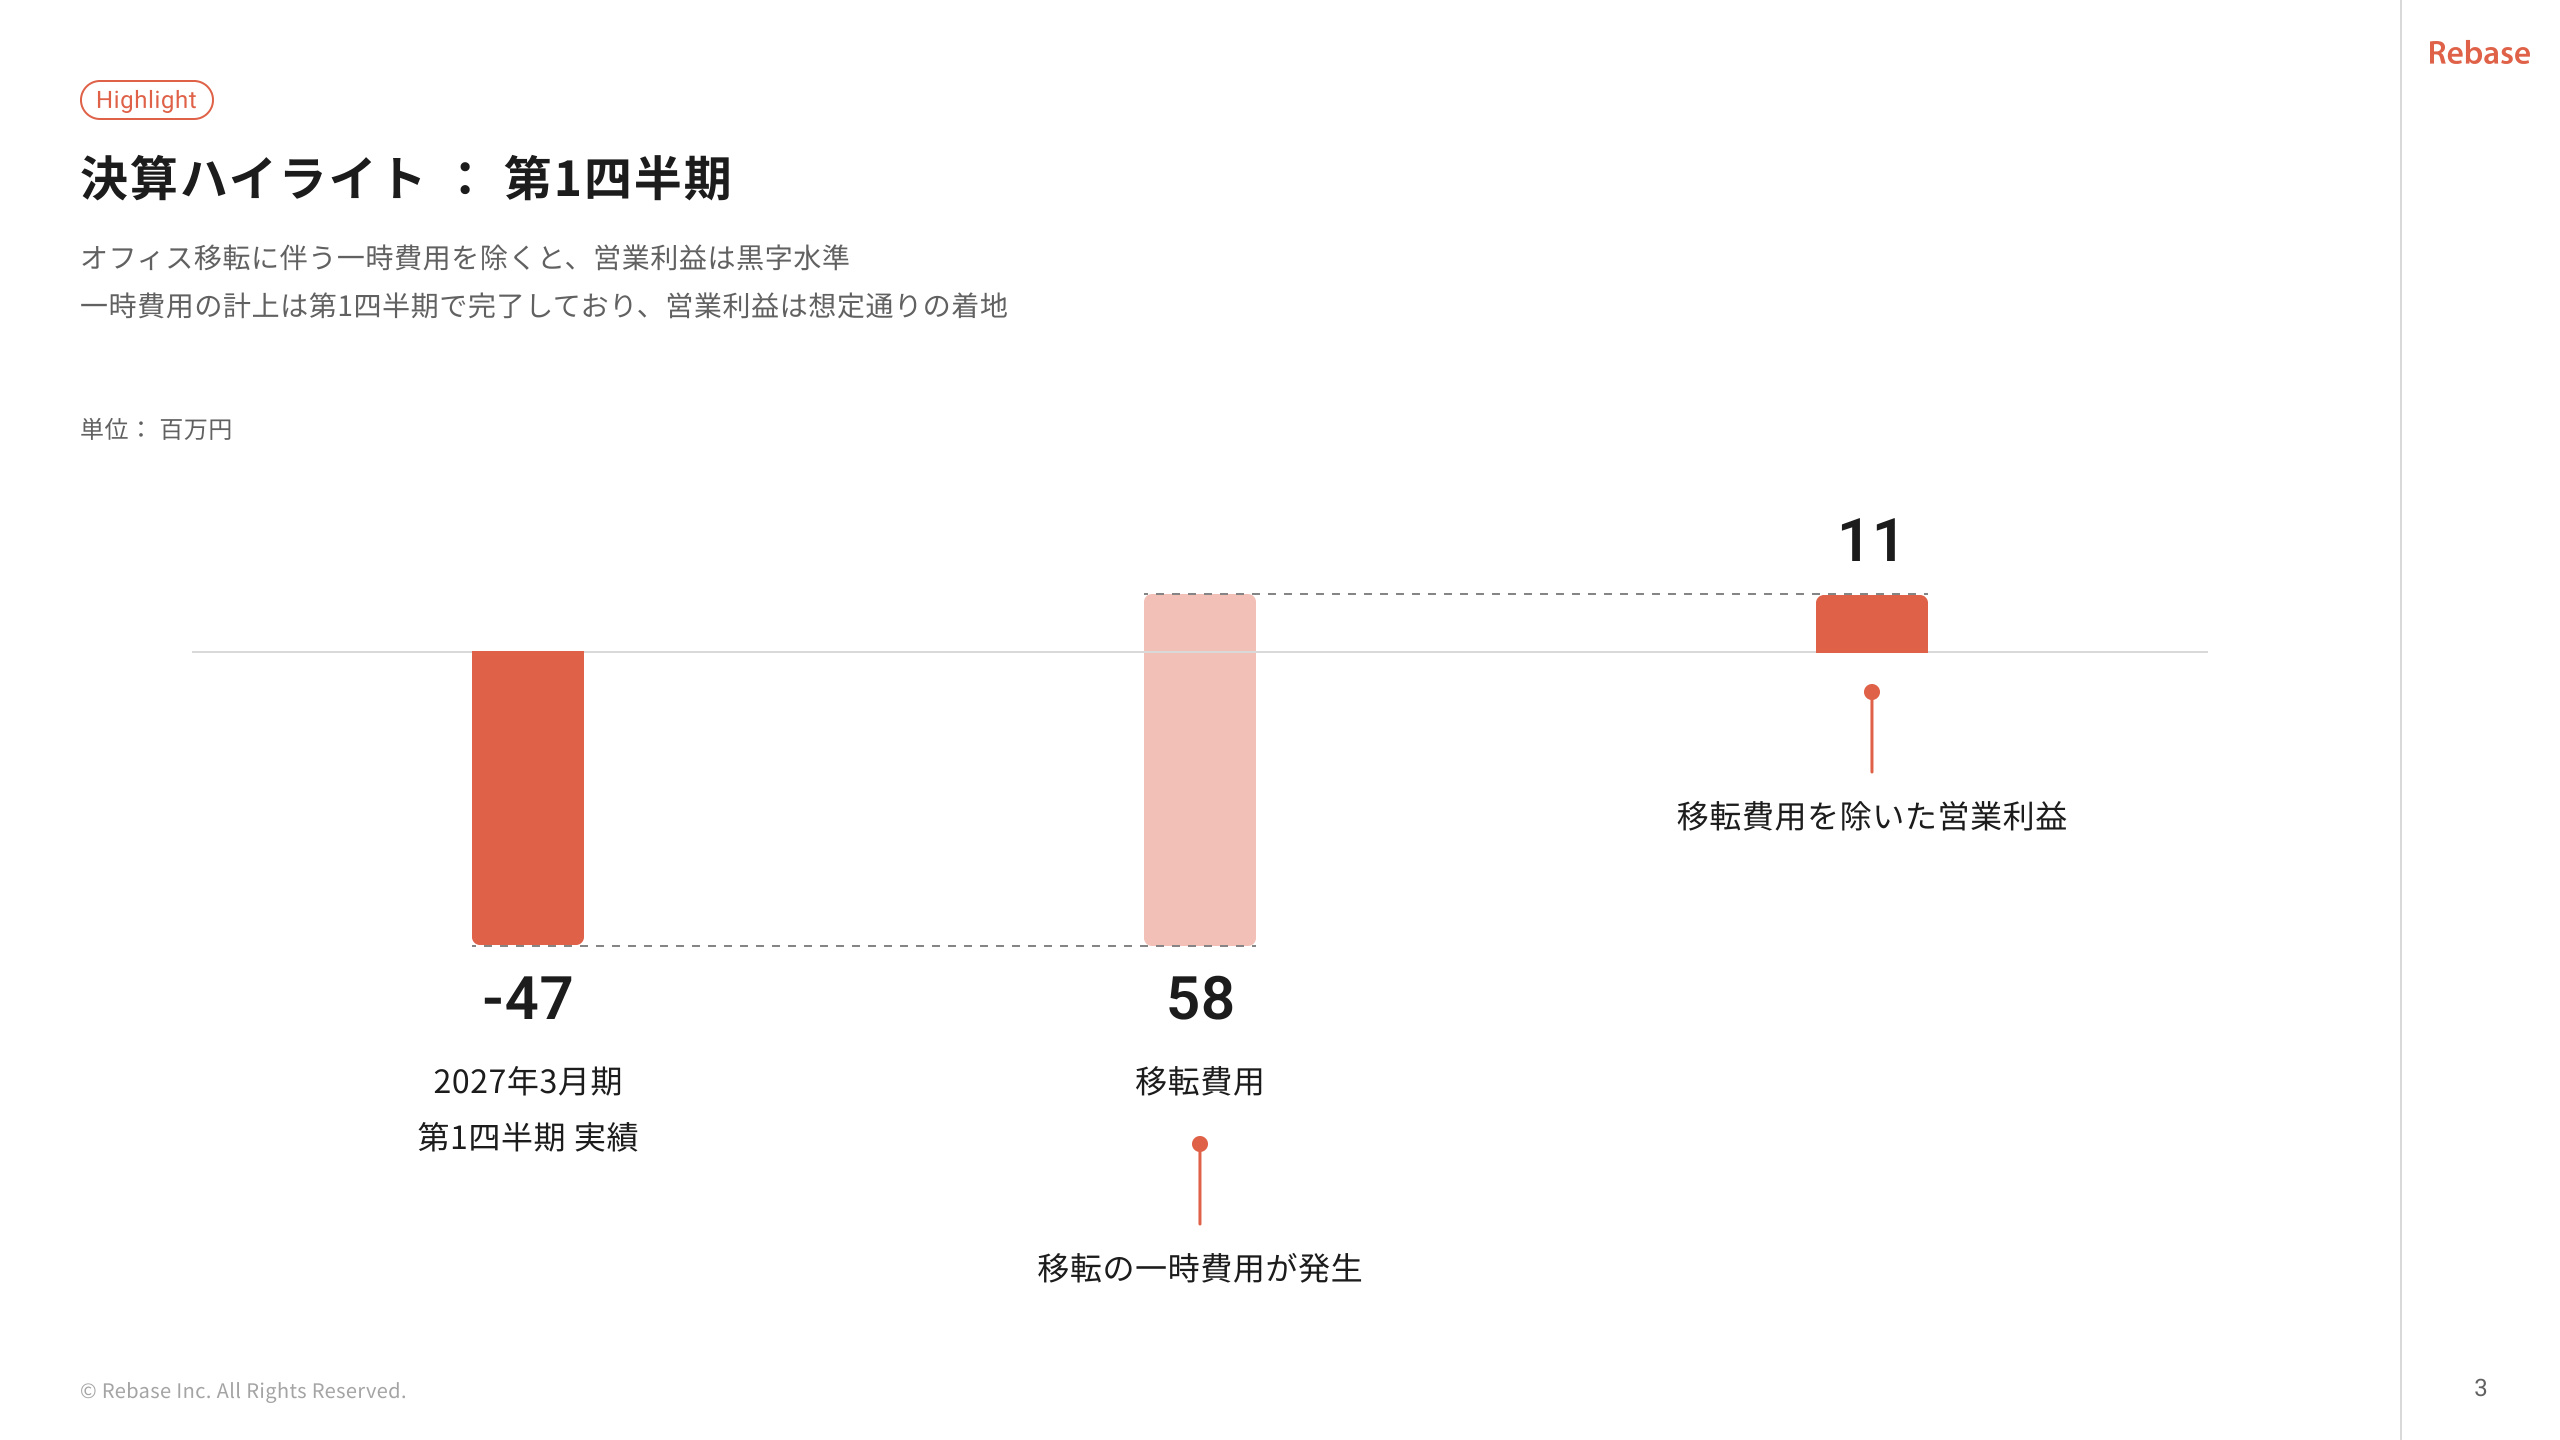
As shown in the chart above, one-time expenses related to the office relocation totaled 58 million JPY in Q1. If these temporary impacts, such as lump-sum depreciation and moving-related costs, are excluded, the adjusted operating profit remains at a surplus level of 11 million JPY .
According to the company, all one-time expenses related to the office relocation were fully accounted for during the first quarter , and no such significant one-time costs will occur from the second quarter onward. Therefore, this operating loss was in line with the company's initial plan and does not indicate a structural decline in the profitability of the core business.
3. Trends and Progress of Key KPIs
The four key KPIs that demonstrate the foundation of the instabase business ( number of bookings , average unit price , total transaction volume , and number of listed spaces ) all showed growth compared to the same period last year.
① Growth in Number of Bookings
Space bookings reached 453,000 (+11% YoY) in Q1, setting a new record. This success is attributed to the optimization of existing customer acquisition channels and the development of new ones. The progress rate against the full-year target of 1,904,000 is 24% .
② Upward Trend in Average Unit Price
The average unit price was 4,300 JPY (+3% YoY). The increase in usage for "hobbies, entertainment, and leisure," such as live viewing and parties, led to longer usage times and a higher utilization rate of premium-priced spaces, contributing to the rise in unit price.
③ Steady Accumulation of Total Transaction Volume
"Total transaction volume," calculated by multiplying the number of bookings by the average unit price, is a metric that directly reflects top-line growth.
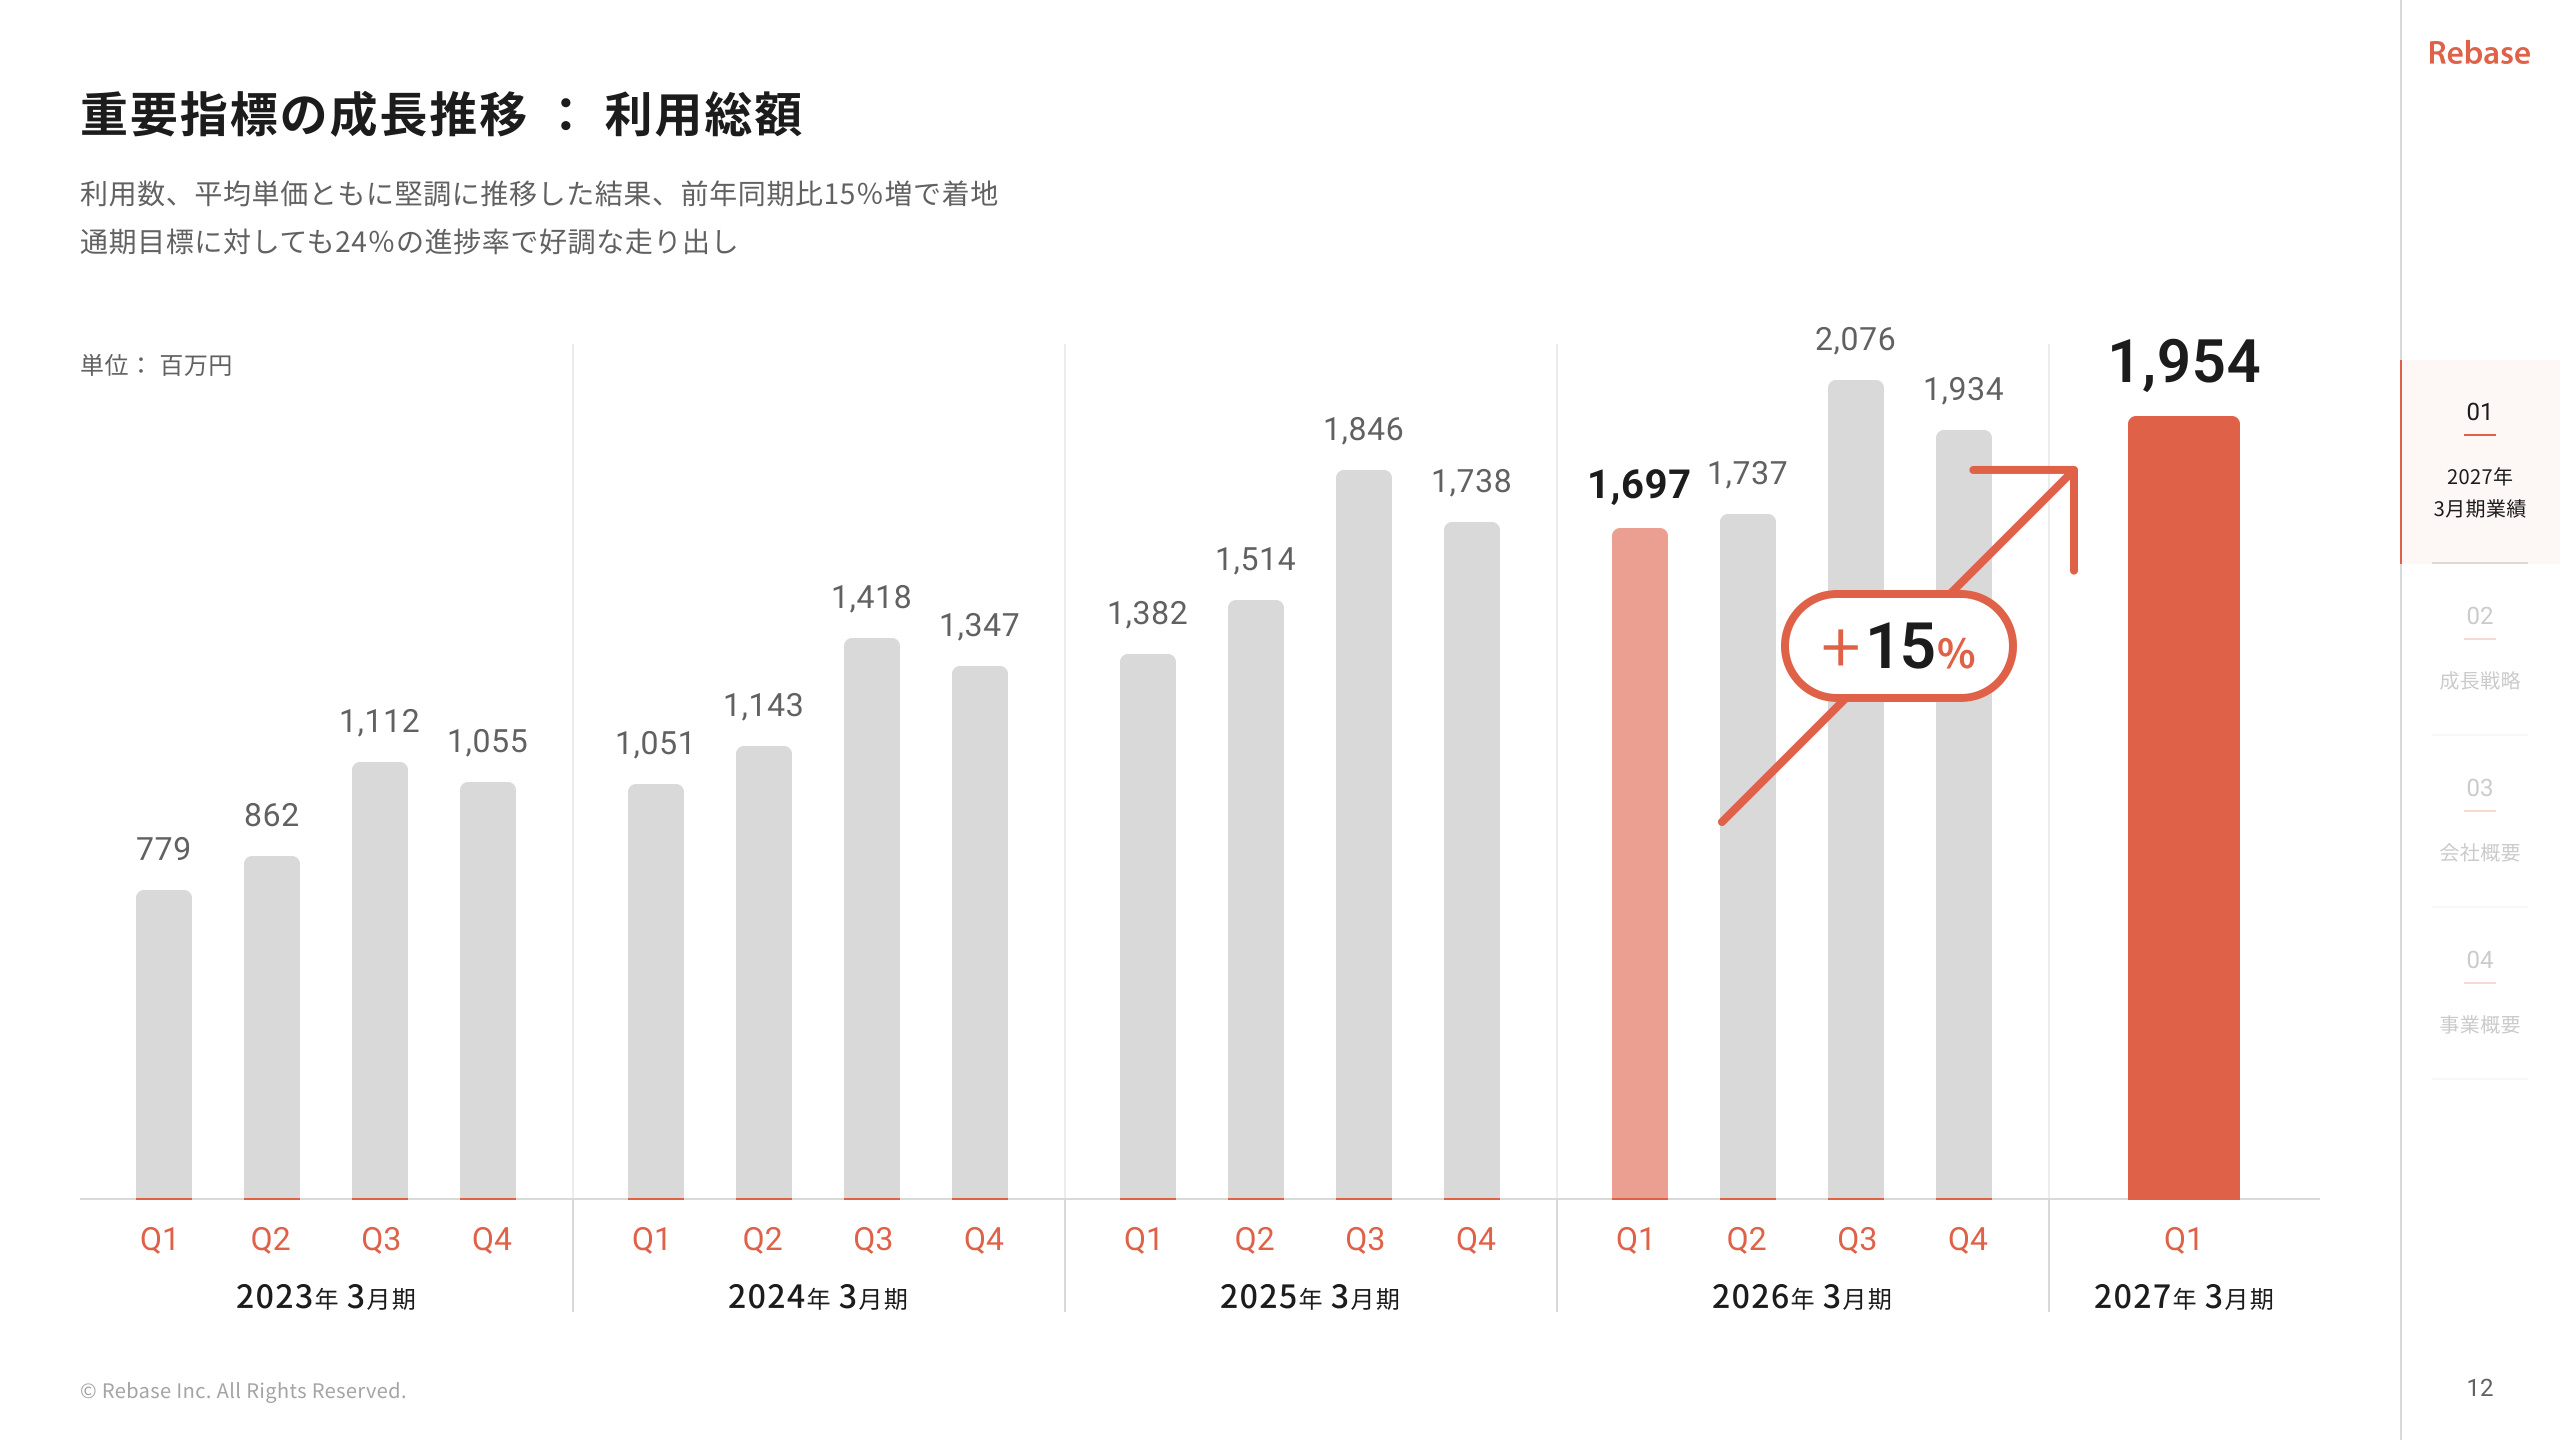
Total transaction volume in Q1 was 1,954 million JPY (+15% YoY), showing steady scaling from the 1,697 million JPY recorded in the same period last year. This represents 24% progress against the full-year target of 8.16 billion JPY , indicating a strong start in line with the plan.
④ Increase in Number of Listed Spaces
The number of listed spaces, which indicates the platform's supply capacity, increased to 47,900 (+14% YoY). The net increase in Q1 was 1,400, representing a 28% progress rate against the full-year target (an annual increase of 5,000), showing that the expansion of the supply system is progressing at a pace slightly ahead of the plan.
4. Analysis of SG&A Expenses and Investment Direction
Total SG&A expenses for the quarter were 594 million JPY , a significant increase of 179 million JPY (+43%) from 415 million JPY in the same period last year. The structural breakdown is summarized in the slide below.
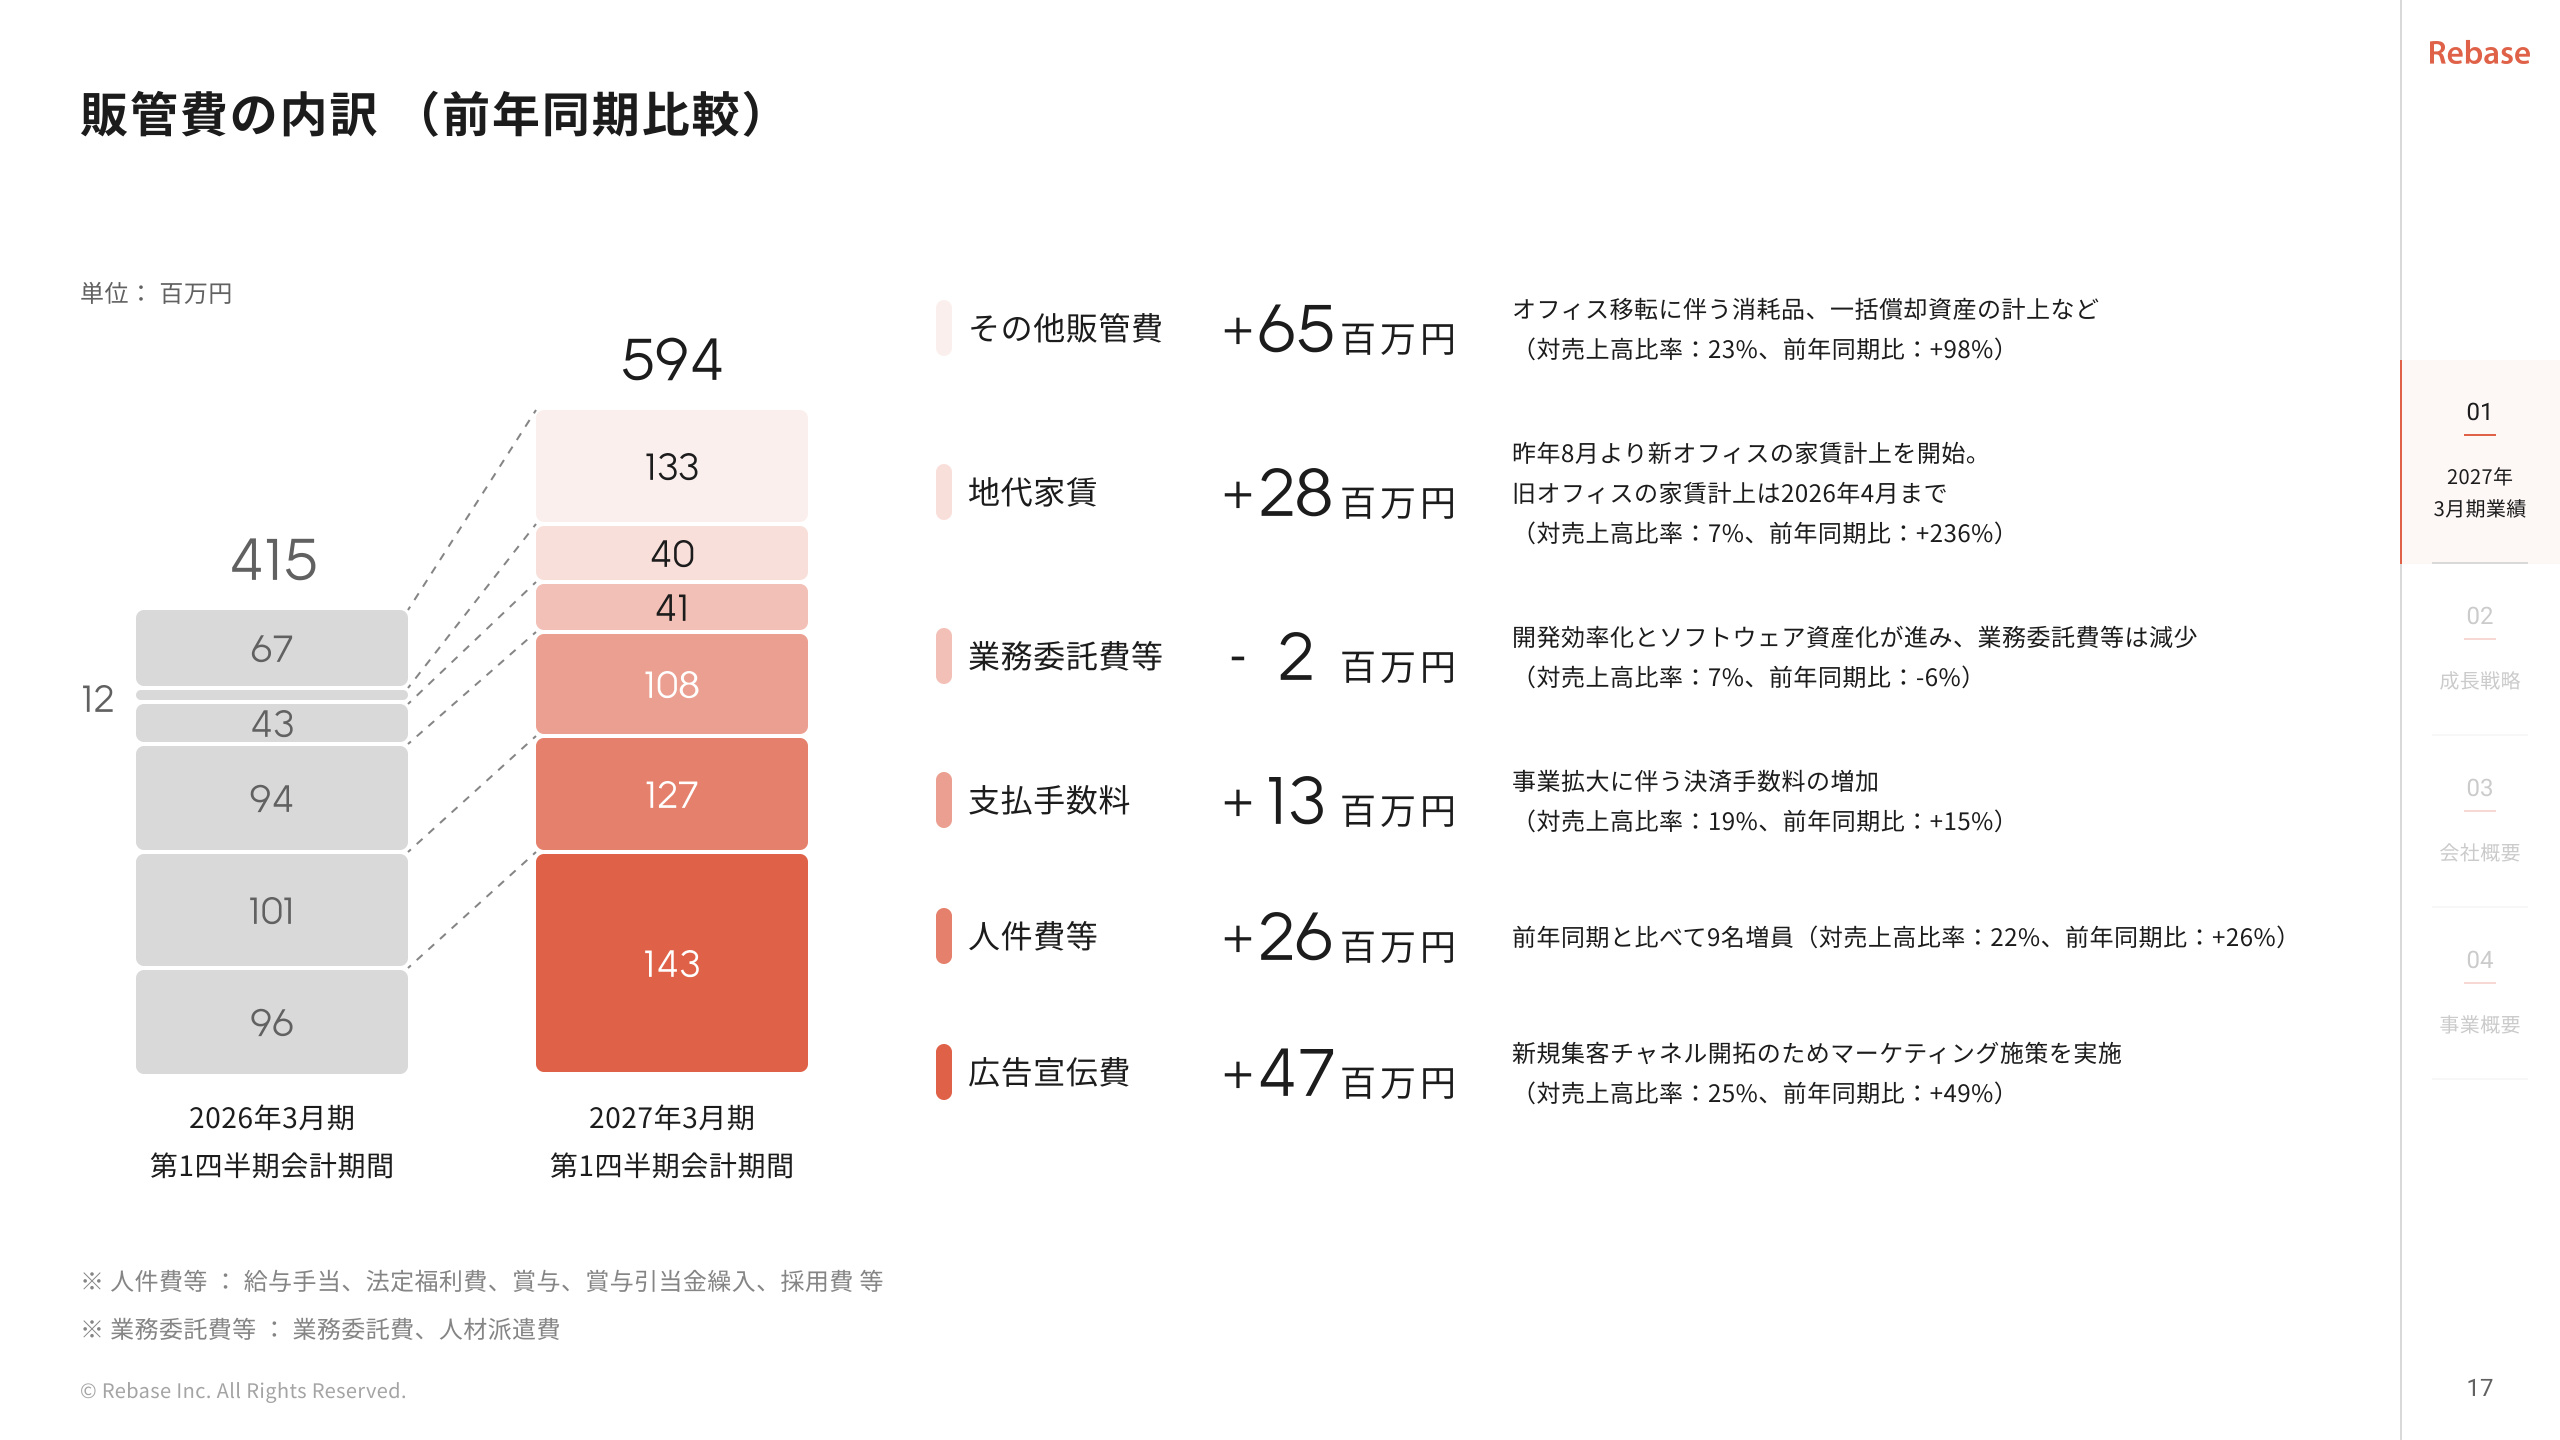
Factors for the increase can be broadly categorized into "one-time expenses/capital investment-related items" and "proactive upfront investments for business growth."
- Office Relocation-Related Expenses (One-time/Rent)
- Other SG&A : 133 million JPY (+65 million JPY YoY / one-time costs, supplies, lump-sum depreciation, etc.)
- Rent : 40 million JPY (+28 million JPY YoY / increase due to new office rent)
- Upfront Investments for Business Growth
- Advertising Expenses : 143 million JPY (+47 million JPY YoY / marketing reinforcement for new channel development)
- Personnel Expenses : 127 million JPY (+26 million JPY YoY / 9 additional employees compared to the same period last year)
- Payment Commissions : 108 million JPY (+13 million JPY YoY / variable costs associated with increased transaction volume)
Notably, the ratio of advertising expenses to revenue is 25% , which is lower than the 31% seen in Q4 of the previous fiscal year, suggesting that marketing is being operated with improved efficiency.
5. Growth Strategy and Key Q1 Topics
To "maximize total transaction volume," the company is pursuing a four-pillar strategy: strengthening customer acquisition , optimizing UI/UX , increasing average unit price , and maximizing the number of listed spaces . This quarter saw a series of collaborative initiatives with major external partners.
- Integration with Reserve with Google Implemented a system allowing users to book instabase spaces directly from Google Search and Google Maps results. This reduces friction from search to booking, aiming to acquire new users and improve conversion rates.
- Service Partnership with Lawson United Cinemas Began listing approximately 300 screens across 38 theaters nationwide on instabase, creating a new space category: " Movie Theaters/Cinemas ."
- Partnership with Vision Center Listed large-scale conference rooms and event halls near major stations in central Tokyo and the Yokohama area, strengthening the capture of demand for large-group usage.
- Partnership with THE HUB Added 228 spaces from "THE HUB," a flexible workspace network across major cities nationwide, expanding locations for business users.
6. Seasonality and Full-Year Outlook
The instabase business has clear seasonal fluctuations. Demand and awareness typically peak in the third quarter (October–December) , when events and gatherings increase.
According to the disclosure, the balance of key indicators like annual total transaction volume is structured to be weighted toward the second half, with 46% in the first half (Q1–Q2) and 54% in the second half (Q3–Q4) . Given this seasonality, achieving 24% of the full-year target for revenue and total transaction volume in Q1 is considered a very steady pace.
With one-time office relocation expenses fully processed in Q1, the profit structure is expected to shift from Q2 onward, where top-line growth will more directly contribute to operating profit.
7. Conclusion
Although Rebase reported an operating loss in Q1 FY2027 due to one-time office relocation expenses, the company's core fundamentals remain extremely robust, evidenced by a 15% YoY revenue increase , an adjusted operating profit of 11 million JPY , and steady growth in key KPIs.
With ongoing initiatives to strengthen the platform's network effects—such as Google integration and expanded alliances with major facility operators—the company's performance in the upcoming peak demand season in the second half will be a key point to watch.
This content is not intended as investment advice or a recommendation. Any opinions expressed are solely the personal views of each article.