


GMO TECH Holdings Q2 FY2026 Earnings Deep Dive: Performance Growth Driven by Recurring 'AI SaaS' and Integration Synergies

StockClub
Published: Aug 13, 2026, 10:45 AM
Sentiment Analysis

GMO TECH Holdings K.K. (Securities Code: 415A) reported significant growth in both revenue and profit for the second quarter of the fiscal year ending December 2026. This performance was driven by the realization of scale benefits from the business integration with DesignOne Japan and Tryhatch , alongside the steady growth of its core AI SaaS business .
This report extracts 10 core topics from the disclosed earnings materials that investors should monitor, providing a detailed analysis of the company's performance highlights, business structure transformation, segment-specific trends, and future growth strategies.
1. Earnings Summary and Performance Highlights
The consolidated financial results for the first half of the fiscal year ending December 2026 are as follows:
- Net Sales : 4,179 million JPY (up 1,071 million JPY YoY)
- Operating Profit : 287 million JPY (up 59 million JPY YoY)
- Ordinary Profit : 325 million JPY (up 143 million JPY YoY)
- Quarterly Net Profit Attributable to Owners of Parent : 211 million JPY (up 63 million JPY YoY)
In addition to the revenue contribution from the business integration, the successful scaling of the high-margin AI SaaS business significantly boosted overall performance.
2. Trends in Consolidated Sales/Operating Profit and Changes in Revenue Structure
Quarterly performance trends reveal a more pronounced growth momentum.
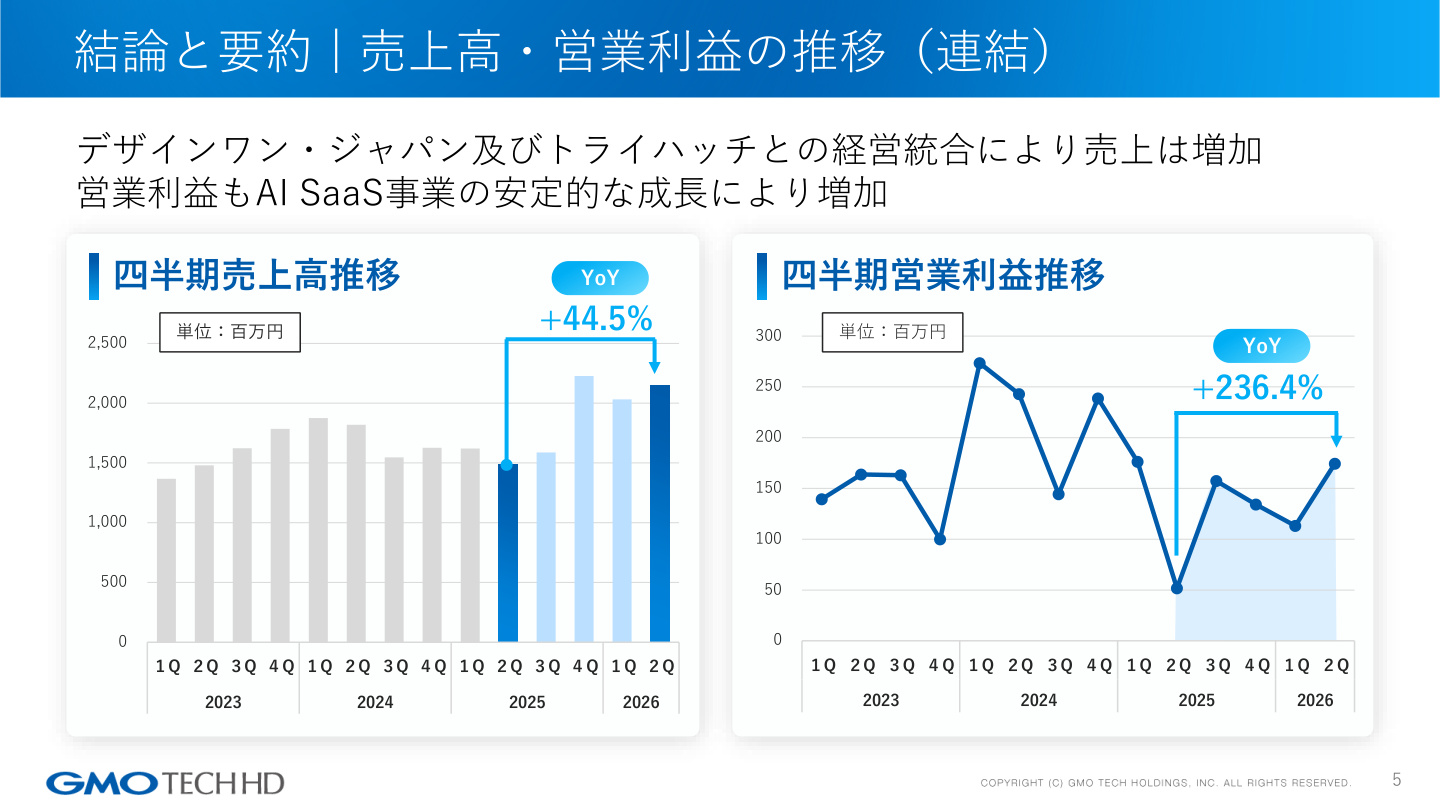
Why this slide is important (Background and significance of the data)
The slide above provides critical data on the quarterly trends in consolidated net sales and operating profit . In Q2 2026 alone, the company achieved remarkable growth, with net sales up 44.5% YoY and operating profit up 236.4% YoY . This data reflects more than just revenue gains from external acquisitions; it signifies a structural shift as the Post-Merger Integration (PMI) with group companies (such as DesignOne Japan and Tryhatch) progresses, and the AI SaaS business enters a phase where recurring revenue consistently exceeds fixed costs to generate profit . Compared to previous quarters, the company has achieved a clear V-shaped recovery from the operating profit bottom (50 million JPY in Q2 2025), visualizing the qualitative improvement in its earnings base.
3. Analysis of Operating Profit Variance
Analyzing the variance in operating profit from the same period last year (Q2 2025: 228 million JPY) to the current period (Q2 2026: 287 million JPY) highlights both growth engines and challenges:
- Positive Factors : The increase in profit from Map Optimization + Real Estate DX SaaS made an overwhelming contribution of +204 million JPY . Additionally, efficiency improvements in administrative expenses provided a +13 million JPY boost.
- Negative Factors : The delayed recovery of the affiliate business resulted in -39 million JPY , while the impact of goodwill amortization related to DesignOne Japan (DO) and Tryhatch (TH) accounted for -95 million JPY , with consolidated adjustments totaling -24 million JPY .
The structure shows that the overwhelming profit growth of the SaaS business (+204 million JPY) completely covered temporary and structural profit-reducing factors, such as goodwill amortization and sluggishness in certain flow-based businesses, to achieve a net increase.
4. Structural Transformation to Recurring 'AI SaaS' Business
The company's greatest strength lies in its successful transition from a traditional flow-based business model to a recurring-revenue stock business (AI SaaS) .
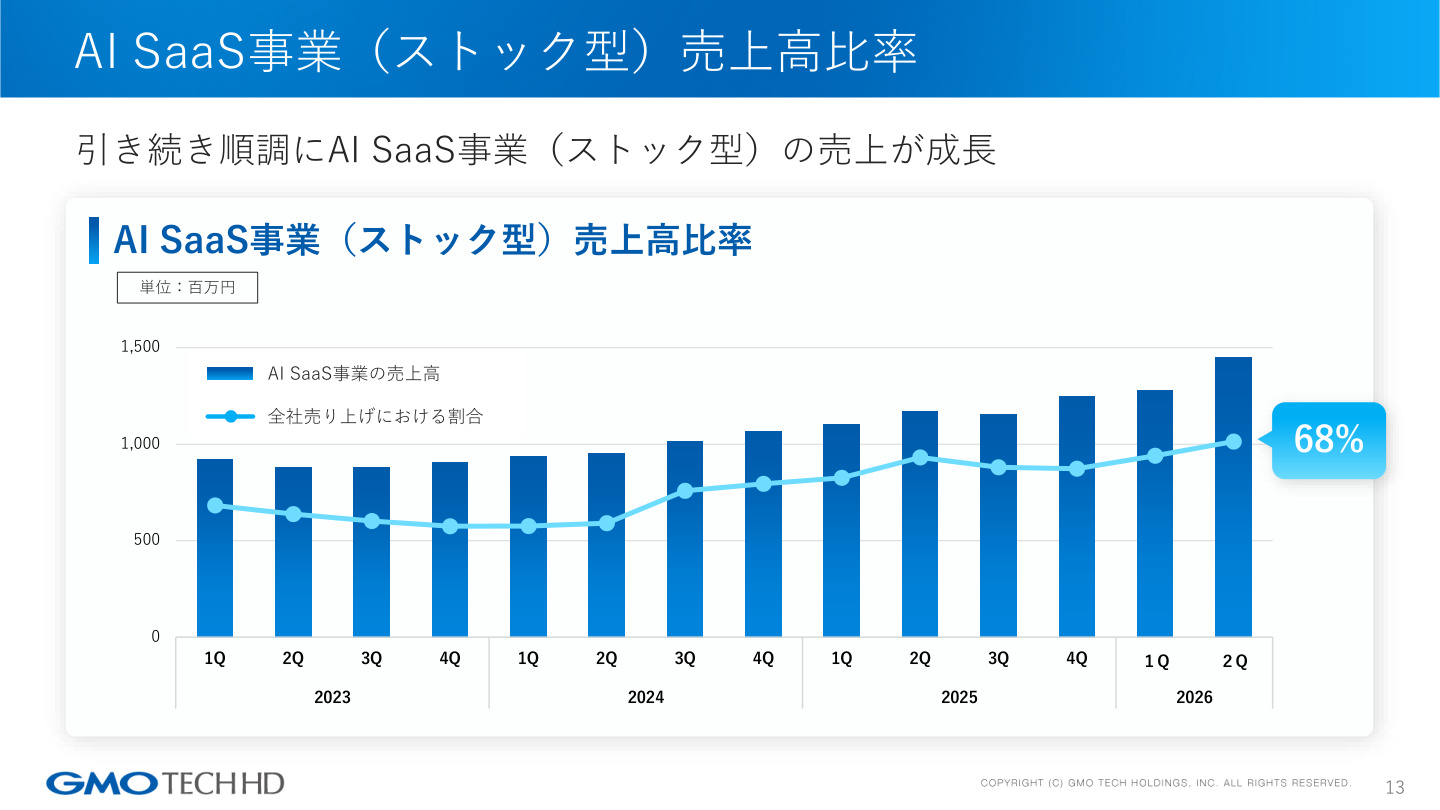
Why this slide is important (Background and significance of the data)
This slide illustrates the trend in the revenue ratio of the AI SaaS business (recurring type) as a percentage of total company sales. In Q2 2026, the ratio of recurring revenue reached a record high of 68% . This data indicates that the company has transformed into a 'highly predictable and stable high-profit' entity, less susceptible to economic fluctuations or temporary advertising demand. The ratio, which was in the high 50% range in 2023, has been steadily rising, demonstrating that the accumulation of recurring revenue is driving company-wide growth.
5. AI SaaS Business Segments and Marketing SaaS (Map Optimization/MEO) Trends
The company's AI SaaS business is primarily developed along two axes: 'Marketing SaaS' and 'Real Estate DX SaaS.'
Marketing SaaS (Map Optimization/Google/AI Measures)
- Product Portfolio : Includes 'MEO Dash! byGMO' for small-to-medium stores, 'MEO CHEKI byGMO' for large chains, and SEO/GEO tools ( 'SEQ Dash!' , 'GEO Dash!' ).
- Market Position : Achieved No. 1 domestic market share for 3 consecutive years in the small-to-medium store segment. The number of stores using these services, including large chains, has exceeded 100,000 , with the company holding marketing data for a total of 200,000 stores.
- Performance Trends : Map optimization revenue grew steadily by 38% YoY , bolstered by the consolidation of GMO Tryhatch, reaching a record high in quarterly sales.
- Churn Rate : The monthly customer churn rate remains at an extremely low level of 1.15% , proving high customer satisfaction and a stable recurring revenue base.
6. Full-Scale Monetization of Real Estate DX SaaS (GMO Rental DX)
'Real Estate DX SaaS,' which supports operational efficiency for property management companies, continues to expand rapidly as the company's second growth pillar.
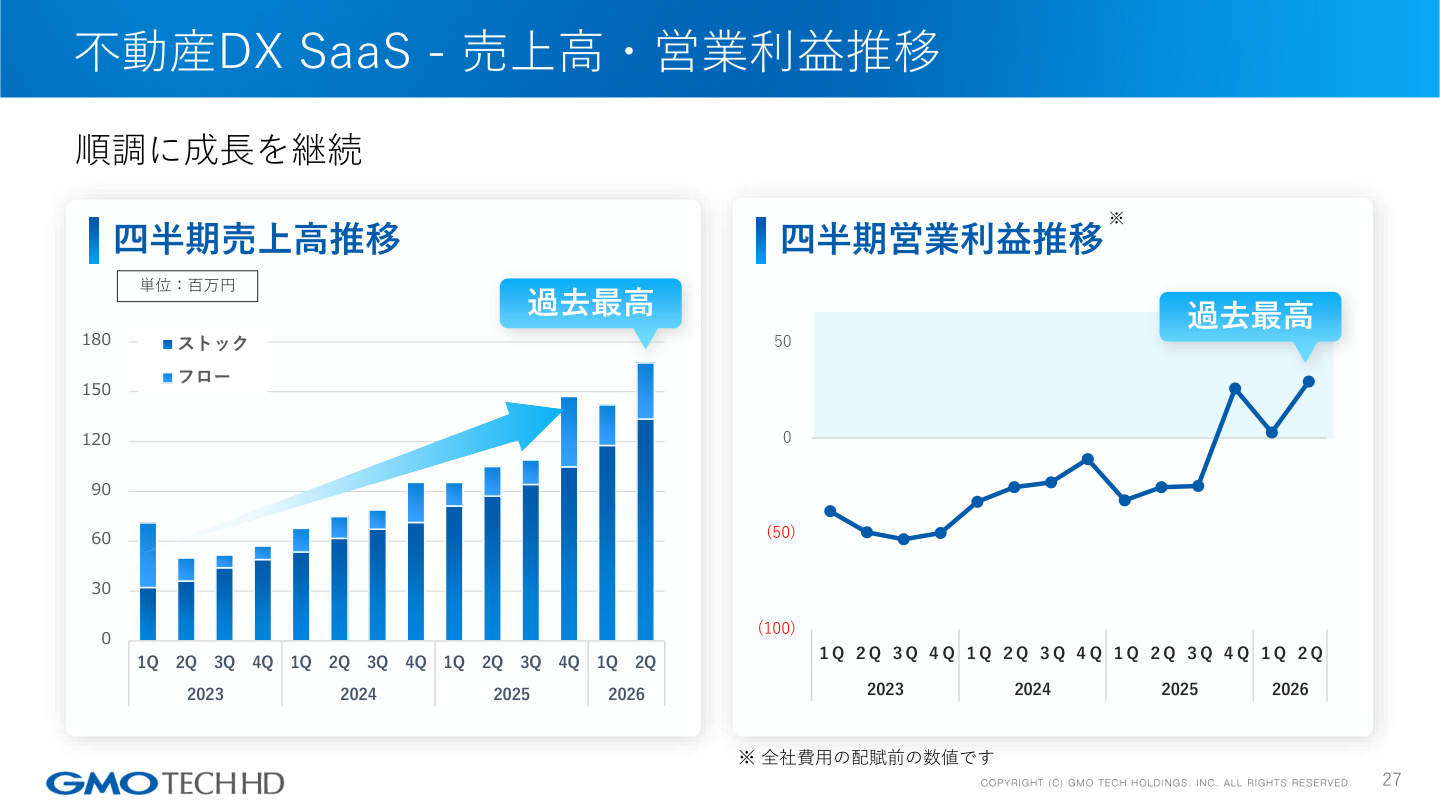
Why this slide is important (Background and significance of the data)
This slide shows the quarterly trends in revenue and operating profit for Real Estate DX SaaS . In the SaaS business, there is typically a period of 'J-curve' losses due to upfront development and sales investments during the launch phase. This graph proves that as a result of the steady accumulation of layered recurring revenue (dark blue section), operating profit has clearly turned positive, with both sales and operating profit reaching record highs . This is a strategically vital slide, demonstrating that the company's competitive advantage in the real estate app market has begun to bear fruit in terms of profitability.
Key KPIs and Strengths of Real Estate DX SaaS
- Number of Owners : Surpassed 350,000 as of June 2026 (a dramatic increase YoY).
- Track Record : Implemented by over 220 real estate management companies .
- Churn Rate : The recent gross revenue churn rate is an exceptionally low 0.23% . Once implemented, the service becomes deeply integrated into operations, making it highly resistant to churn.
- Competitive Advantage : While competitors often limit themselves to 'owner apps' or 'tenant apps' only, the company provides an integrated database covering owner apps, tenant apps, and owner CRM , and possesses extensive experience in API integration with management software.
7. Market Size and Mid-to-Long-Term Growth Opportunities
The markets targeted by the company are expected to continue showing high growth:
- Domestic MEO (Map Optimization) Market : Expected to grow steadily from 19 billion JPY in 2023 to 30.6 billion JPY by 2028 .
- Real Estate Tech Market : According to Yano Research Institute, the market is expected to grow rapidly from 940.2 billion JPY in FY2022 to 1.59 trillion JPY in FY2025 , and over 2.37 trillion JPY by FY2030 , providing a significant tailwind.
- Market Share Expansion Goal : The company plans to increase its share in the real estate app service market from 10% in 2026 to 14% by 2028 .
8. Future Growth Strategy and Action Plan
To further accelerate the growth of the AI SaaS business, the following three priority measures have been established:
- Evolution into an Overwhelming No. 1 Product : Continuous monthly product updates and expansion of the product lineup.
- AI and Productivity Innovation : Proactively implementing generative AI and RPA into product functions and internal operations to dramatically improve productivity. Aggressive recruitment of AI talent.
- Customer Base and Revenue Expansion : Strengthening sales personnel, enhancing training programs, refining roles by product category, and strengthening/scrutinizing the partner network.
9. Conclusion and Summary
GMO TECH Holdings' Q2 FY2026 earnings report reflects the solid growth of its recurring AI SaaS business and the synergies from M&A and business integration in its financial figures (Sales +44.5%, Operating Profit +236.4%).
In particular, the fact that the recurring revenue ratio reached 68% of total sales, the over 100,000 stores using Marketing SaaS, and the 350,000 owners reached by Real Estate DX SaaS alongside record-high operating profits, all indicate that the company's business model has entered a robust profit phase. Supported by low churn rates and high market growth, the earnings results suggest further realization of integration synergies and productivity improvements through the utilization of AI technology.
This content is not intended as investment advice or a recommendation. Any opinions expressed are solely the personal views of each article.