


GMO Financial Gate: Q3 FY2026 Earnings Deep Dive Report

StockClub
Published: Aug 13, 2026, 10:39 AM
Sentiment Analysis
Introduction: Overview of Q3 FY2026 Financial Results
GMO Financial Gate, Inc. (Securities Code: 4051) , a provider of cashless payment platforms for face-to-face transactions, has announced its financial results for the third quarter (cumulative) of the fiscal year ending September 2026. Driven primarily by robust growth in recurring-type (stock, fee, and spread) revenue, the company achieved significant year-on-year increases in both top-line revenue and profits at all levels.
Performance momentum has been particularly bolstered by the full-scale activation of merchants in the daily-life sector, such as major drugstore chains and large-scale commercial facilities, as well as the rapid expansion of contactless payment adoption in the mobility (public transportation) sector. This report provides a multi-faceted analysis of the company's recent performance and its mid-to-long-term growth story, centered on 10 key topics extracted from the earnings materials.
Chapter 1: Analysis of Key Performance Highlights and Revenue Structure
First, we examine the overall performance trends and the breakdown of results for the cumulative third quarter.
1. Overview of Cumulative Q3 Results and Progress Against Full-Year Targets
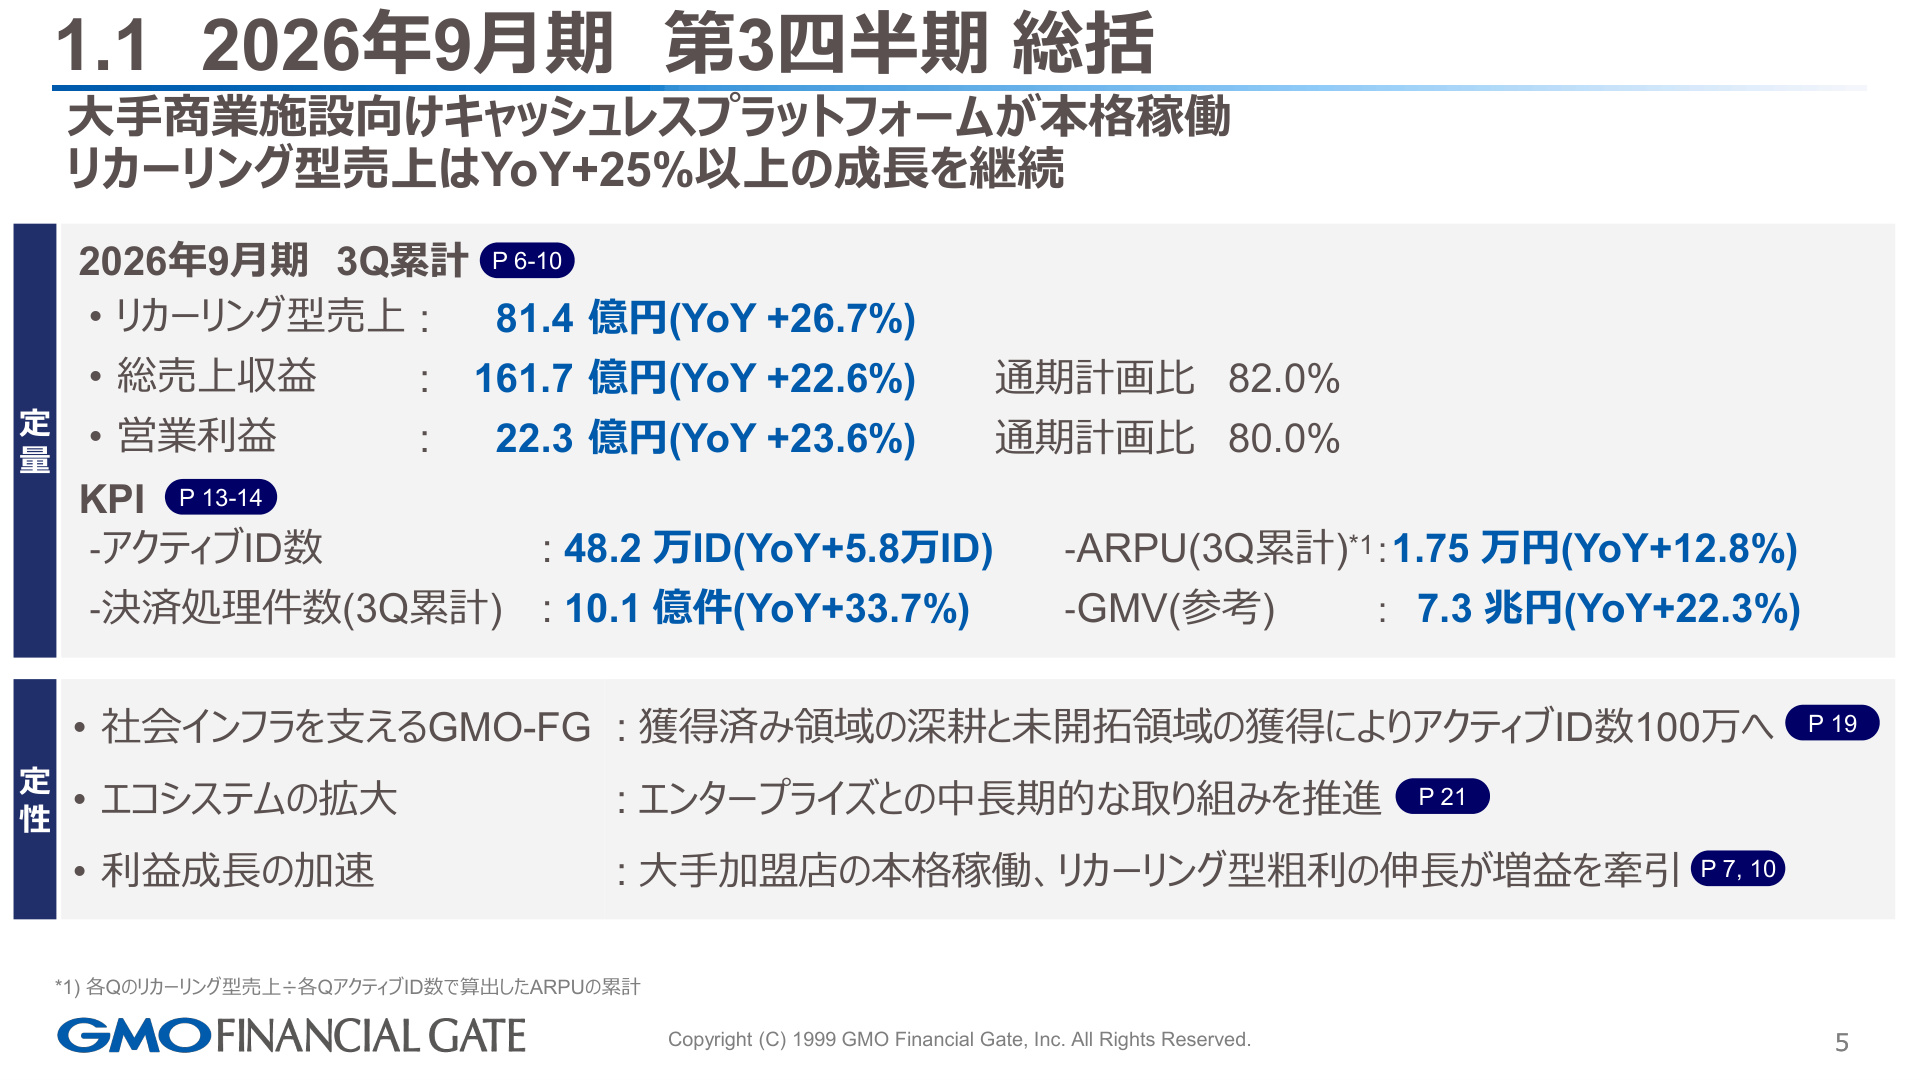
For the cumulative Q3 of FY2026, revenue reached 16.17 billion yen (+22.6% YoY) , and operating profit stood at 2.23 billion yen (+23.6% YoY) . Progress against the full-year plan is extremely steady, with revenue at 82.0% and operating profit at 80.0% of the targets.
[Slide Commentary: The Importance of PAGE_4 (Q3 Summary)]
PAGE_4 above is one of the most critical slides, comprehensively summarizing the quantitative achievements and qualitative assessments of this quarter. As shown, the company's growth engine lies in its recurring-type revenue, which reached 8.14 billion yen (+26.7% YoY) . Furthermore, the number of payment transactions, which reached 1.01 billion (+33.7% YoY) , highlights the surging frequency of use for the company's payment infrastructure.
2. Trends in Revenue by Category (Recurring vs. Initial)
Breaking down the revenue structure reveals the following characteristics:
- Recurring-type Revenue (8.14 billion yen / +26.7% YoY) :
- Stock Revenue (Fixed monthly fees, etc.): 1.86 billion yen (+21.2% YoY)
- Fee Revenue (Transaction-based fees): 4.86 billion yen (+29.9% YoY)
- Spread Revenue (Percentage-based fees on transaction volume): 1.40 billion yen (+23.8% YoY)
- Initial Revenue (8.02 billion yen / +18.7% YoY) :
- Revenue from payment terminal sales and initial development projects. Contributions from the sequential delivery of projects for major drugstores and commercial facilities are evident.
3. Accelerated Growth in Q3 (April–June)
Looking at the standalone Q3 performance, revenue grew to 5.65 billion yen (+36.4% YoY) and operating profit to 670 million yen (+58.2% YoY) , indicating an acceleration in growth speed. This is due to the accumulation of high-margin recurring gross profit following the full-scale operation of major merchants.
Chapter 2: Qualitative Evolution of Business Structure and Expansion of Operating Leverage
The company's business model extends beyond the initial installation of payment terminals to generate continuous revenue (recurring) as payment processing occurs. This expansion of recurring gross profit is dramatically improving the company's profitability.
[Slide Commentary: The Importance of PAGE_9 (Recurring Gross Profit and Profit Growth)]
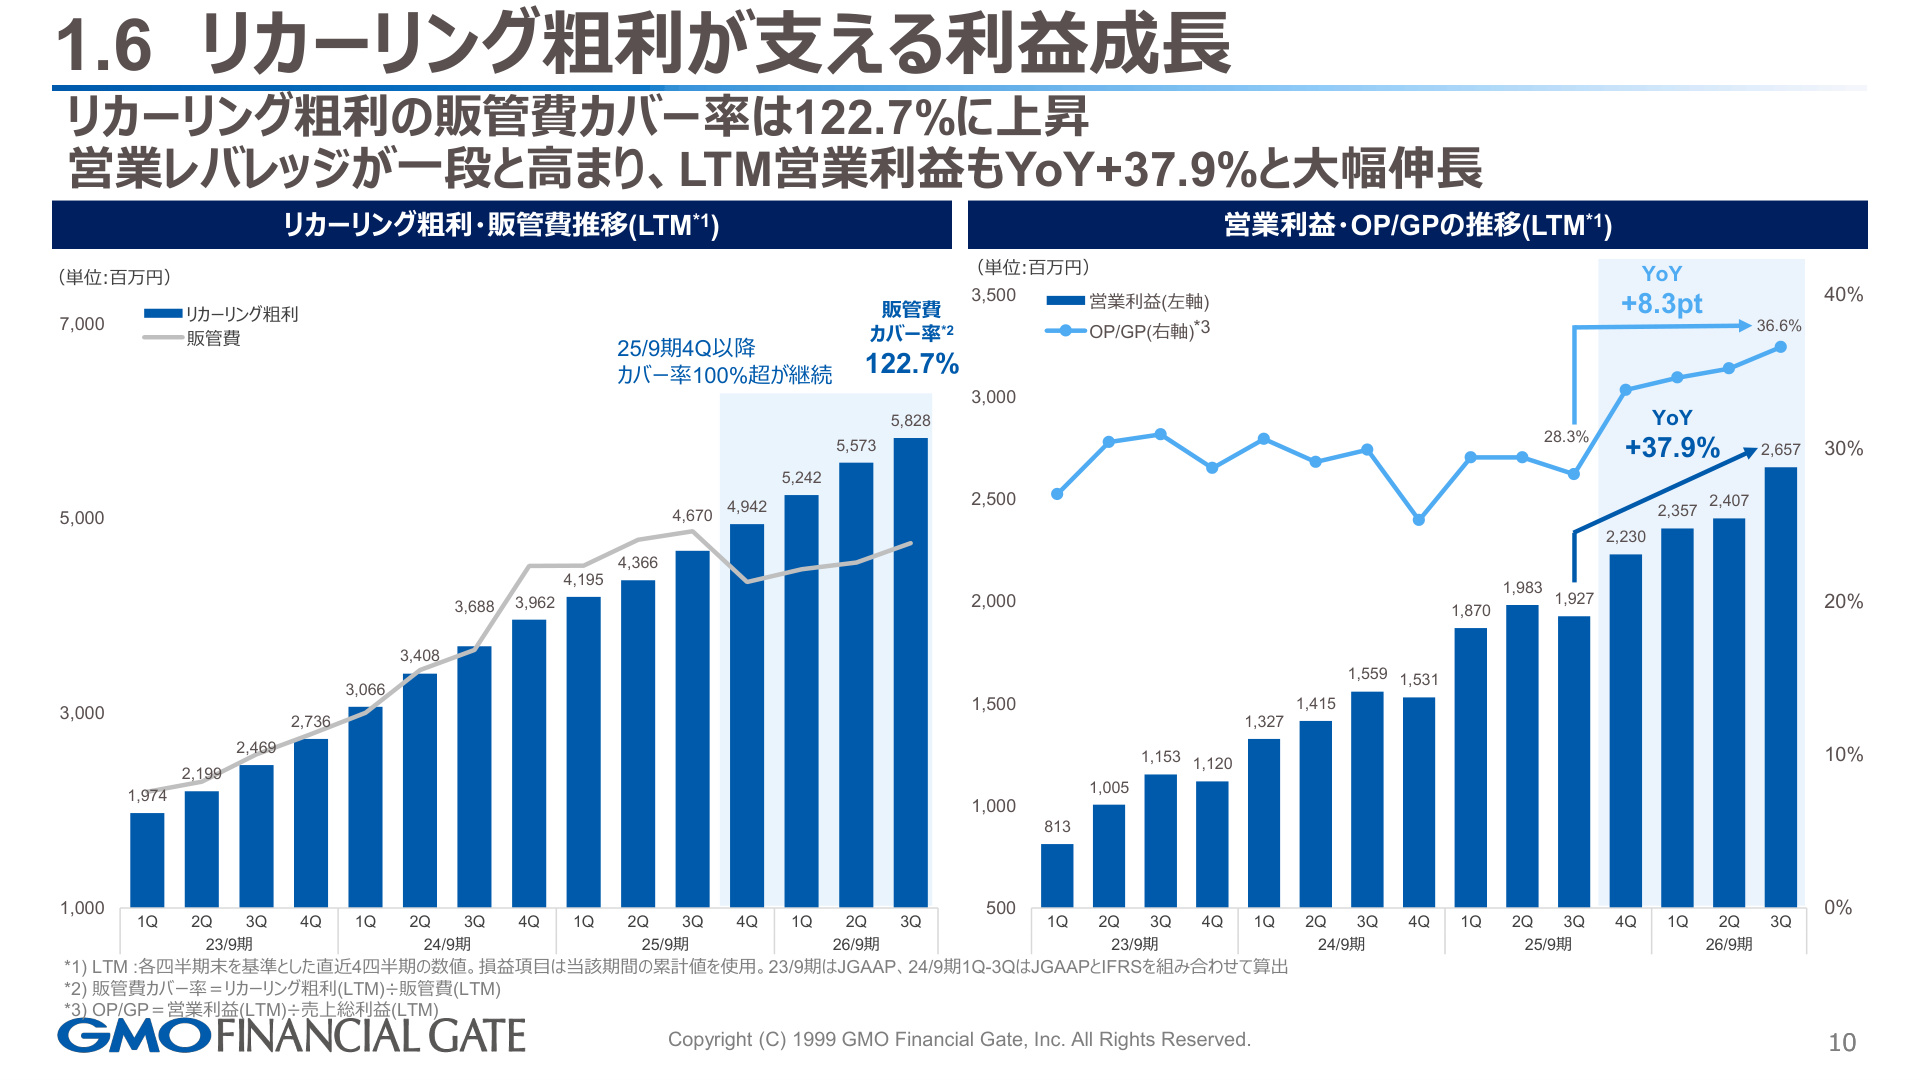
PAGE_9 provides evidence of the "high operating leverage" inherent in the company's business model. As shown in the left-hand graph (Last Twelve Months (LTM) trend), a structure where recurring gross profit fully covers fixed SG&A expenses (SG&A coverage ratio of 122.7%) has become firmly established. With fixed costs covered by recurring gross profit, the company has entered a phase where additional gross profit flows directly into operating profit. Consequently, LTM operating profit has grown to 2.65 billion yen (+37.9% vs. two years ago) , and the operating profit margin (relative to gross profit) has improved significantly to 36.6% (+8.3pt YoY) .
Chapter 3: Trends in Key KPIs and Deepening of Merchant Portfolio
We analyze the trends in various Key Performance Indicators (KPIs) that are essential for measuring the sustainability of performance.
5. Steady Accumulation of Active IDs
Active IDs , which indicate the operational status of payment terminals, reached 482,000 (+58,000 YoY) . The breakdown by sector is as follows:
- Attended (Large-scale) : 102,000 IDs (+8.6% YoY) - Driven by major commercial facilities and drugstores.
- Unattended/IoT : 104,000 IDs (+31.5% YoY) - Rapid expansion in coin parking, vending machines, and ticket machines.
- Attended (SME) : 266,000 IDs (+10.6% YoY) - Expansion into medical clinics and other sectors, centered on the all-in-one payment terminal "stera."
6. Increase in ARPU (Revenue per ID) and GMV (Transaction Volume)
ARPU (Recurring revenue per ID) for the cumulative Q3 rose to 17,500 yen (+12.8% YoY) . This is due to an increased share of large-scale merchants (daily-life sector) with higher transaction values and utilization rates. Furthermore, total GMV (Gross Merchandise Volume) reached 7.3 trillion yen (+22.3% YoY) , enhancing the company's presence as a social infrastructure.
7. Expansion of Daily-Life Sector Merchants and Top 30 GMV Composition
Analyzing the composition of the top 30 merchants by GMV, the ratio of the daily-life sector (drugstores, supermarkets, commercial facilities, etc.) expanded to 71% (from 59% in the same period last year) . With eight new contracts entering the top 30, the company is successfully strengthening its customer base centered on high-utilization enterprise firms.
8. Expansion of Enterprise and Peripheral Ecosystems
In addition to expanding partnerships with major real estate groups (e.g., the decision to install approximately 15,000 terminals across 80 commercial facilities of the Mitsui Fudosan Group), the company is promoting functional expansion into payment-peripheral areas (payment DX and sales activation) , such as office delivery and inbound tourism solutions.
9. Explosive Growth in the Mobility Sector (Public Transportation Contactless Payments)
The number of operators adopting credit card contactless payments for railways and buses nationwide has reached 184 (across 44 prefectures) , an increase of 35 operators year-on-year. Coupled with large-scale campaigns by operators like Tokyo Metro, the number of payment transactions is showing a sharp upward trend.
Chapter 4: Mid-to-Long-Term Growth Strategy and Roadmap to 2033
The company is not merely a payment terminal provider; it has set a clear roadmap for mid-to-long-term profit growth.
[Slide Commentary: The Importance of PAGE_16 (Profit Growth Roadmap)]
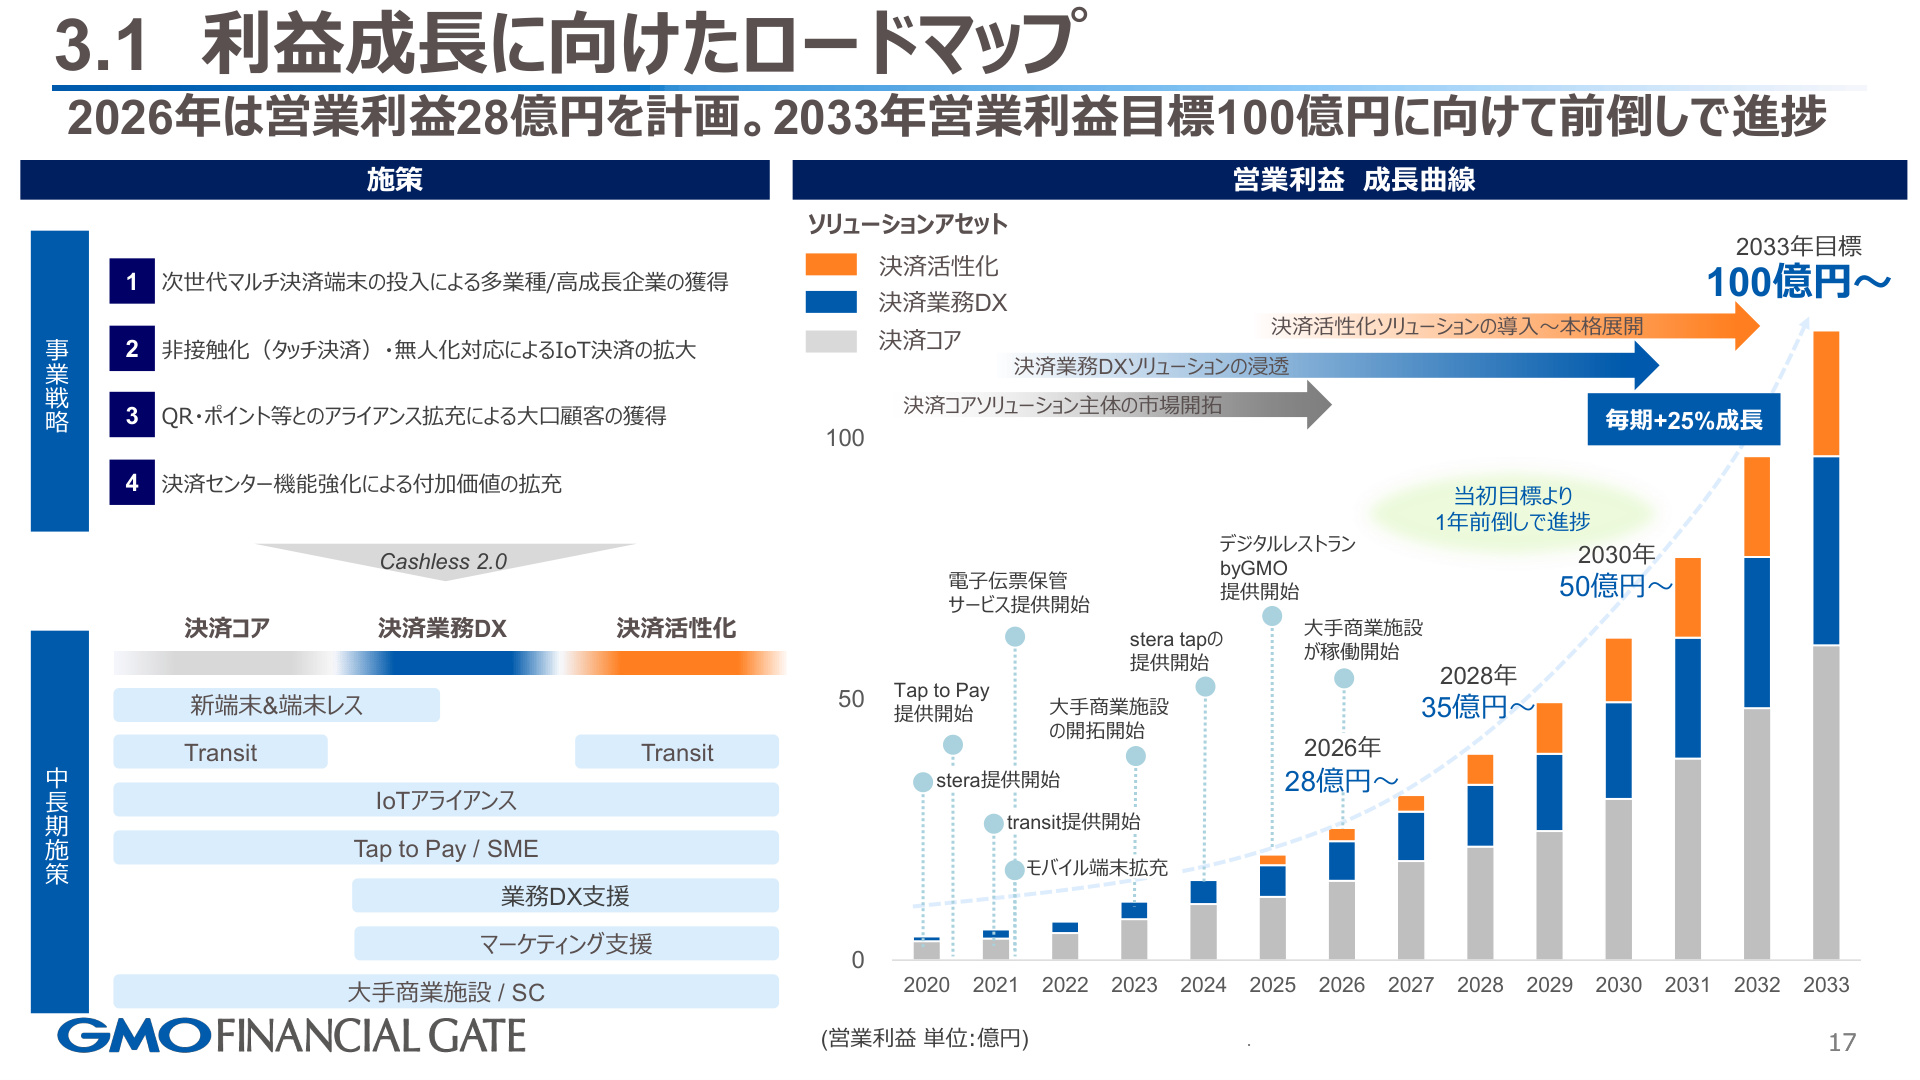
PAGE_16 is a strategic slide outlining the company's mid-term growth trajectory and future goals. As a result of progress in acquiring major commercial facilities and daily-life sector merchants exceeding expectations, the company is tracking one year ahead of its original plan to reach the previously stated "5 billion yen operating profit by 2030." Looking further ahead, it has set a long-term goal of 10 billion yen or more in operating profit for the fiscal year ending September 2033 , illustrating the strength of its growth and the scalability of its business model.
10. Growth Drivers to Achieve 10 Billion Yen in Operating Profit
The key KPI equation to achieve over 10 billion yen in operating profit by 2033 is set as follows:
- Active IDs : 1 million (currently 482,000)
- Recurring ARPU : 25,000 yen (currently 17,500 yen)
- Recurring Gross Margin : 70% (currently approx. 60%)
In addition to acquiring new merchants in untapped areas (a potential of approximately 500,000 IDs), the strategy involves raising both ARPU and gross margins through the deployment of high-value-added services such as payment DX and sales activation solutions.
Conclusion: Summary of Earnings Analysis
GMO Financial Gate's Q3 FY2026 earnings can be summarized in the following three points:
- Dramatic Improvement in Revenue Quality : Growth in recurring-type revenue (+26.7% YoY) has outpaced SG&A expenses, entering a phase where operating leverage is highly effective.
- Dominant Share Acquisition in Daily-Life and Mobility Sectors : Full-scale operations in high-utilization sectors such as drugstores, large commercial facilities, and public transportation have led to a dramatic increase in payment transactions (+33.7% YoY).
- Ahead-of-Schedule Progress on Mid-to-Long-Term Plans : The cycle of expanding active IDs and increasing high-value-added services (rising ARPU) is functioning smoothly toward the goal of 10 billion yen in operating profit by 2033.
These results demonstrate that the company is steadily building its cashless platform as a social infrastructure, with simultaneous expansion of revenue, profit, and profitability.
This content is not intended as investment advice or a recommendation. Any opinions expressed are solely the personal views of each article.