


Earnings Deep-Dive Report: Willplus Holdings – Growth Story Driven by M&A Expansion and PMI Execution

StockClub
Published: Aug 13, 2026, 10:24 AM
Sentiment Analysis

This report provides an objective analysis of the fiscal year ended June 2026 financial results for Willplus Holdings (Securities Code: 3538), covering the company's performance trends, business environment, segment-specific developments, and future growth strategies.
1. FY2026 Consolidated Financial Overview: Navigating Market Headwinds
In the fiscal year ended June 2026, Willplus Holdings achieved top-line growth with net sales of 96,839 million yen (+9.3% YoY) . However, the company reported a double-digit decline in profits: operating profit was 1,426 million yen (down 22.9% YoY) , ordinary profit was 1,445 million yen (down 23.8% YoY) , and net profit attributable to owners of the parent was 1,108 million yen (down 23.2% YoY) .
While the results fell short of the initial full-year guidance, they exceeded the revised forecasts issued during the fiscal year, reaching 105.1% of the sales target, 101.9% of the operating profit target, and 101.3% of the ordinary profit target.
An overview of the company's performance trajectory and future plans clarifies its current phase and the shift in its earnings structure.
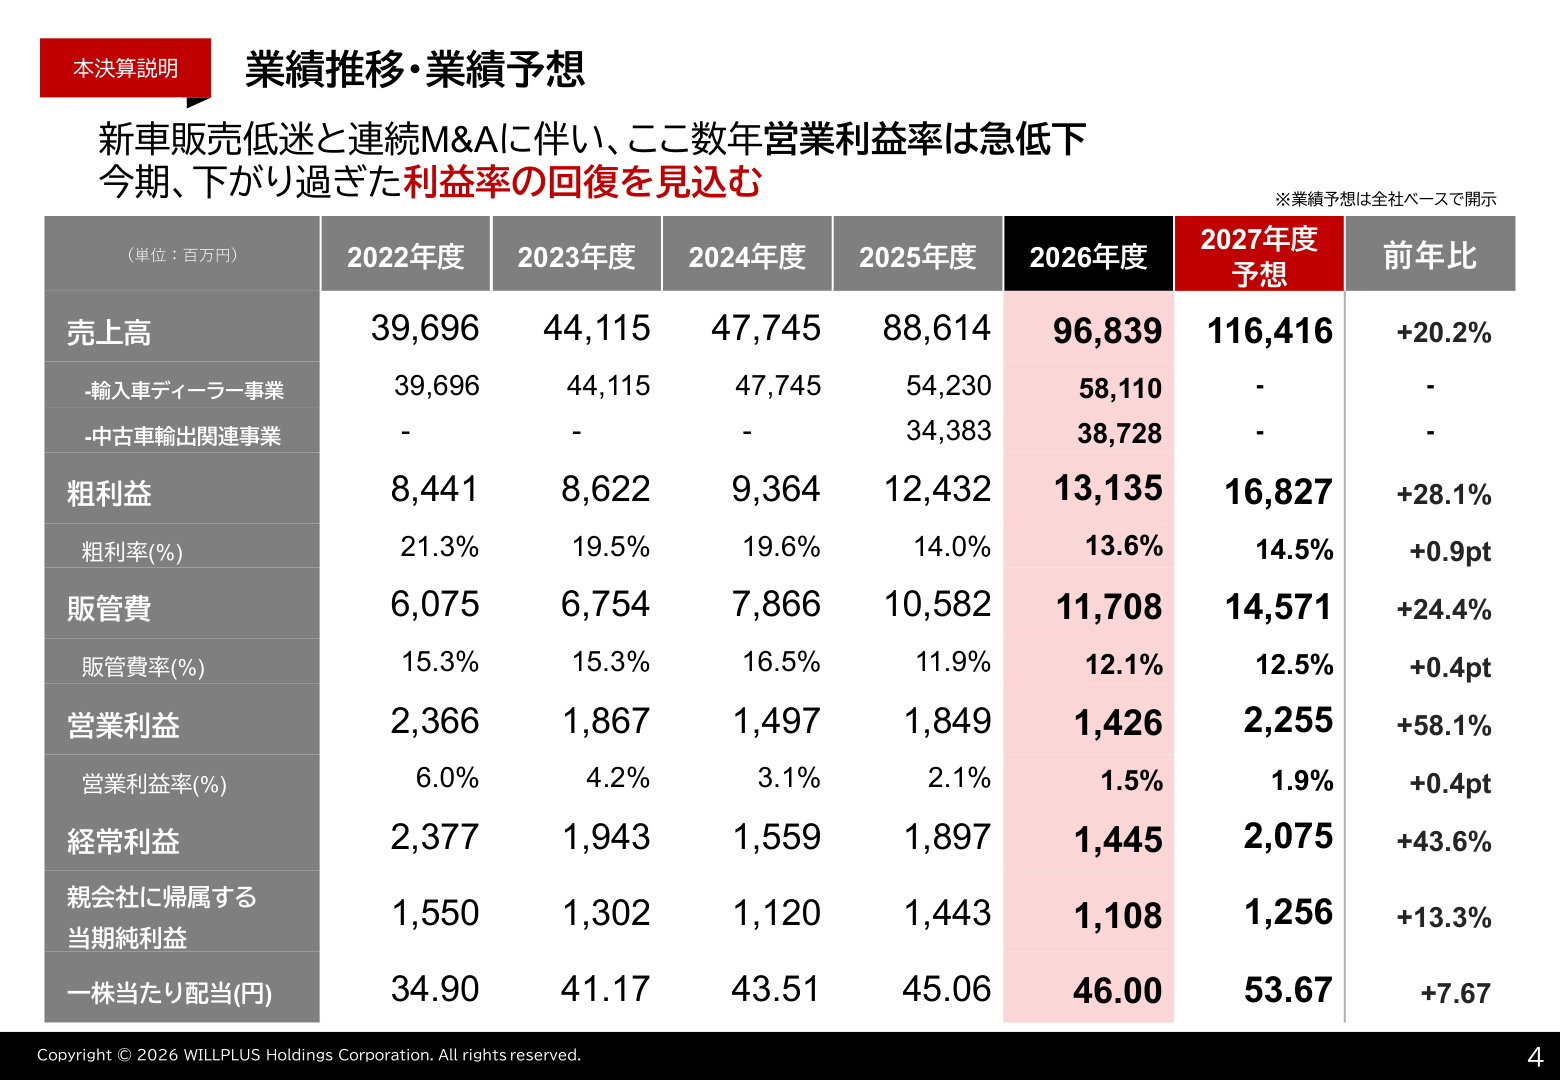
The slide above presents critical data on long-term performance trends from FY2022 to the FY2027 forecast. Net sales have expanded significantly through aggressive M&A, more than doubling from 39,696 million yen in FY2022 to 96,839 million yen in FY2026. Conversely, the operating profit margin dropped sharply from 6.0% in FY2022 to a record low of 1.5% in FY2026. This margin compression was driven by stagnant new car sales, upfront M&A costs, and losses from newly acquired stores. However, the FY2027 forecast anticipates a recovery to a 1.9% margin, suggesting that the company has bottomed out .
2. Analysis of Performance Drivers: The Two Sides of Revenue Growth and Profit Decline
The decline in profit despite revenue growth in FY2026 stems from both external environmental deterioration and internal structural changes.
Factors Contributing to Revenue Growth
- Contribution from Aggressive M&A : New stores integrated into the group during the previous and current fiscal years significantly bolstered sales.
- Expansion of "Wholesale" in Used Car Export Business : Increased volume in B2B used car transactions drove overall sales growth.
Factors Contributing to Profit Decline
- New Car Sales Slump and Delayed Price Pass-through : Rising vehicle prices due to the weak yen and cooling consumer demand led to a decline in new car sales per store. This, combined with an unfavorable product mix and lower used car margins, pressured gross profit margins.
- Upfront M&A Costs and Loss-making Stores : Operating losses at newly acquired stores and an increase in SG&A expenses (+1,126 million yen YoY)—including personnel costs, depreciation, and facility expenses associated with business expansion—weighed on profitability.
3. Segment and Business-Specific Developments
The company's operations are primarily divided into the "Imported Car Dealer Business" and the "Used Car Export-Related Business."
(1) Imported Car Dealer Business
- New Car Sales : Existing store sales volume struggled, down 8.4% YoY. The flagship Jeep brand saw a nearly 40% decline from its 2021 peak, returning to levels seen a decade ago. However, strong performances from brands like VOLVO, Porsche, and BYD partially offset these losses.
- Used Car Sales : While sales volume was robust, up 16.2% YoY (existing stores +11.1%), gross profit per unit fell by 20% YoY, leading to diminished profitability.
(2) Used Car Export-Related Business
- Exports : Sales declined and profitability worsened due to sluggish demand for key models, rising procurement costs, and maritime logistics congestion/cost increases.
- Wholesale : By prioritizing healthy inventory turnover, the company achieved a significant 35.3% YoY increase in sales. Although gross profit margins declined, the increase in volume ensured a slight rise in total gross profit.
(3) High-Growth Stock-Based Business
Supporting the volatility of the flow-based business (vehicle sales) is the stock-based business, consisting of vehicle maintenance and non-life insurance agency services .
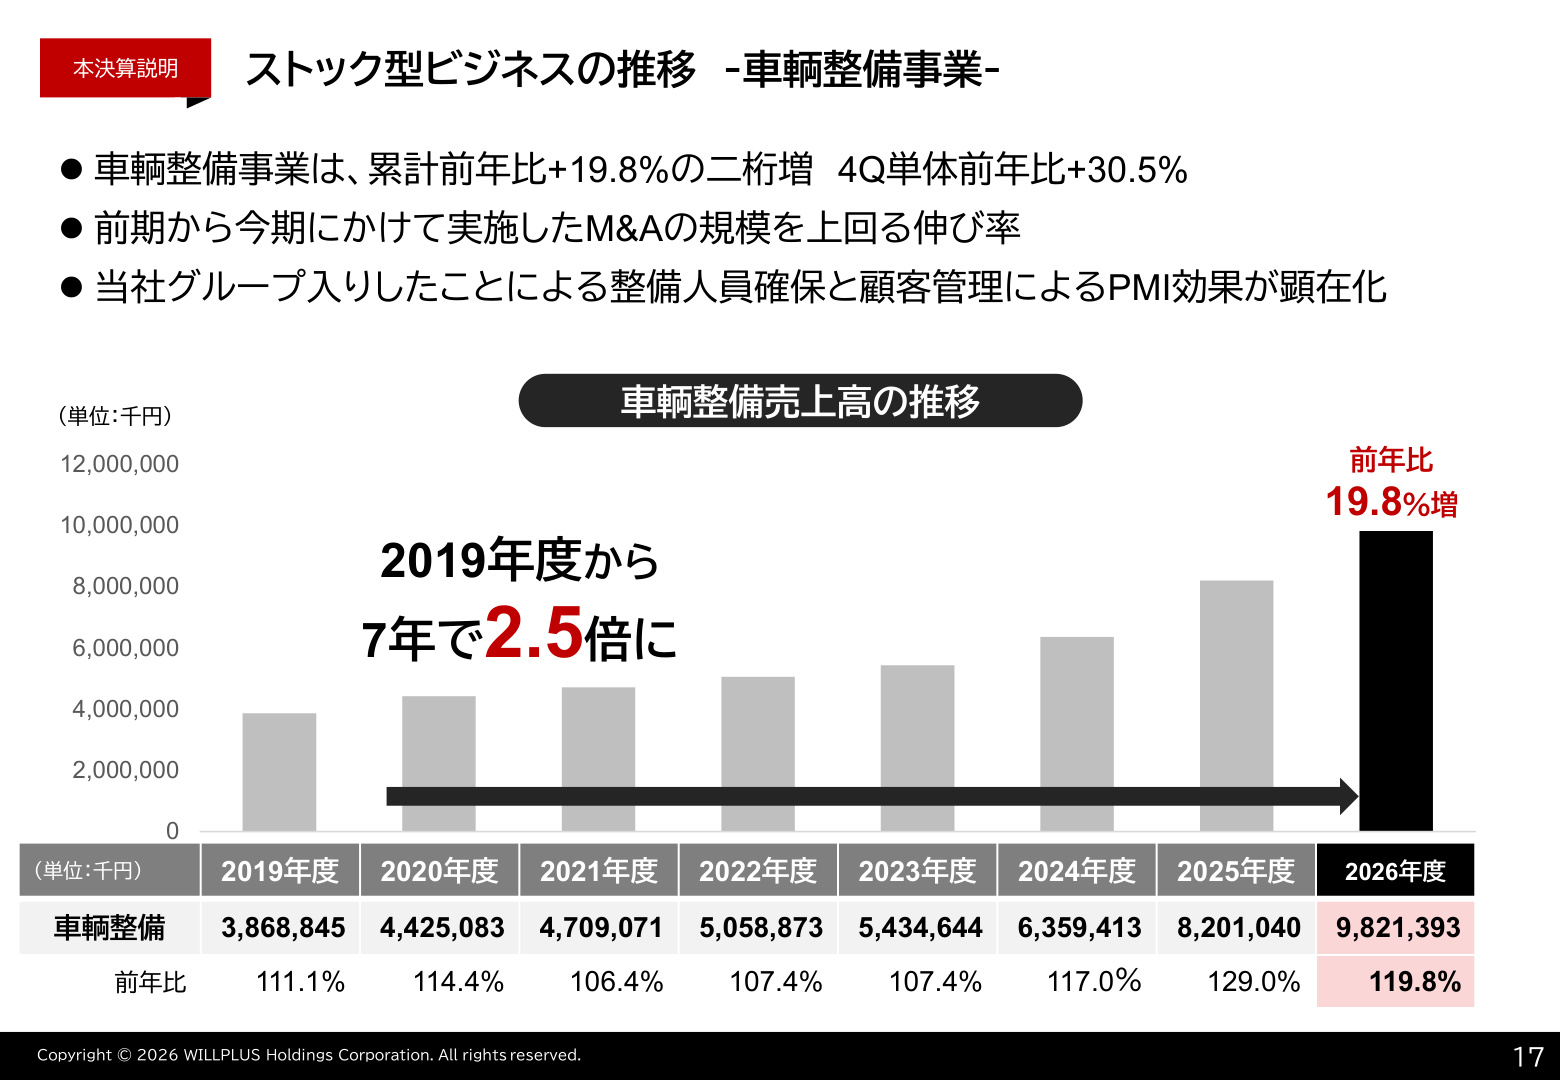
The slide above shows the trend in vehicle maintenance revenue. Maintenance revenue grew 19.8% YoY to 9,821 million yen, a roughly 2.5-fold increase over the seven years since FY2019 . This growth rate exceeds the pace of group expansion (number of stores), demonstrating that PMI (Post-Merger Integration) effects —such as effective customer management and securing maintenance staff at acquired stores—are steadily materializing.
Furthermore, the non-life insurance agency business recovered in the second half following adjustments to the commission structure, with insurance commission revenue in Q4 alone showing a strong 25.4% YoY increase.
4. Signs of Bottoming Out in Quarterly Trends
Quarterly trends indicate that the tide is turning.
In Q3 of FY2026, the consolidated operating profit margin fell to 0.9%, a record low. However, in Q4, net sales reached 29,019 million yen (+29.6% YoY), and operating profit was 384 million yen (down 19.9% YoY, but up 68.7% QoQ) , with the operating profit margin recovering to 1.3%.
Notably, in Q4, the imported car dealer business saw improved profitability at acquired stores, and the expansion of the stock business contributed to a result where the increase in gross profit exceeded the increase in SG&A expenses for the first time in five quarters .
5. FY2027 Earnings Outlook and Mid-to-Long-Term Growth Strategy
The company is planning a significant earnings recovery for the fiscal year ending June 2027.
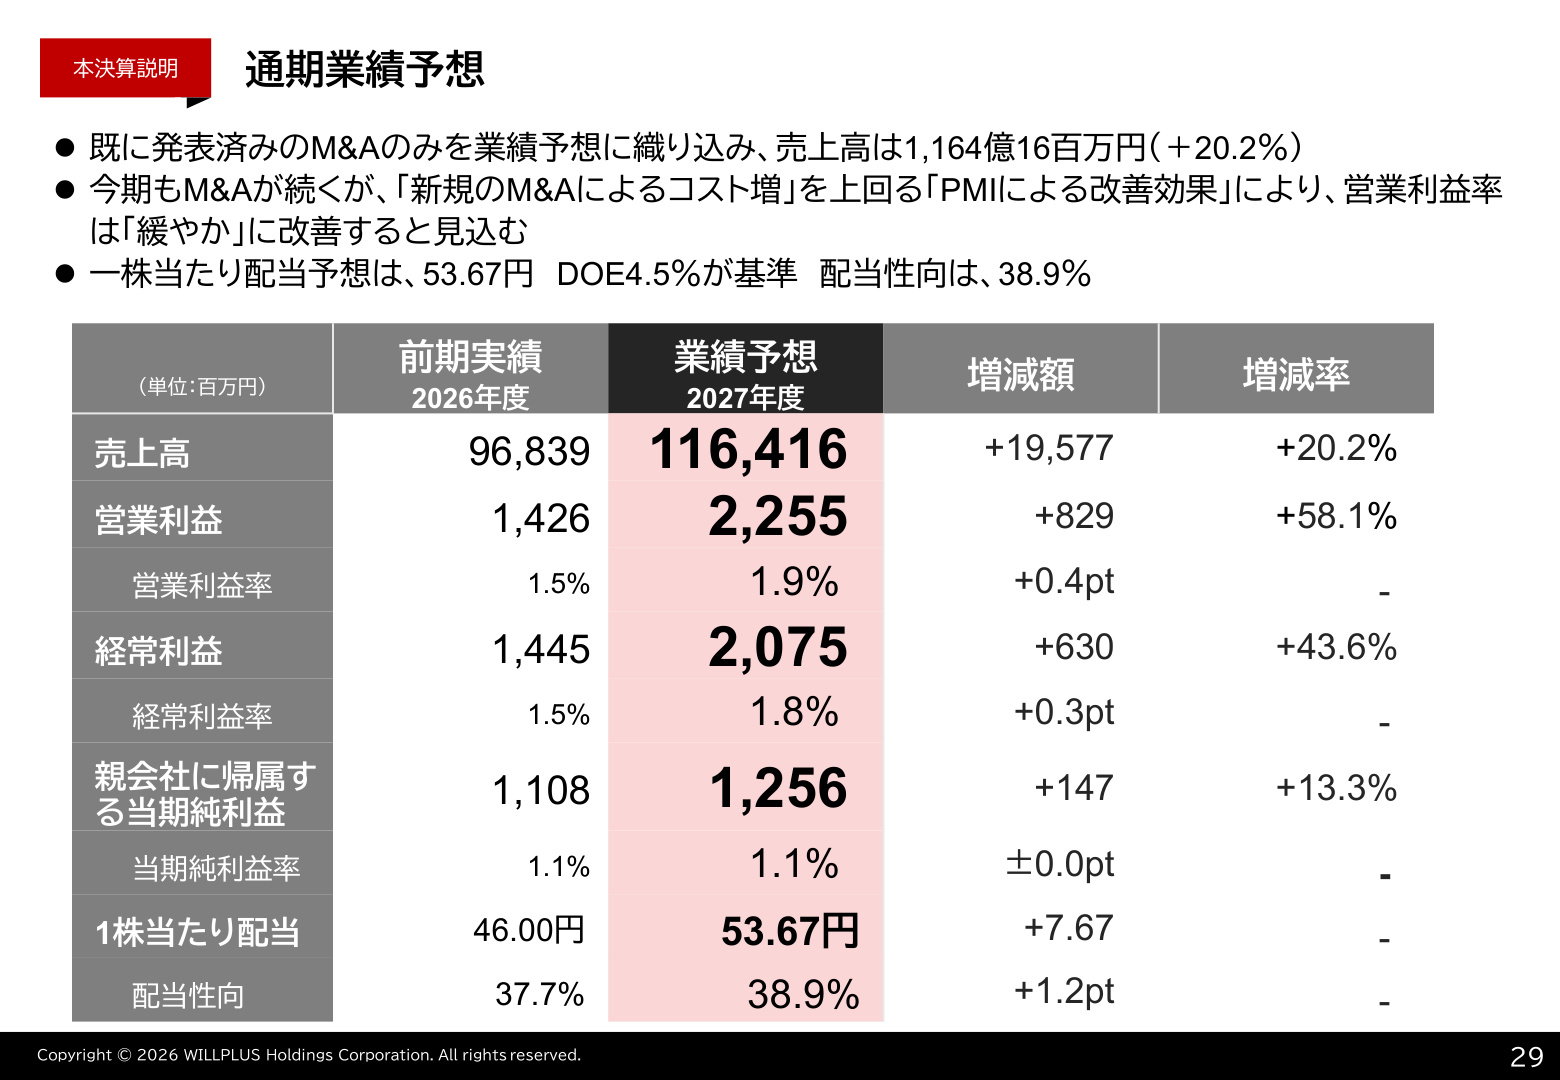
This slide outlines the full-year earnings forecast and dividend plan for FY2027. The company expects substantial profit growth, with net sales of 116,416 million yen (+20.2% YoY) , operating profit of 2,255 million yen (+58.1% YoY) , ordinary profit of 2,075 million yen (+43.6% YoY) , and net profit of 1,256 million yen (+13.3% YoY) .
This plan is supported by the following growth drivers:
- Full-Scale PMI Effects : Integration of M&A deals from the previous and current terms will lead to profitability at loss-making stores and synergies in the stock business.
- Re-growth of Existing Businesses : Expansion of high-margin stock revenue, centered on vehicle maintenance and insurance agency services.
- Optimization of Used Car Export Business : Profitability improvements through appropriate price pass-through and channel expansion.
6. Financial Position and Shareholder Returns
Financially, the equity ratio at the end of FY2026 was 26.6% (down from 29.0% at the end of the previous fiscal year) due to an increase in short-term borrowings for M&A, but it remains at a healthy level. The company has successfully curbed the rapid expansion of fixed assets such as real estate and goodwill, indicating efficient investment.
Regarding shareholder returns, the company maintains a clear policy with a DOE (Dividend on Equity) of 4.5% as a lower limit . The annual dividend for FY2026 was 46.00 yen, and the company forecasts an increase to 53.67 yen (22.00 yen interim, 31.67 yen year-end) for FY2027 . If achieved, this will mark 10 consecutive years of dividend increases , reflecting a commitment to strengthening shareholder returns alongside earnings recovery.
Summary
While Willplus Holdings' FY2026 results were significantly impacted by the stagnation of the imported car market and upfront M&A costs, the Q4 bottoming out, growth in the stock business, and the realization of PMI effects indicate that the foundation for a turnaround is in place. The focus moving forward will be on the monetization of acquired stores and the continued expansion of the stock business to achieve the ambitious profit growth targets for FY2027.
This content is not intended as investment advice or a recommendation. Any opinions expressed are solely the personal views of each article.