

![[Q1 FY2027 Earnings Analysis] Isetan Mitsukoshi Holdings: Strong Performance with 20% Operating Profit Growth Driven by Flagship Stores and Inbound Demand](https://news-images.stock-club.net/market_news/images/3099/140120260812518532/slide_eyecatch_en_2a31bd70.webp)
[Q1 FY2027 Earnings Analysis] Isetan Mitsukoshi Holdings: Strong Performance with 20% Operating Profit Growth Driven by Flagship Stores and Inbound Demand

StockClub
Published: Aug 13, 2026, 10:11 AM
Sentiment Analysis
Based on the Q1 FY2027 earnings presentation materials from Isetan Mitsukoshi Holdings Ltd. (Securities Code: 3099), this report provides a comprehensive analysis of the company's performance highlights, key growth drivers, segment and store-specific data, and structural strengths.
This quarter's results demonstrate exceptionally high profitability, with operating profit increasing by 20.6% year-on-year . This success is attributed to the synergy between the overwhelming sales power of major urban flagship stores and the expansion of demand for high-end goods and international (inbound) customers within the core department store business.
1. Consolidated Financial Overview: Significant Growth in Both Operating and Net Profit
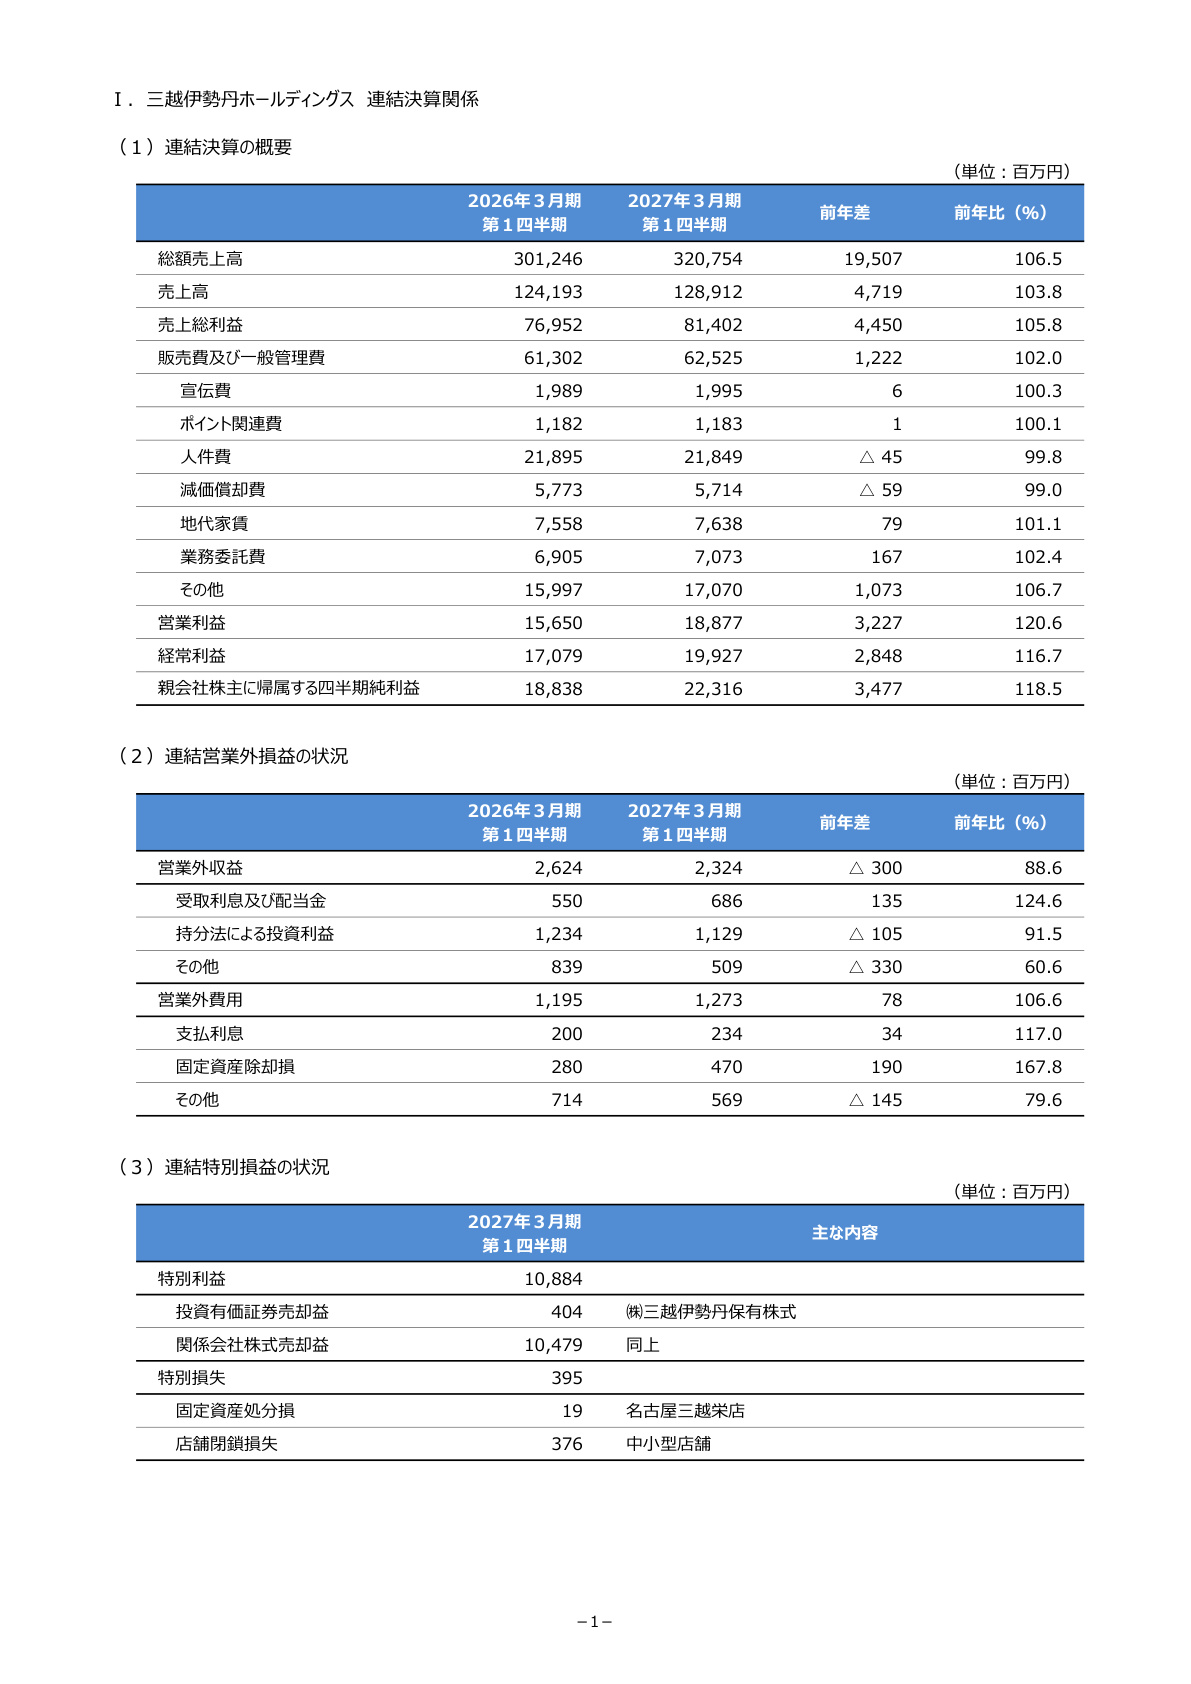
First, we provide an overview of the group's consolidated profit and loss. For the first quarter, total sales reached 320.754 billion yen (106.5% year-on-year) , and operating profit stood at 18.877 billion yen (120.6% year-on-year) , marking a substantial increase in both revenue and profit.
Gross profit was 81.42 billion yen (105.8% year-on-year) , an increase of 4.45 billion yen compared to the same period last year. Meanwhile, selling, general and administrative (SG&A) expenses were 62.525 billion yen (102.0% year-on-year) , representing a modest increase of only 1.222 billion yen despite the rise in sales-related costs. This result highlights a highly efficient profit structure where revenue growth effectively translates into operating profit.
The following slide summarizes the consolidated statement of income and non-operating/extraordinary profit and loss.
Slide Analysis and Data Significance
The slide above (Page 1) provides the most critical profit and loss data for understanding the overall picture of these earnings.
- Operating Profit Growth (120.6% YoY) : Profit growth significantly outpaced sales growth (103.8%), with the operating profit margin reaching 14.6% .
- Cost Control : Fixed costs such as personnel expenses (21.849 billion yen, 99.8% YoY) and depreciation (5.714 billion yen, 99.0% YoY) were lower than the previous year, indicating disciplined SG&A management that successfully contained cost increases relative to sales growth.
- Extraordinary Profit : With the booking of 10.479 billion yen in gain on sales of investment securities as extraordinary profit, quarterly net profit attributable to owners of the parent reached 22.316 billion yen (118.5% year-on-year) , ensuring a high level of bottom-line profitability.
2. Individual Performance of Core Business "Isetan Mitsukoshi Ltd." and Flagship Store Drawing Power
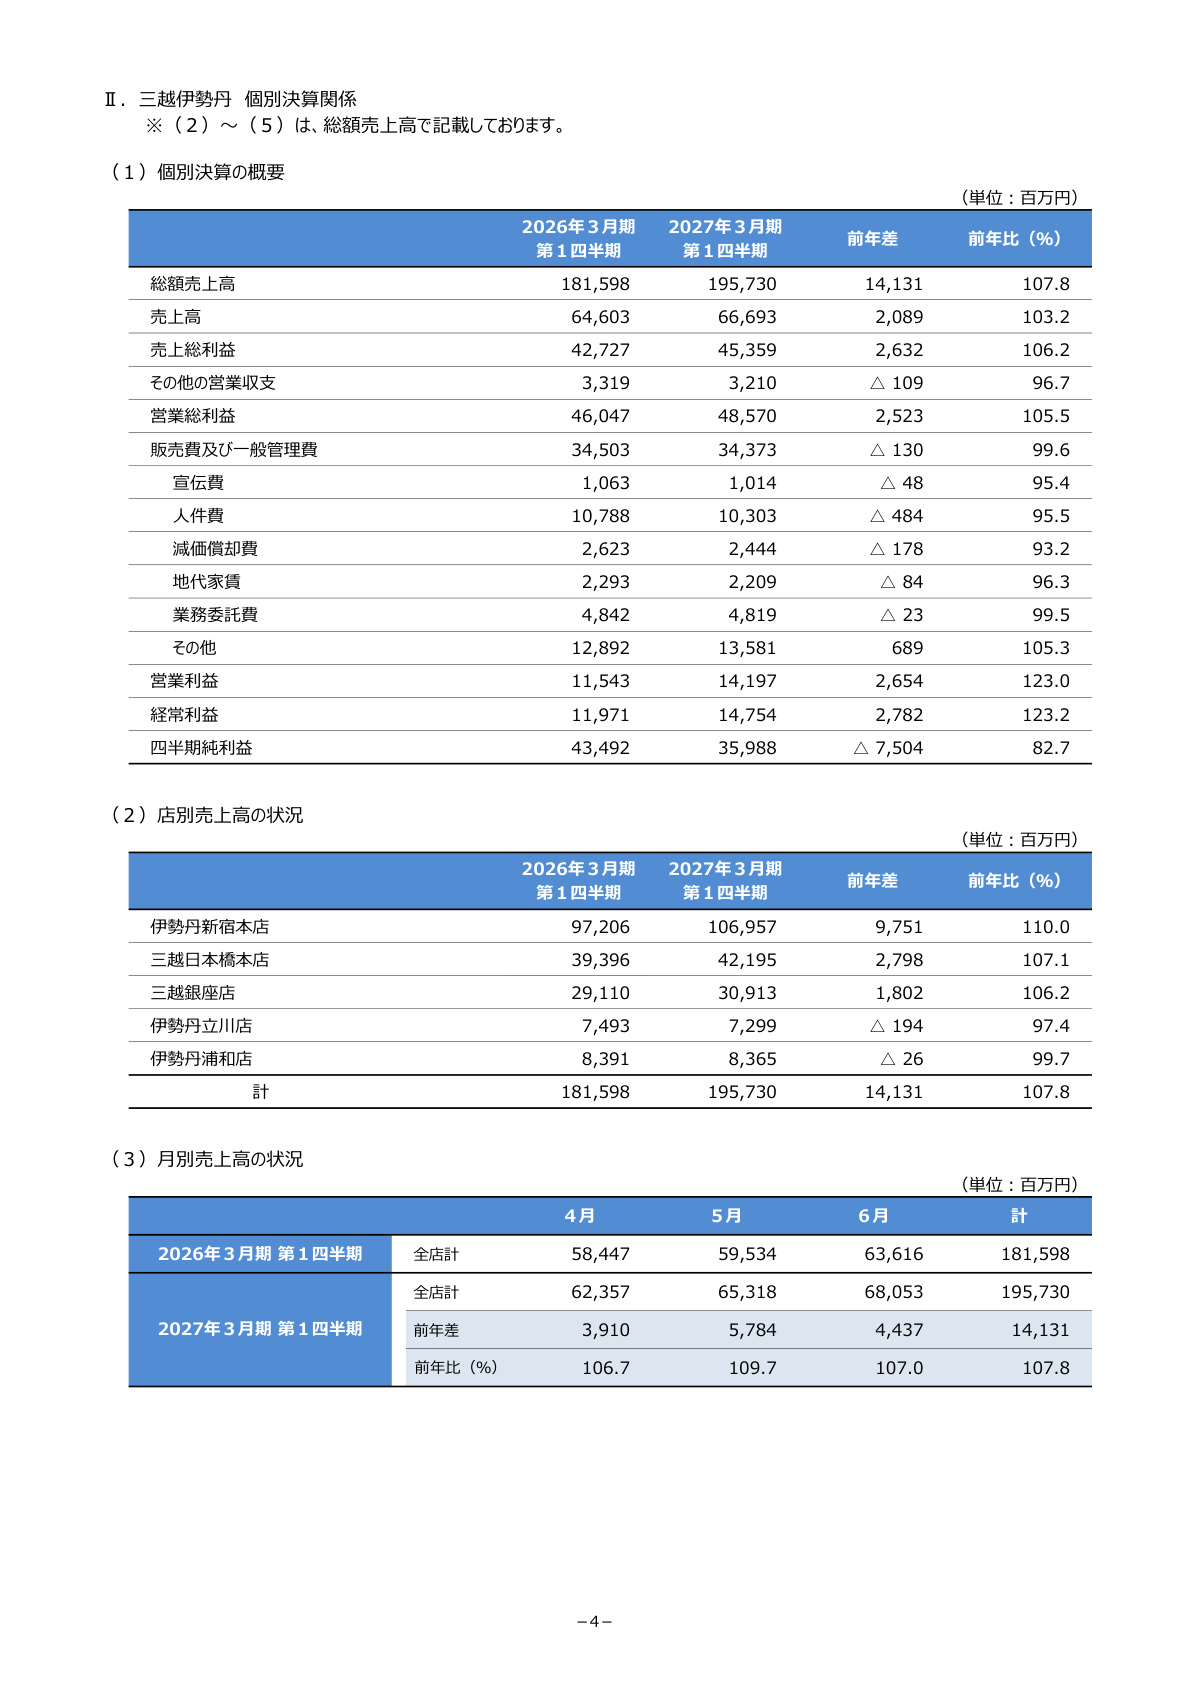
Looking at the performance of Isetan Mitsukoshi Ltd. (non-consolidated) , the primary driver of group performance, total sales were 195.73 billion yen (107.8% year-on-year) , and operating profit was 14.197 billion yen (123.0% year-on-year) , growing at a faster pace than the group as a whole.
Of particular note is the concentration of demand in urban flagship stores and the steady monthly sales trends . Detailed store-specific sales trends and monthly performance are summarized in the slide below.
Slide Analysis and Data Significance
The slide above (Page 4) shows the breakdown of Isetan Mitsukoshi's individual performance, sales by major store, and monthly sales trends for the first quarter.
-
Sales Trends by Major Store :
- Isetan Shinjuku Main Store : 106.957 billion yen (110.0% year-on-year) . Boasting overwhelming scale and growth as a single store, it contributed +9.751 billion yen in sales growth, accounting for the majority of the individual growth.
- Mitsukoshi Nihombashi Main Store : 42.195 billion yen (107.1% year-on-year)
- Mitsukoshi Ginza Store : 30.913 billion yen (106.2% year-on-year) All three urban stores showed strong performance significantly exceeding the previous year. Conversely, suburban and regional stores such as Isetan Tachikawa (97.4% YoY) and Isetan Urawa (99.7% YoY) remained flat or saw slight declines, highlighting a clear concentration of customers and demand in urban flagship stores .
-
Monthly Sales Trends :
- April: 62.357 billion yen (106.7% YoY)
- May: 65.318 billion yen (109.7% YoY)
- June: 68.053 billion yen (107.0% YoY) Each month throughout the quarter maintained a stable and high growth rate of 6–9% compared to the previous year, indicating that this is not a one-time surge but rather supported by sustained purchasing intent.
3. Product Category Analysis and Rapid Expansion of Inbound Sales
To understand the quality of sales growth, we analyze demand trends by product and the inbound sales , which have become a major engine for performance expansion.
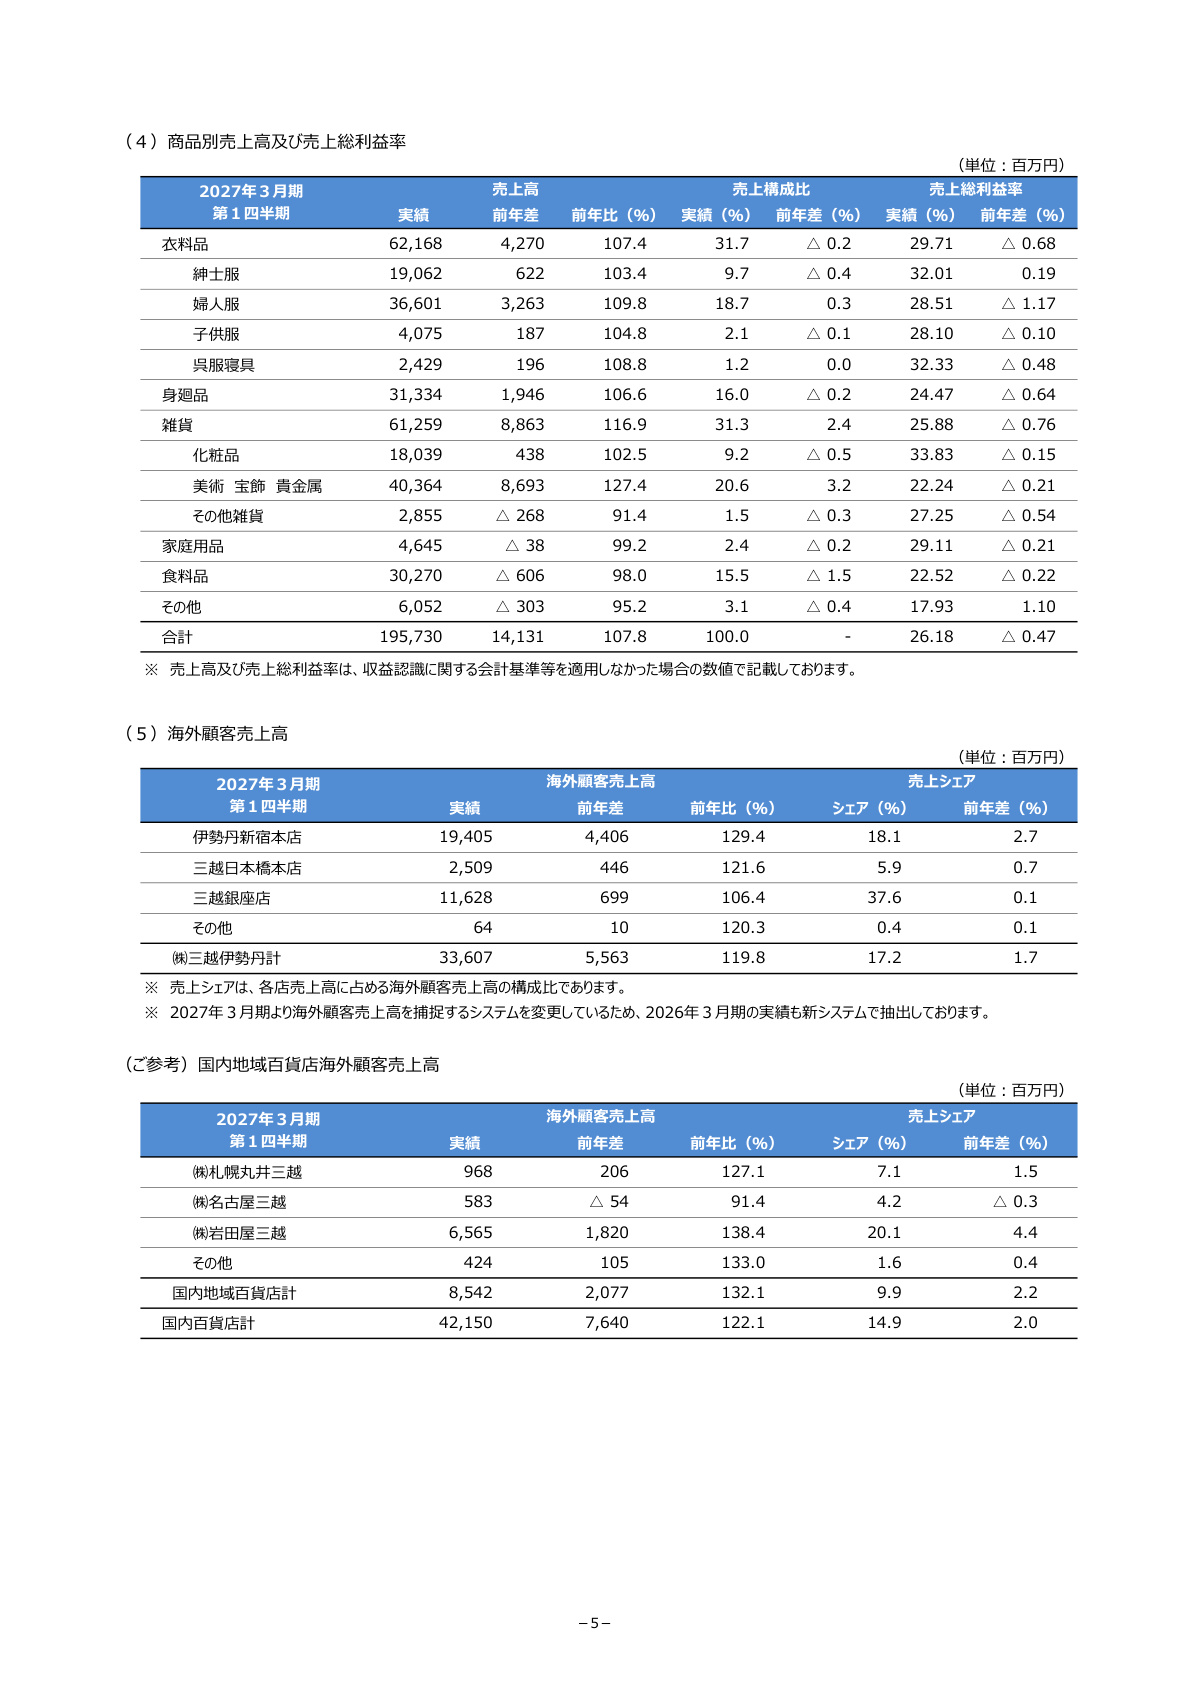
The following slide details sales by product, gross profit margins, and the status of inbound sales.
Slide Analysis and Data Significance
The slide above (Page 5) provides critical data for analyzing which products are being purchased and which customer segments are driving growth.
-
Structure of Sales by Product :
- Art, Jewelry, and Precious Metals : Rapidly expanded to 40.364 billion yen (127.4% year-on-year) . Its share of total sales rose to 20.6% (+3.2% YoY), confirming strong demand for high-end luxury goods with high asset value, driven by rising stock prices and inflation.
- General Merchandise : 61.259 billion yen (116.9% year-on-year) . Cosmetics (18.039 billion yen, 102.5% YoY) also remained solid.
- Apparel : 62.168 billion yen (107.4% year-on-year) . Quality demand continues, centered on women's clothing (36.601 billion yen, 109.8% YoY).
- Conversely, household goods (99.2% YoY) and food (98.0% YoY) fell below the previous year, indicating a polarization of demand between high-end/luxury goods and daily necessities.
-
Growth in Inbound Sales :
- Isetan Mitsukoshi Ltd. Inbound Sales : Reached 33.607 billion yen (119.8% year-on-year) , with its share of total sales expanding to 17.2% (+1.7% YoY) .
- Isetan Shinjuku Main Store : Inbound sales reached 19.405 billion yen (129.4% year-on-year) , with a sales share of 18.1% .
- Mitsukoshi Ginza Store : Inbound sales reached 11.628 billion yen (106.4% year-on-year) , maintaining a very high sales share of 37.6% .
- Total Domestic Department Stores : Total inbound sales for all domestic regional department stores, including local affiliates, reached 42.15 billion yen (122.1% year-on-year) , with a sales share of 14.9% (Iwataya Mitsukoshi also saw significant growth at 6.565 billion yen, 138.4% YoY).
4. Trends in Major Group Companies and Other Segments
Beyond the department store business, other segments leveraging the group's customer base and assets also showed steady progress.
- Credit, Finance, and Tomonokai (Customer Club) Business :
- MICARD Co., Ltd. : Achieved revenue and profit growth with total sales of 9.311 billion yen and operating profit of 2.125 billion yen (+272 million yen YoY) , supported by increased commission income and transaction volume from high-end department store sales.
- Real Estate Business :
- Isetan Mitsukoshi Property Design Ltd. : Showed remarkable performance improvement with total sales of 5.238 billion yen (+1.921 billion yen YoY) and operating profit of 255 million yen (+312 million yen YoY) .
- Regional Department Stores and Overseas Subsidiaries :
- Iwataya Mitsukoshi Ltd. : Performed well with total sales of 32.654 billion yen (+2.426 billion yen YoY) and operating profit of 1.281 billion yen (+371 million yen YoY) .
- Overseas Department Stores : Major overseas bases, including Isetan Mitsukoshi USA (operating profit 760 million yen, +187 million yen YoY) and Isetan (Singapore) (operating profit 590 million yen, +329 million yen YoY), also steadily accumulated profits.
5. Comprehensive Analysis and Future Outlook
The strengths and key points of Isetan Mitsukoshi Holdings emerging from the Q1 FY2027 earnings can be summarized in the following three points:
- High Value-Added Strategy and Deepening Engagement with Identified Customers (VIPs/High-Spenders) : Beyond a mere recovery in customer numbers, high value-added proposals to identified customer segments—as evidenced by the growth in luxury categories like art and jewelry—are proving successful.
- Capturing Inbound Purchasing Power and Concentration in Flagship Stores : By leveraging an overwhelming brand lineup and service quality, particularly at the Isetan Shinjuku and Mitsukoshi Ginza stores, the company is successfully capturing demand from international tourists, contributing to high-margin sales growth.
- High Structural Profitability : Because fixed costs such as personnel expenses are appropriately controlled relative to sales growth, a structure has been established where sales growth directly translates into improved operating profit margins .
In conclusion, these earnings demonstrate that Isetan Mitsukoshi Holdings maintains a solid profit foundation through the synergy between the robust customer-drawing and sales capabilities of its department store business and its peripheral businesses, such as finance and real estate.
This content is not intended as investment advice or a recommendation. Any opinions expressed are solely the personal views of each article.