

![[In-Depth Analysis] fonfun Q1 FY2027 Earnings: Unveiling the 'Project Phoenix II' Launch and DX Roll-up Strategy for Non-Linear Growth](https://news-images.stock-club.net/market_news/images/2323/140120260812518458/slide_eyecatch_en_e031f0a8.webp)
[In-Depth Analysis] fonfun Q1 FY2027 Earnings: Unveiling the 'Project Phoenix II' Launch and DX Roll-up Strategy for Non-Linear Growth

StockClub
Published: Aug 13, 2026, 10:02 AM
Sentiment Analysis

fonfun Corp. (Securities Code: 2323) has released its earnings supplementary materials for the first quarter of the fiscal year ending March 2027. This report provides a comprehensive and detailed analysis of the performance data, business progress, and the newly launched second medium-term management plan, "Project Phoenix II."
1. Q1 FY2027 Earnings Highlights and Progress
During the first quarter (April–June 2026), fonfun achieved significant year-on-year growth in both revenue and various profit metrics , driven by aggressive M&A expansion and the creation of synergies across existing businesses.
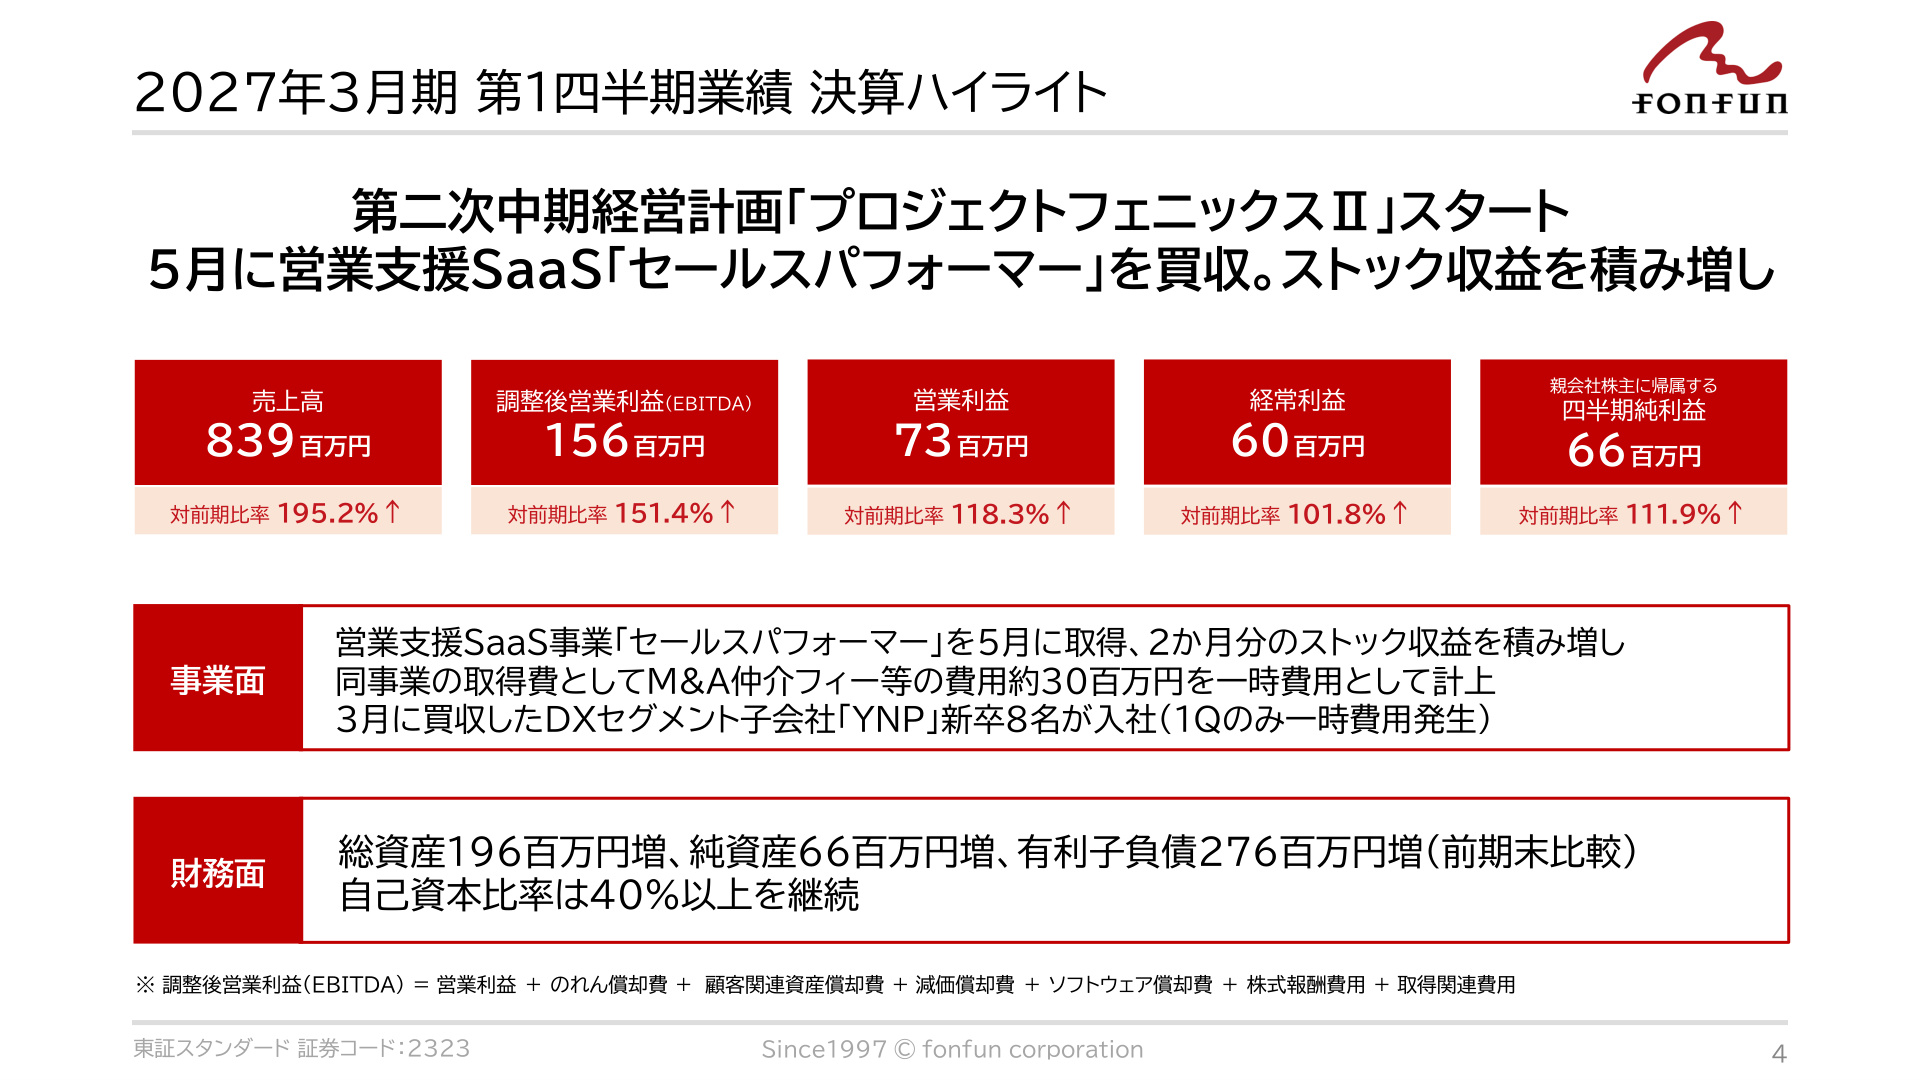
Please refer to the slide below, which summarizes the key performance topics for the first quarter.
Slide Commentary: The Significance of Q1 Earnings Highlights
This slide serves as a financial summary symbolizing the "rocket start" of the new medium-term management plan. In Q1, the company achieved substantial growth, with revenue reaching 839 million yen (up 195.2% YoY) and Adjusted Operating Profit (EBITDA) hitting 156 million yen (up 151.4% YoY) . On the operational front, the report highlights the acquisition of the sales support SaaS "Sales Performer" in May 2026, which bolstered recurring revenue, as well as one-time costs associated with the hiring of eight new graduates at the DX segment subsidiary "YNP" in March. Financially, the company has maintained an equity ratio of over 40% , demonstrating a solid balance between aggressive M&A and financial health.
Detailed P/L Data Analysis
The Profit and Loss (P/L) metrics are as follows:
- Revenue : 839 million yen (195.2% YoY / 23.3% progress against full-year forecast)
- Adjusted Operating Profit (EBITDA) : 156 million yen (151.4% YoY / 21.7% progress against full-year forecast)
- Operating Profit : 73 million yen (118.3% YoY / 15.5% progress against full-year forecast)
- Ordinary Profit : 60 million yen (101.8% YoY / 13.5% progress against full-year forecast)
- Net Income Attributable to Owners of Parent : 66 million yen (111.9% YoY / 14.8% progress against full-year forecast)
- Earnings Per Share (EPS) : 3.15 yen
- Return on Equity (ROE) : 19.3% (annualized)
While the progress rates for operating and ordinary profit appear to be in the 13%–15% range, this is due to one-time expenses incurred during the period (approximately 30 million yen in M&A brokerage fees for the Sales Performer acquisition , YNP's new graduate recruitment costs, and an equity-method loss of approximately 8 million yen from M&A DX). Excluding these one-time costs, the effective operating profit progress rate is over 22% , tracking steadily in line with the revenue progress rate (23.3%).
2. Financial Foundation and Structural Changes in the Balance Sheet (B/S)
Driven by an aggressive M&A strategy (DX roll-up), the company is seeing an expansion in total assets and fluctuations in liabilities.
- Total Assets : 3,481 million yen (up 1,320 million yen YoY)
- Fixed assets increased by 981 million yen (goodwill and customer-related assets rose by 716 million yen due to M&A).
- Cash and deposits secured at 785 million yen (up 102 million yen YoY).
- Liabilities : 2,001 million yen (up 841 million yen YoY)
- Interest-bearing debt expanded to 1,613 million yen (up 691 million yen YoY), primarily due to 400 million yen in new borrowings for M&A funding.
- Net Assets : 1,479 million yen (up 479 million yen YoY)
- Contributed by the accumulation of retained earnings (up 430 million yen).
- Book Value Per Share (BPS) : 66.80 yen
- Equity Ratio : 40.3% (Slightly down from 45.0% a year ago, but remains above the 40% target threshold)
By maintaining an equity ratio of over 40% while utilizing debt for leveraged investment, the company demonstrates financial discipline, ensuring growth investment without compromising stability.
3. Progress of the "DX Roll-up" M&A Strategy
The primary driver of fonfun's non-linear growth is its "DX Roll-up Strategy," which involves the continuous acquisition and integration of companies and businesses in the IT, DX, and cloud sectors.
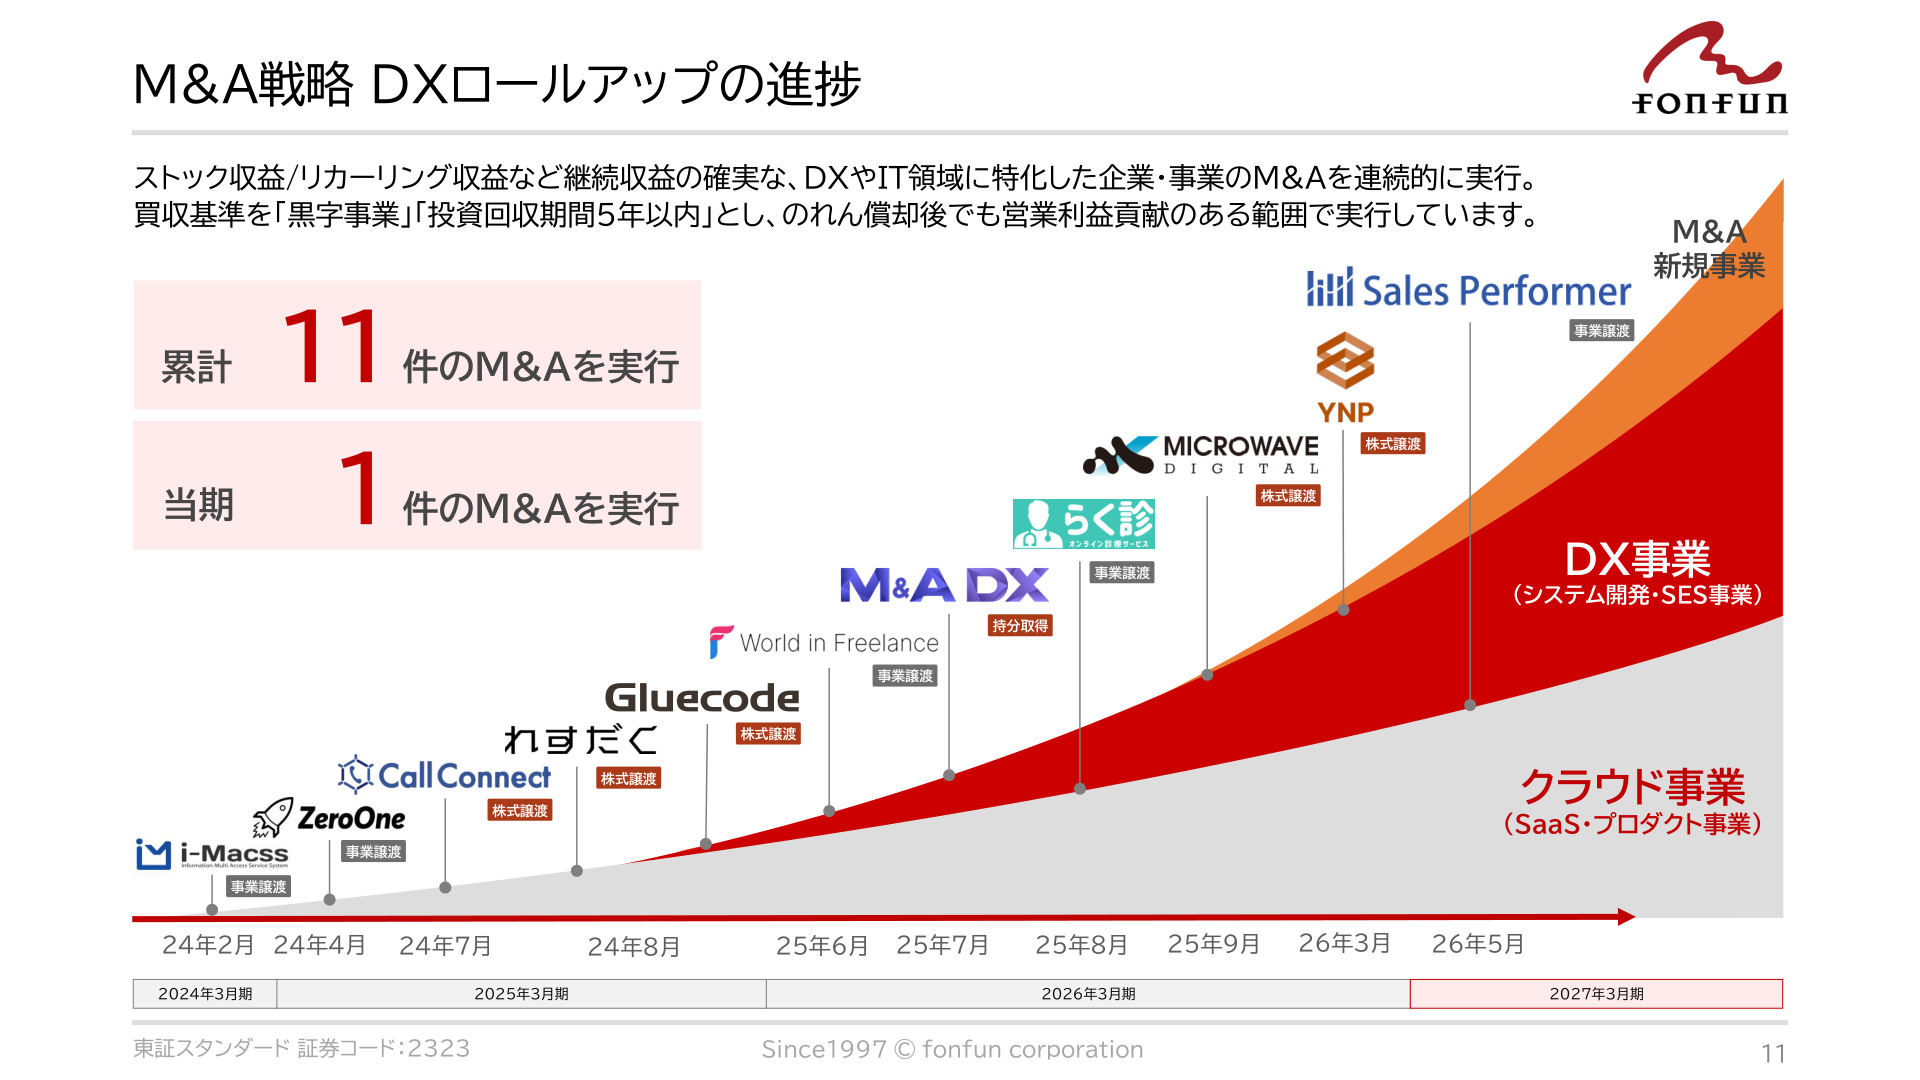
Refer to the slide below for the track record and timeline.
Slide Commentary: The Trajectory and Significance of the DX Roll-up Strategy
This slide serves as a strategic roadmap illustrating the history of M&A executed by the company and the ripple effects on its current business portfolio. fonfun has executed a total of 11 M&A deals , with one already completed in the current fiscal year (Sales Performer). Notably, the company does not select targets merely for scale; it adheres to strict criteria: "businesses with reliable stock/recurring revenue," "profitable businesses," and "investment recovery within 5 years." This ensures immediate contribution to consolidated earnings post-acquisition and creates a structure that generates operating profit even after goodwill amortization.
Acquisition Track Record and Specific Measures
Key acquisitions to date include:
- i-Macss (Feb 2024): SMS delivery business (business transfer)
- ZeroOne (Apr 2024): No-code business SaaS (business transfer)
- selfree (Jul 2024): Cloud phone SaaS (100% equity)
- Gluecode (Aug 2024): DX engineer dispatch (100% equity)
- YNP (Mar 2026): SES business (100% equity, 141 engineers joined)
- Sales Performer (May 2026): Sales visualization cloud SaaS (business transfer, annual revenue approx. 227 million yen, EBITDA approx. 136 million yen)
Through these accumulations, the DX business (SES/contract development) engineer headcount has expanded to 220 , and the cloud business SaaS product lineup has been dramatically enhanced.
4. Overview of the Second Medium-Term Management Plan: "Project Phoenix II"
Having achieved the goals of its first medium-term management plan (FY2024–FY2026) as scheduled, fonfun has entered a new growth stage with the second medium-term management plan, "Project Phoenix II" (FY2027–FY2029).
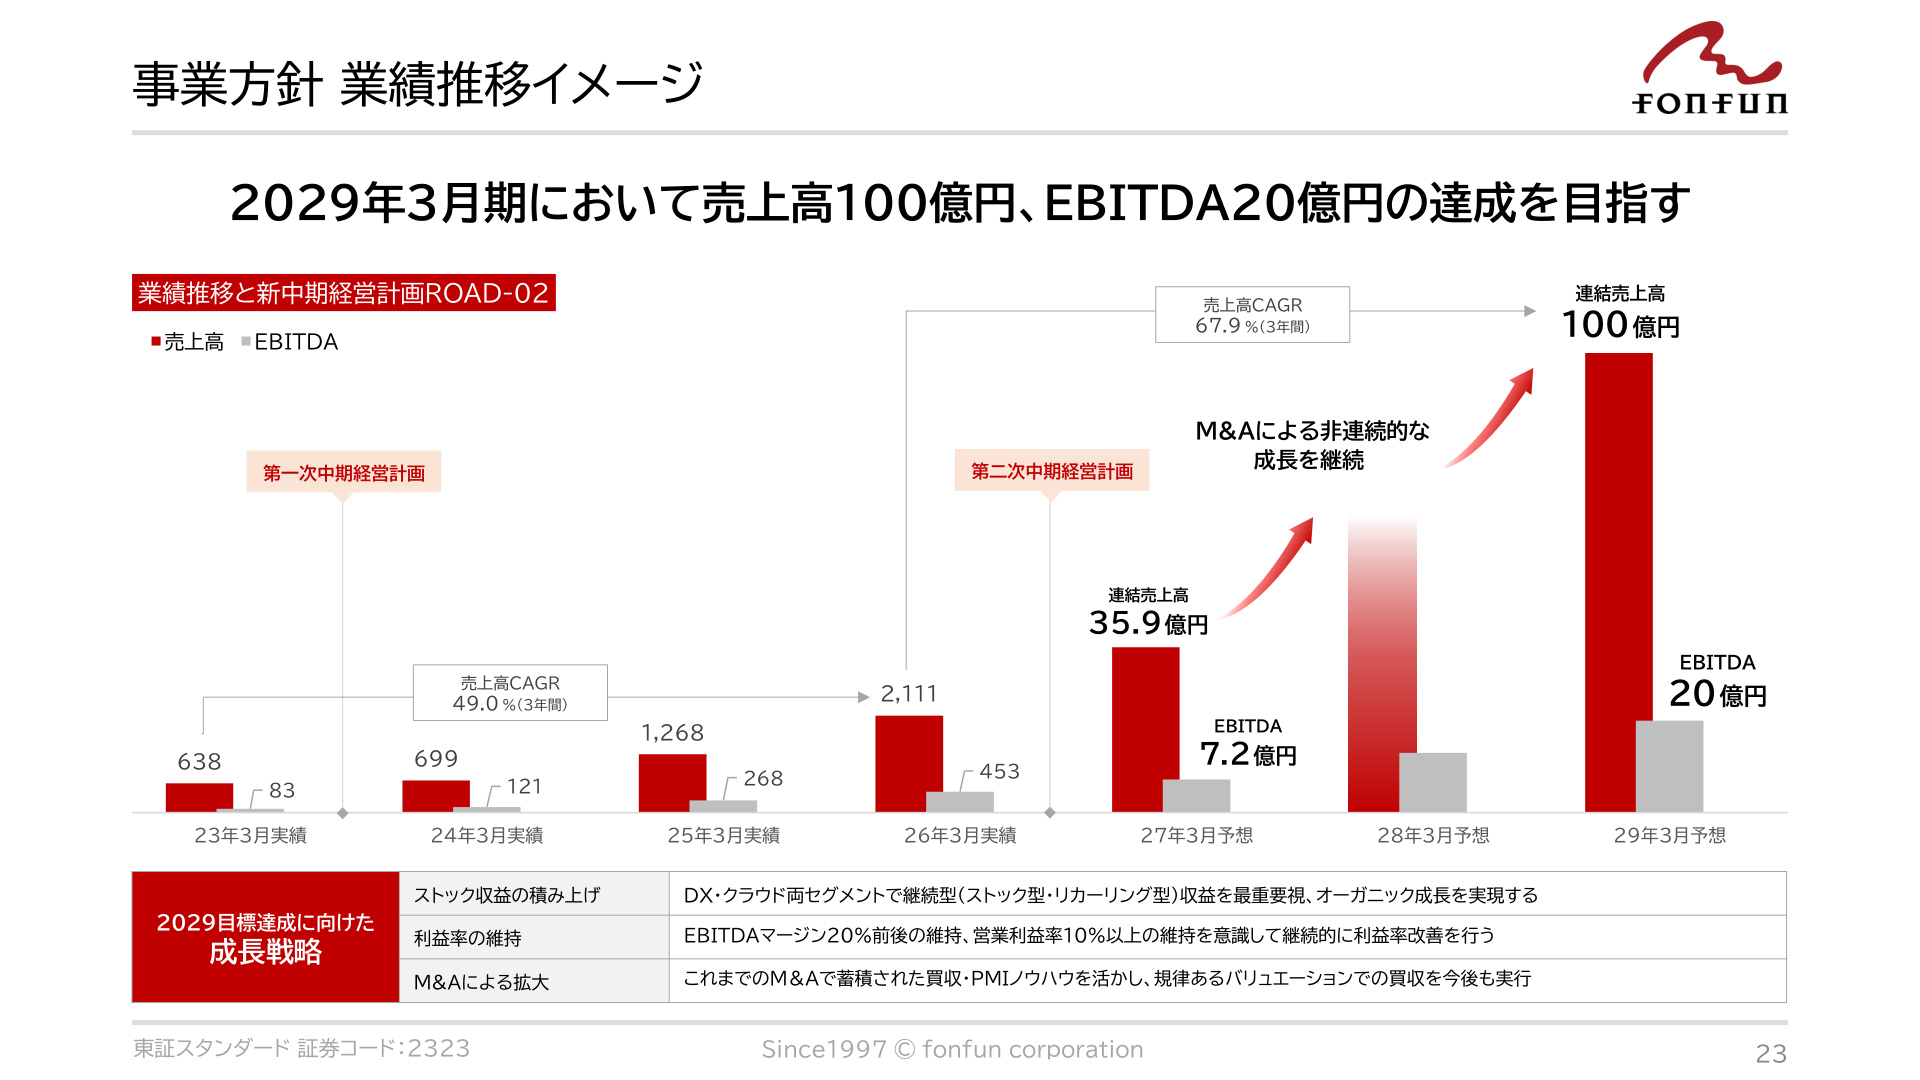
See the slide below for the medium-term growth outlook.
Slide Commentary: Performance Outlook toward FY2029
This slide is the most critical numerical target document, depicting the exponential growth curve fonfun aims to achieve. From revenue of 638 million yen and EBITDA of 83 million yen in FY2023, the company grew rapidly to 2.11 billion yen in revenue and 453 million yen in EBITDA by FY2026 through the first plan. For the final year of "Project Phoenix II" in FY2029, the company has set a mega-goal of 10 billion yen in revenue, 2 billion yen in EBITDA, and a market capitalization of 30 billion yen. As the graph shows, the plan targets high-angle upward growth by combining organic growth with non-linear M&A accumulation.
Three Priority Strategies of the Medium-Term Plan
-
Business Strategy (AI-Driven Management and Stock Revenue Expansion)
- Continued DX Roll-up : Ongoing acquisition of SaaS and SES companies.
- Profitability Enhancement : Prioritizing fixed ARR (stock revenue) from SaaS products and recurring revenue from SES/maintenance to build a high-quality, stable revenue base.
- AI-Driven Management : Transforming into a "with AI" company by embedding AI into all operations , including M&A sourcing, due diligence (DD), post-merger integration (PMI), and development sites.
-
Financial Strategy
- Funding : Planning to raise 5 billion yen for M&A (primarily through debt financing such as senior loans).
- Capital Efficiency and Dilution Control : Managing the D/E ratio (within 1.0–1.5x) to minimize dilution for existing shareholders, with a strong focus on per-share metrics ( EPS/BPS ).
-
IR Strategy
- In addition to retail investor outreach, the company will enhance disclosure for institutional and professional investors , providing transparent management information focused on capital costs such as ROE, ROIC, and WACC.
5. FY2027 Full-Year Forecast and Future Focus Points
FY2027 Consolidated Earnings Forecast
- Revenue : 3,599 million yen (up 170.4% YoY)
- Adjusted Operating Profit (EBITDA) : 721 million yen (up 159.1% YoY)
- Operating Profit : 472 million yen (up 195.0% YoY)
- Ordinary Profit : 447 million yen (up 164.9% YoY)
- Net Income Attributable to Owners of Parent : 446 million yen (up 105.1% YoY)
- Forecast EPS : 21.26 yen
- Forecast ROE : 28.6%
Note that this forecast does not include potential upside from future M&A . Therefore, the structure allows for further earnings growth if new M&A deals are completed and disclosed during the fiscal year.
Summary of Future Focus Points
- Expansion of M&A Pipeline : Leveraging a track record of screening over 1,500 deals in the past three years, the company is expanding target scale to approximately 3 billion yen in revenue and up to 2 billion yen in investment (within 5x EBITDA multiple).
- Productivity Reform via "AI-Driven" : Can the company adapt to the AI-era environment—where "SaaS is dead"—by commercializing its internal know-how for clients and improving BPO efficiency?
- Cost of Capital and Shareholder Returns : Following the first dividend since inception in 2025, will the company continue to enhance long-term shareholder value through the growth of BPS and EPS?
fonfun has completed its turnaround phase and is now steering full-speed into a new growth cycle, aiming to become a 10-billion-yen "AI-Driven DX Technology Company."
This content is not intended as investment advice or a recommendation. Any opinions expressed are solely the personal views of each article.