


Finatext Holdings Q1 FY2026 Earnings Analysis: Robust 35% Revenue Growth Driven by 95% Surge in Usage-Based Revenue; Strategic AI Investments and Next-Gen Financial Infrastructure Expansion

StockClub
Published: Aug 12, 2026, 10:27 AM
Sentiment Analysis

1. Executive Summary: Overview of Q1 FY2026 Results
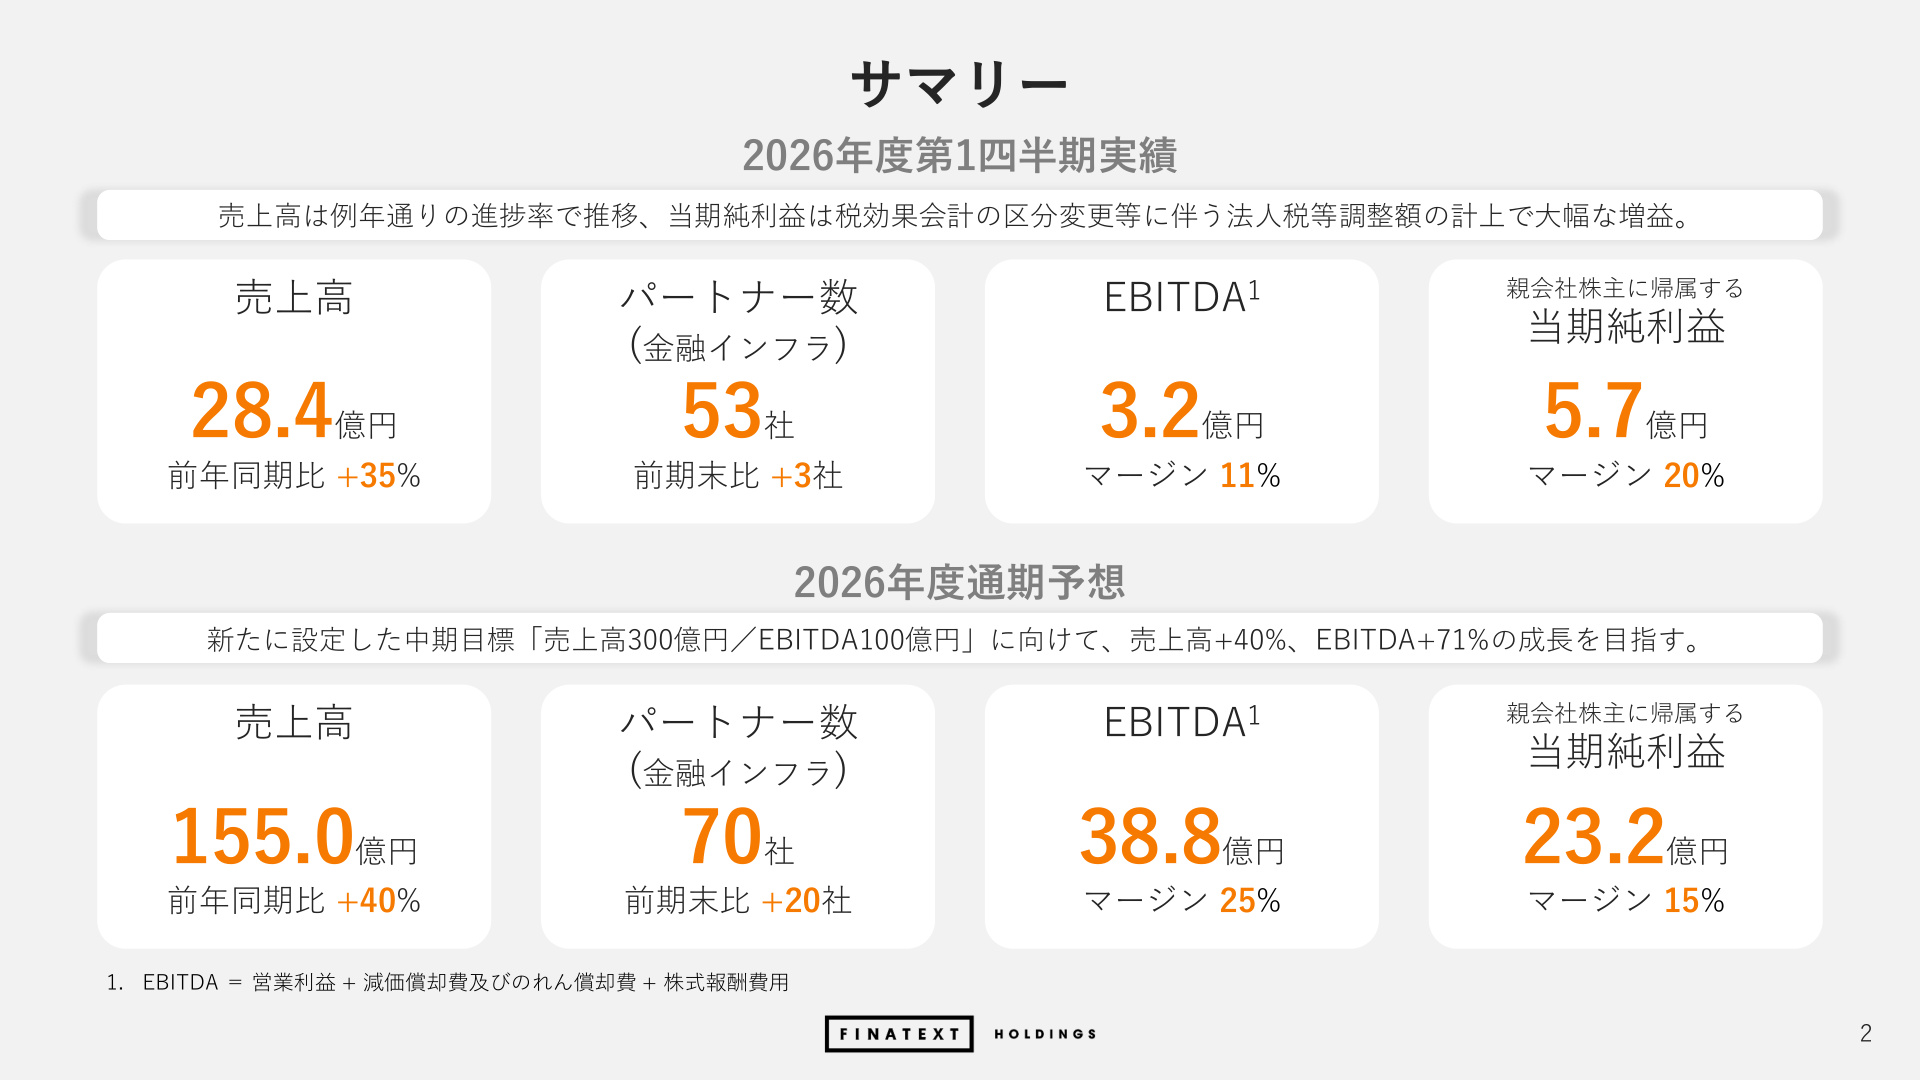
Finatext Holdings (Securities Code: 4419) achieved strong growth in the first quarter (Q1) of the fiscal year ending March 2026, with revenue reaching ¥2.843 billion (+35% YoY) . Despite the absence of large-scale development projects that impacted the same period last year, the company’s performance was strongly driven by the expansion of its core segments and revenue base.
Profit attributable to owners of the parent rose significantly to ¥565 million (+54% YoY) , bolstered by a ¥579 million tax effect adjustment related to changes in tax accounting classifications. Furthermore, the company maintained an EBITDA of ¥323 million (+9% YoY) , sustaining an 11% margin while continuing aggressive investments in AI and new product development.
Please refer to the summary slide below for an overview of the earnings highlights and progress toward full-year targets.
Significance and Background of the Above Slide (PAGE_1)
This slide is critical as it encapsulates the Finatext Group’s short-term performance progress and its mid-to-long-term growth story (full-year forecasts and medium-term targets) .
First, the ¥2.84 billion in revenue (up 35% YoY) represents an 18% progress rate against the full-year target of ¥15.5 billion. Given the company’s seasonality—where development revenue tends to be weighted toward the second half and Q4—this indicates a steady pace of progress consistent with historical trends . Second, the number of partners forming the foundation of its financial infrastructure has steadily increased to 53 (+3 from the end of the previous fiscal year) . This growth is a vital leading indicator, as it translates directly into future recurring and usage-based revenue, rather than just one-off development income. Furthermore, the company has set ambitious full-year targets of ¥15.5 billion in revenue (+40% YoY) and ¥38.8 billion in EBITDA (+71% YoY) , marking a strong start to the first year of its new medium-term goal of "¥30 billion in revenue / ¥10 billion in EBITDA."
2. Shifts in Revenue Quality: Deep Dive into Revenue by Type
A crucial element in understanding the company’s performance is the breakdown of revenue by type: "Stock (fixed monthly fees, etc.)," "Usage-Based (linked to AUM, transaction volume, etc.)," and "Flow (initial development, etc.)."
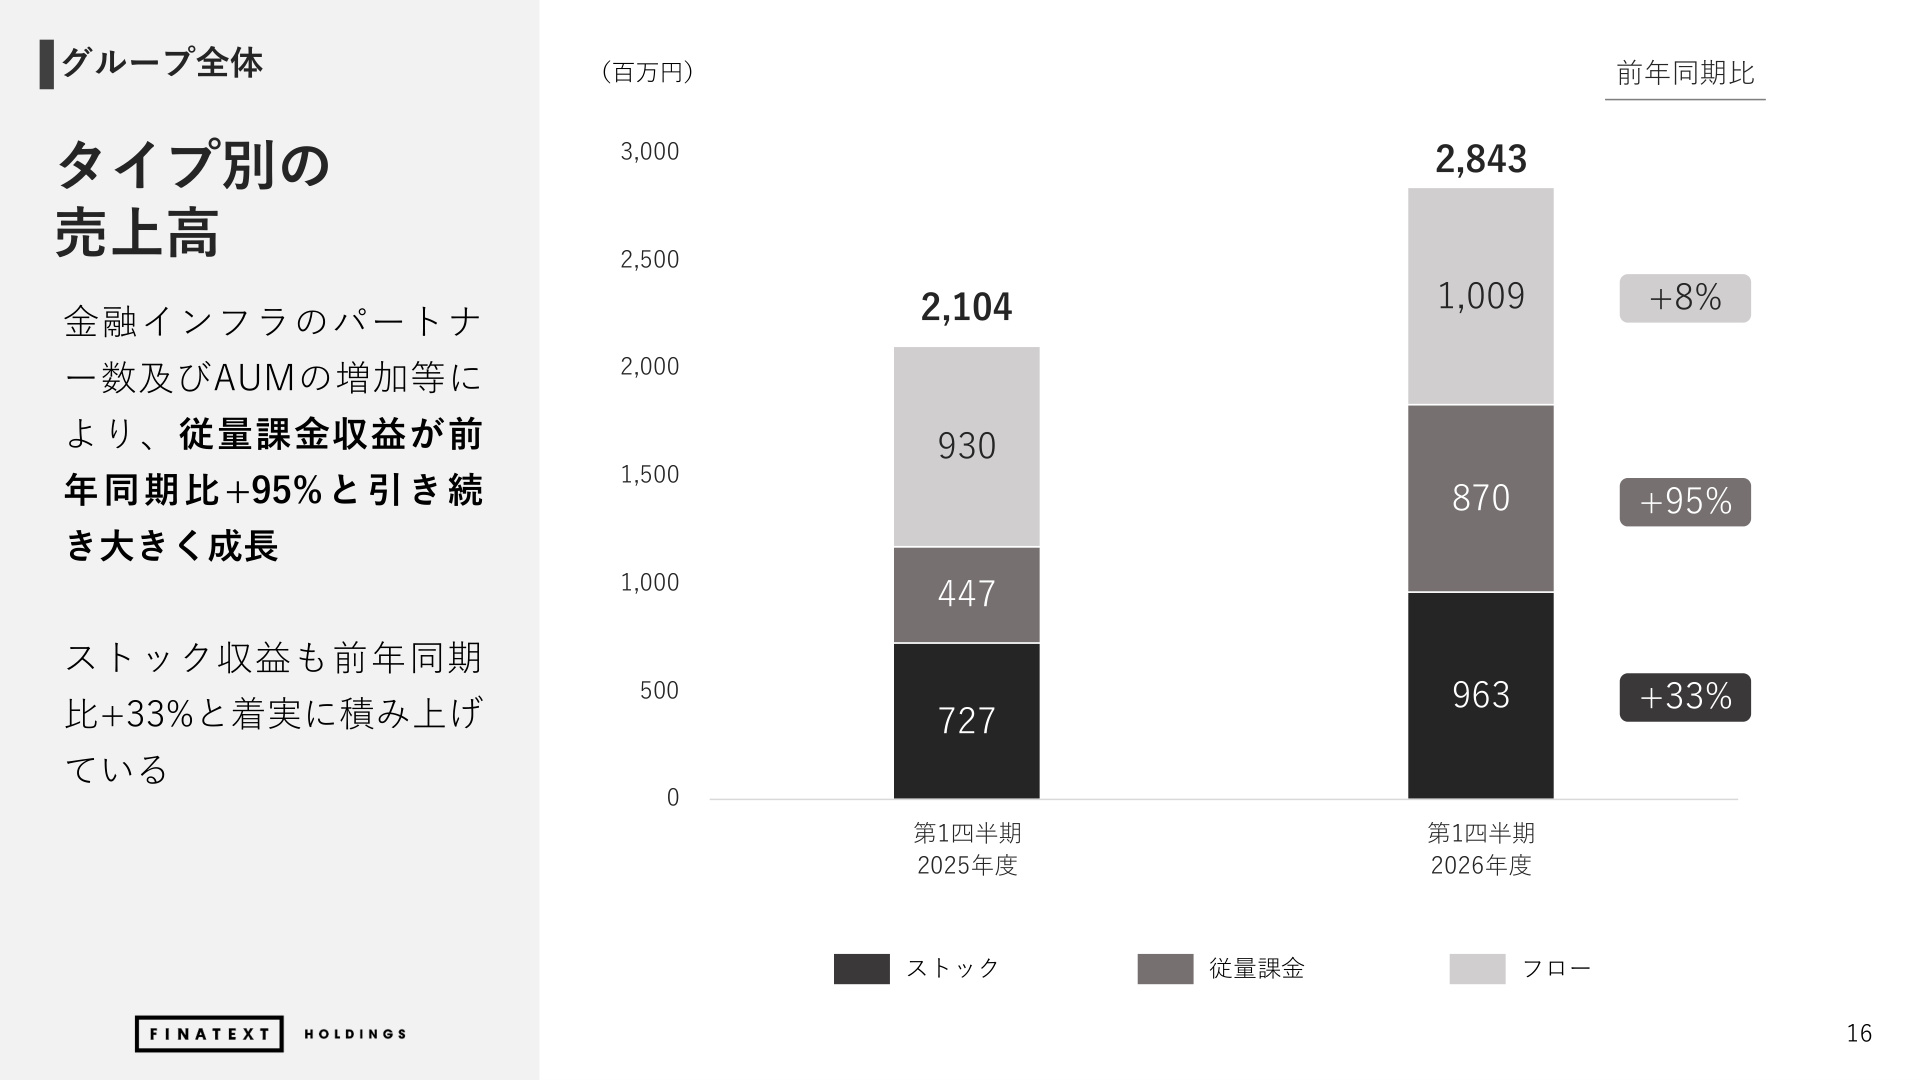
The most notable development this quarter was the explosive growth in usage-based revenue . The structural shift is evident in the slide below.
Significance and Background of the Above Slide (PAGE_15)
This slide serves as evidence of the enhanced profitability and scalability of the company’s business model.
Data shows that usage-based revenue reached ¥870 million (+95% YoY) , nearly doubling. This is attributed to the growth in AUM and transaction volumes among existing financial infrastructure partners, as well as a significant increase in usage within the Data AI segment. Meanwhile, stock revenue, the foundation of the business, continued its steady climb to ¥963 million (+33% YoY) . Although flow revenue (¥1.09 billion, +8% YoY) faced a headwind from large-scale projects in the previous year, it remained positive. Overall, the share of high-margin, highly continuous revenue ("Stock + Usage-Based") has solidified at 69% , demonstrating that the group’s revenue base is shifting toward a more robust and stable structure.
3. Segment Performance and Growth Drivers
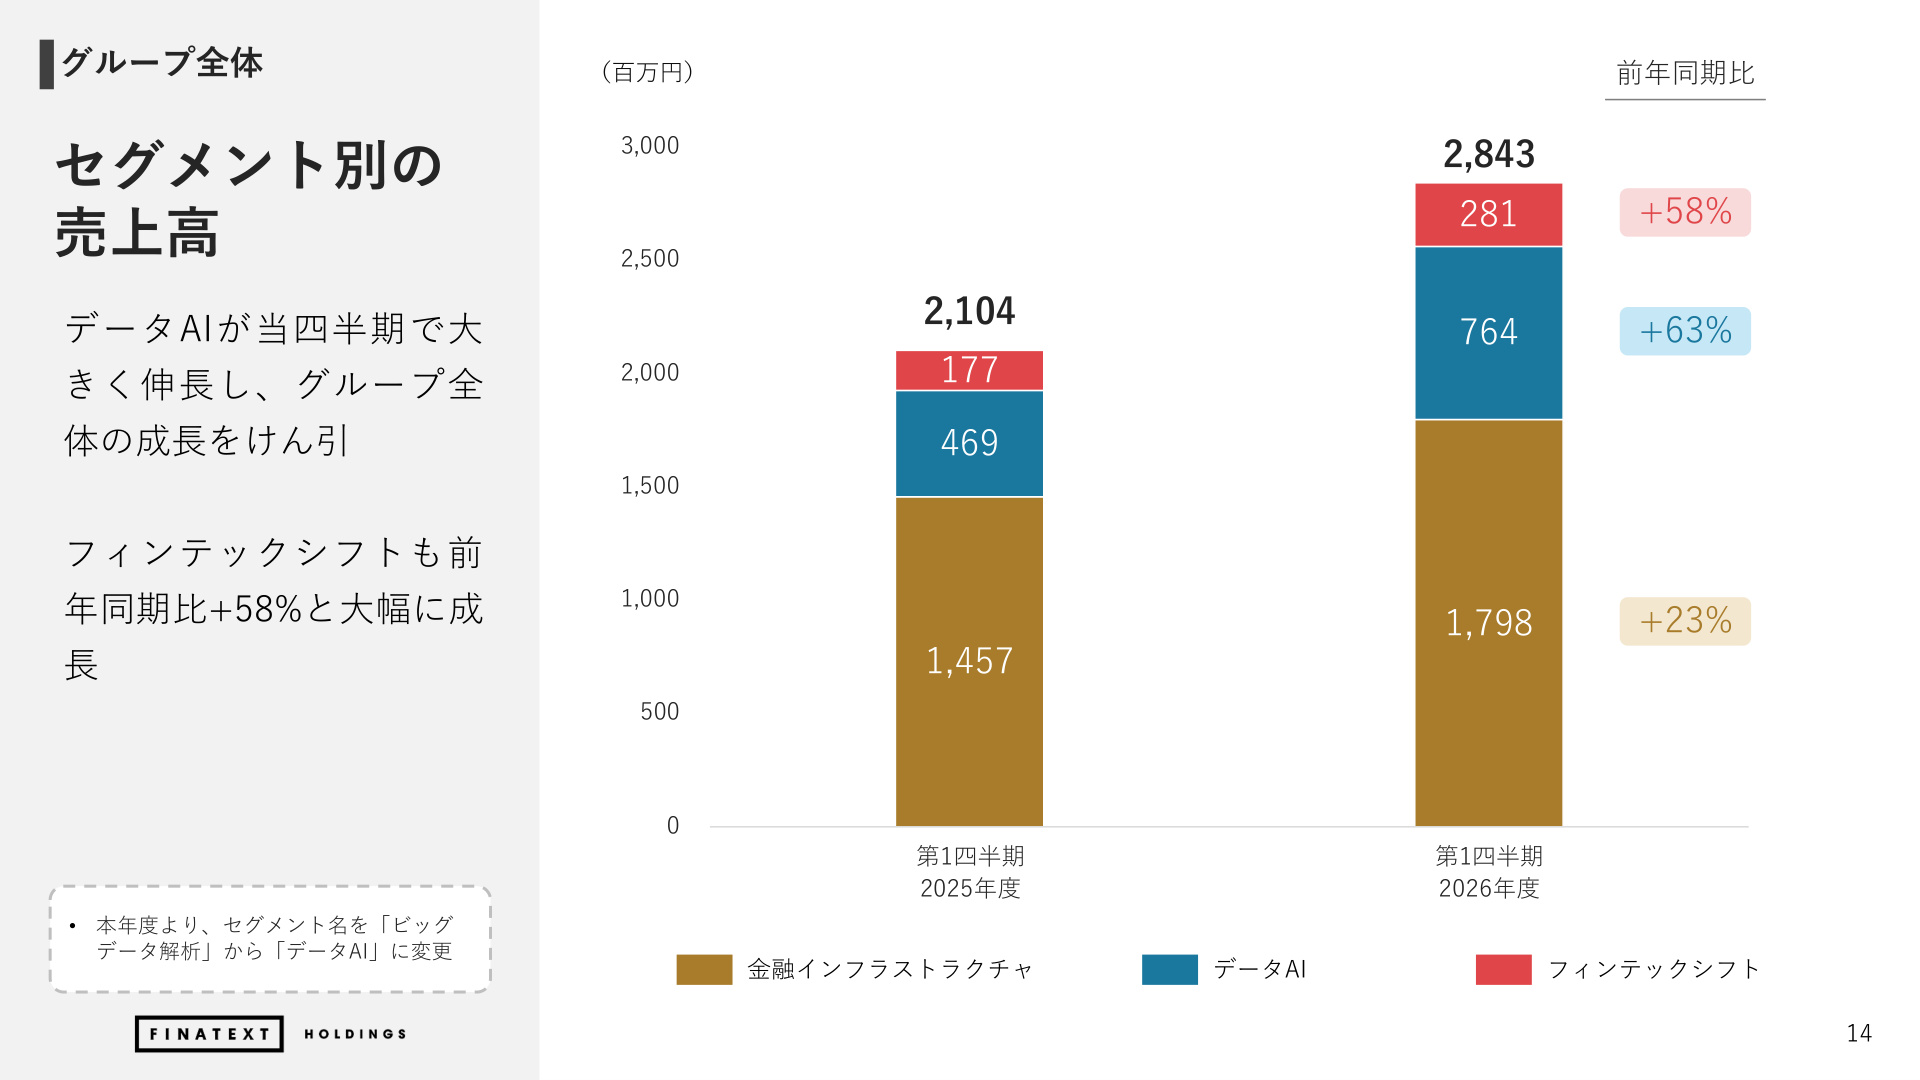
Next, we examine the performance of each business segment: "Financial Infrastructure," "Data AI," and "Fintech Shift." (Note: "Big Data Analysis" has been renamed to "Data AI" starting this fiscal year).
The revenue trends by segment are as follows:
Significance and Background of the Above Slide (PAGE_13)
This slide clearly illustrates the balanced contribution of each segment to the group’s overall growth .
In addition to the steady growth of the core Financial Infrastructure business, the Data AI segment grew by 63% YoY (¥764 million) , and the Fintech Shift segment grew by 58% YoY (¥281 million) , highlighting the rapid expansion of peripheral and new business areas. The company’s strength lies in its ability to achieve high growth across all segments rather than relying on a single business.
Details for each segment are provided below:
(1) Financial Infrastructure Business
- Revenue : ¥1.798 billion (+23% YoY)
- Breakdown : Securities Infrastructure ¥1.076 billion (+11%), Insurance Infrastructure ¥443 million (+27%), Credit Infrastructure ¥278 million (+100%)
- Commentary : Securities Infrastructure (BaaS) maintained the ¥1 billion level due to increased AUM from existing partners and new project launches. Insurance Infrastructure (Inspire) grew by 27% through expansion into small-amount short-term insurance and projects for major non-life insurers. Credit Infrastructure (Crest) saw revenue double (+100%), showing rapid adoption. The total number of partners increased to 53 (+3 from the end of the previous fiscal year) .
(2) Data AI Business
- Revenue : ¥764 million (+63% YoY)
- Commentary : Driven by the rising demand for generative AI and LLM utilization, revenue saw significant YoY growth. The company is rapidly expanding its product range, moving beyond alternative data analysis to include the corporate AI data-matching database "DataLinc" and the construction of a "Corporate-Owned Real Estate Database" in collaboration with TRUSTART.
(3) Fintech Shift Business
- Revenue : ¥281 million (+58% YoY)
- Commentary : High growth was achieved through the adoption of DX support for financial institutions, frontend development, and new solutions such as the AI agent platform "Finstage Cowork."
4. Product Development and Innovation Trends
Rather than simple IT contract development, the company employs a model of building standardized platforms and core products (SoR and AI layers) for horizontal deployment. This quarter, the expansion of AI products and entry into credit card issuance infrastructure were standout topics.
-
AI Workflow and AI Agent Platform Deployment
- AI Workflow Platform : Implemented the first phase of automated assessment for Nissay Plus Small-Amount Short-Term Insurance. By combining AI inference with rule-based logic, the company automated complex insurance assessment tasks, with horizontal deployment to other firms underway.
- Local LLM Platform : Developed a "Local LLM Platform" that processes personal and confidential data on-premises or in a private cloud, avoiding external transmission. Applied to credit card merchant name mapping, it demonstrated a 95.7% cost reduction compared to using the OpenAI API .
- Finstage Cowork : Built and provided dedicated agents that allow for the safe use of external and internal data for business tasks under strict access control and audit logs.
-
Entry into Credit Card Issuance Infrastructure (The 4th Infrastructure)
- Following Securities (BaaS), Insurance (Inspire), and Credit/Lending (Crest), the company is entering the credit card issuance infrastructure market as its "4th financial infrastructure."
- Compliance with industry-standard security (PCI-DSS) is scheduled for completion in July 2026 , providing a seamless mechanism for businesses to embed card issuance functions into their services via API.
5. Cost Structure, Profitability, and Financial Position
Profit Structure and Cost Control
- Cost of Sales : ¥917 million (+22% YoY) . Growth was kept below the revenue growth rate (+35%), resulting in a decline in the cost-to-revenue ratio from 36% to 32% , confirming improved profitability.
- Adjusted SG&A Expenses : ¥1.63 billion (+52% YoY) . The primary driver was a ¥472 million (+142% YoY) increase in revenue-share payments to partners, linked to the rapid growth in usage-based revenue. Other SG&A expenses (¥1.131 billion) were appropriately controlled despite the impact of AI-related costs and currency fluctuations.
- EBITDA and Operating Profit : While operating profit was ¥188 million (-16% YoY) due to factors like stock-based compensation, EBITDA, which indicates cash-generating ability, reached ¥323 million (+9% YoY) .
Financial Position (Balance Sheet)
- Cash and Deposits : Approximately ¥5.4 billion .
- Net Assets : ¥12.328 billion (Total assets ¥25.093 billion, equity ratio approx. 49%).
- Excluding deposits and customer assets related to the securities business, the underlying financial position is very sound, maintaining sufficient liquidity and financial capacity for future AI investments, M&A, and new business development.
6. Outlook and Conclusion
Finatext Holdings’ Q1 FY2026 results represent a strong start toward its medium-term targets (¥30 billion revenue / ¥10 billion EBITDA).
- As seen in the rapid growth of usage-based revenue (+95% YoY) , the financial infrastructure partner base built over the past few years has entered a full-scale "operation and expansion phase."
- The leap in the Data AI segment (+63% YoY) and advanced product groups like local LLMs and AI workflows are beginning to function as new growth engines.
- The company is aggressively promoting the further expansion of its Total Addressable Market (TAM) in the financial SoR domain, such as credit card issuance infrastructure.
Although the Q1 progress rate is 18% due to revenue seasonality, this is consistent with historical trends. With the accumulation of stock and usage-based revenue, these results set the stage for accelerated performance toward the second half of the fiscal year.
This content is not intended as investment advice or a recommendation. Any opinions expressed are solely the personal views of each article.