


Movin Strategic Career Co., Ltd. FY2026 Q2 Earnings Deep Dive Report

StockClub
Published: Aug 12, 2026, 10:17 AM
Sentiment Analysis

Movin Strategic Career Co., Ltd. (Securities Code: 421A, TSE Growth) announced its FY2026 Q2 financial results on August 12, 2026. Driven by a tight labor market and surging demand for AI consulting, the company has achieved significant growth in both revenue and profitability. This report provides a detailed analysis of the growth narrative, covering earnings highlights, shifts in revenue structure, talent strategy, and the upward revision of the full-year forecast based on disclosed materials.
1. Earnings Overview and Highlights
For the first half of the fiscal year ending December 2026 (FY26 H1), the company reported revenue of 3,168 million yen (+76.1% YoY) and operating profit of 1,576 million yen (+62.9% YoY) , both exceeding the previous year's performance and the previously announced revised targets.
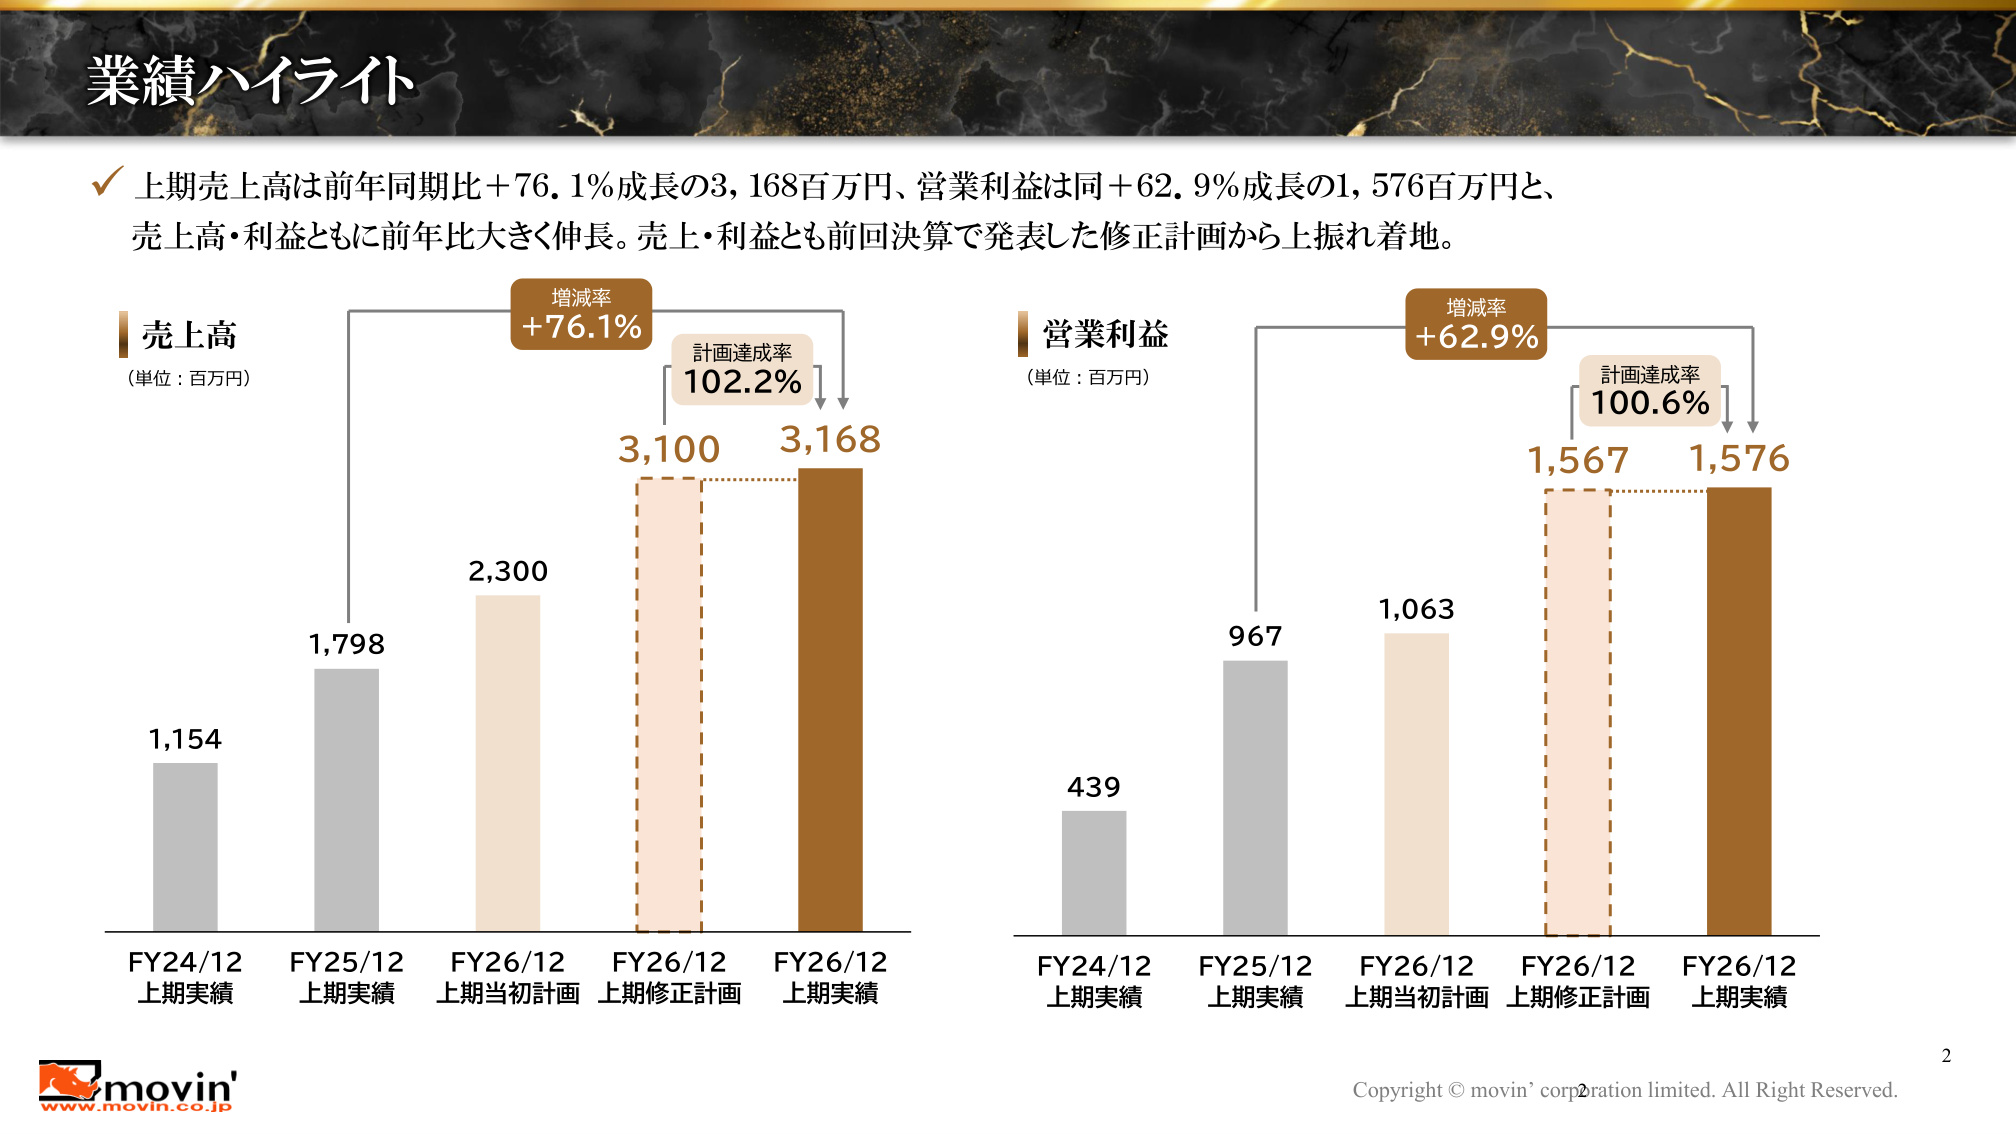
The slide above (Page 2) illustrates the trajectory of revenue and operating profit from FY24 H1 to FY26 H1, along with the latest achievement rates against targets. Revenue surpassed both the initial target of 2,300 million yen and the revised target of 3,100 million yen, reaching a target achievement rate of 102.2% . Operating profit also significantly outperformed the initial target of 1,063 million yen, achieving 100.6% of the revised target (1,567 million yen).
Looking at quarterly trends, standalone revenue for FY26 Q2 (April–June) reached 1,829 million yen (+95.9% YoY) , nearly doubling compared to the same period last year and marking the second consecutive quarter of record-high revenue .
2. Impact Analysis of Changes in Bonus Provisioning
Starting this fiscal year (FY26), the company has changed its criteria for recording bonus provisions . By shifting to a method proportional to annual revenue progress, the amount recorded in Q1 and Q2 (H1) has increased, while the amount for Q3 and Q4 (H2) will decrease.
- Impact on H1 : -243 million yen (a downward factor for operating profit).
- Full-year impact : As this is merely a timing shift within the fiscal year, there is no impact on the full-year total or full-year profit .
When calculated based on the previous criteria, excluding the impact of this accounting change, the operating profit for FY26 H1 would have been 1,819 million yen (+88.1% YoY) . This highlights that the underlying profit growth rate is actually outpacing the revenue growth rate (+76.1%).
3. Dual Engines of Growth: Higher Unit Prices and Increased Placements
The rapid expansion of business is supported by the combination of rising placement unit prices and an increase in the number of successful career transitions (placements) .
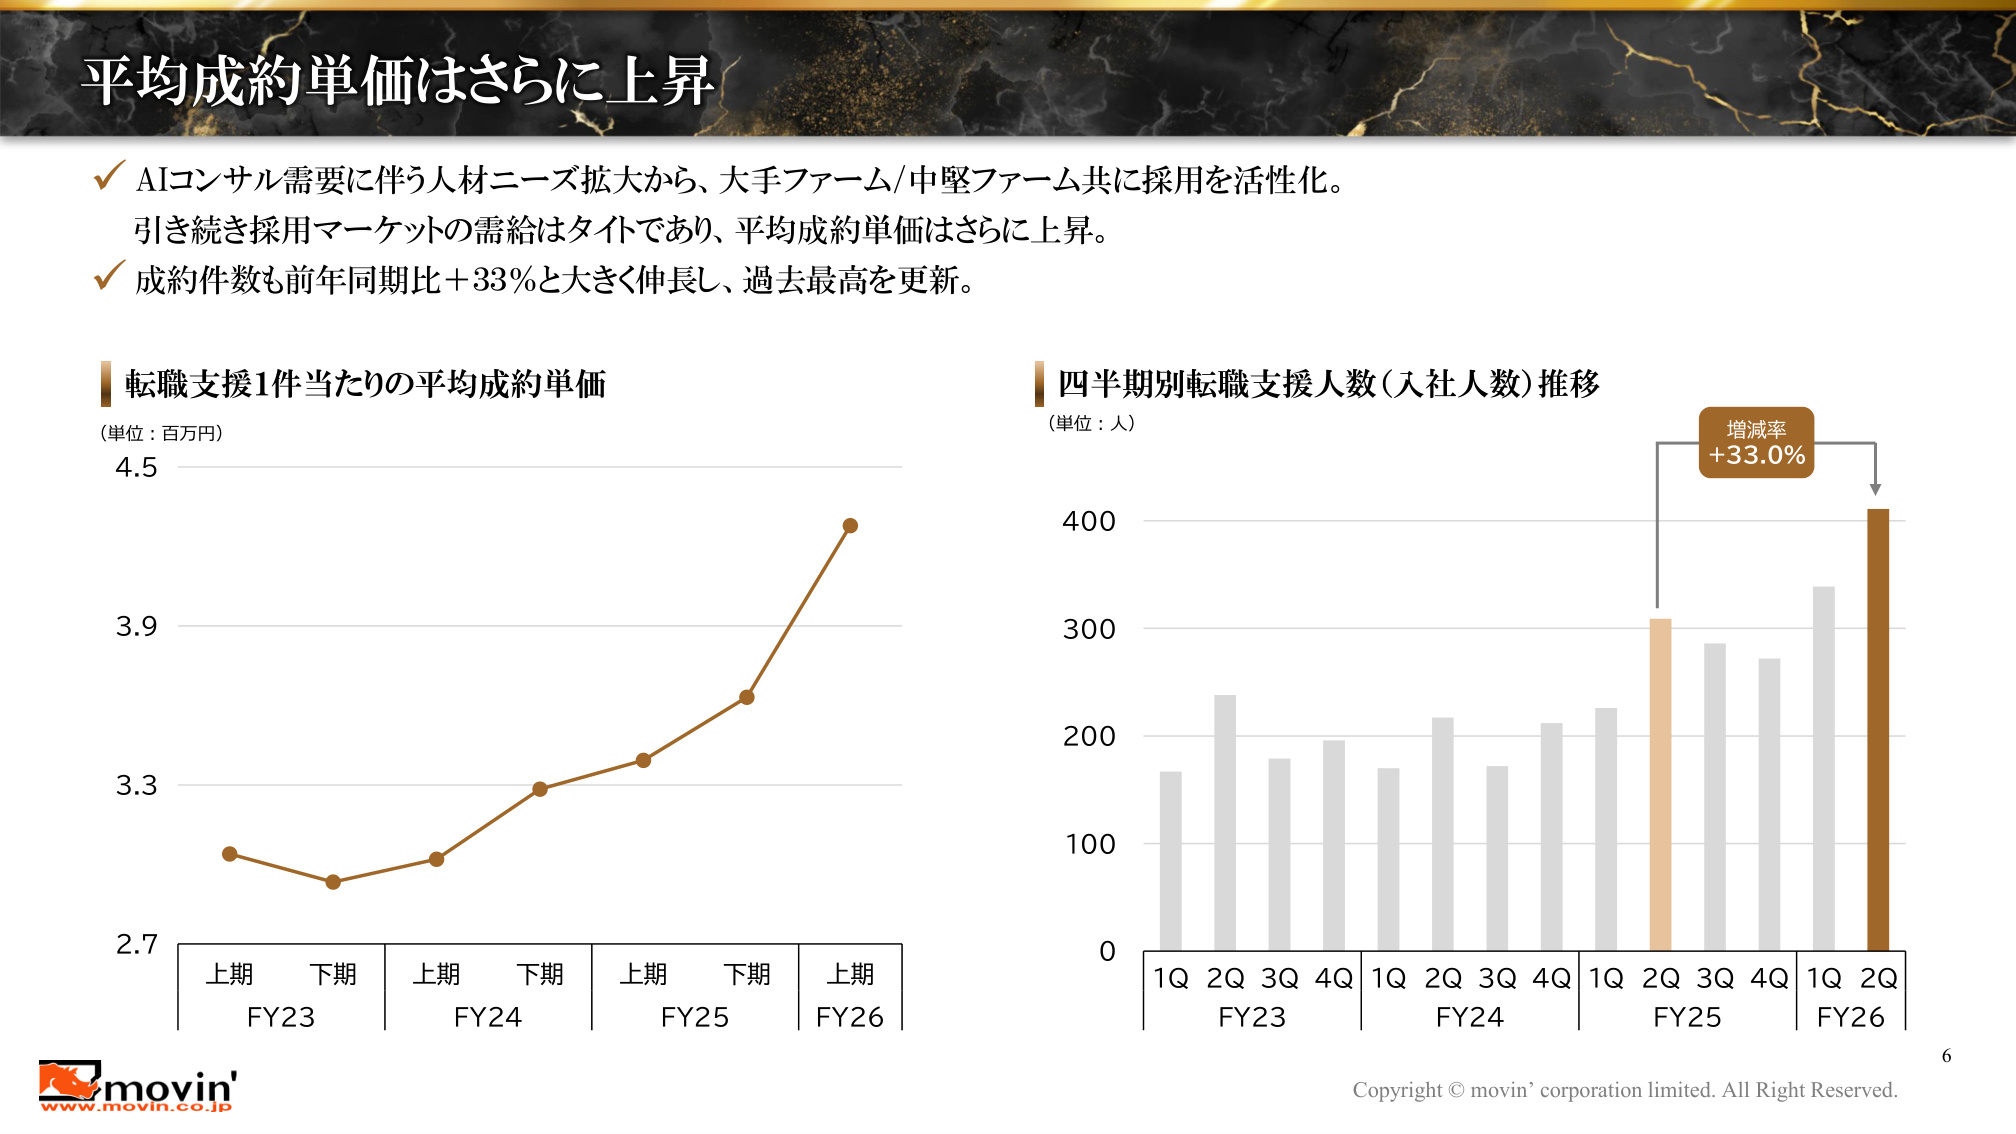
As shown in the slide above (Page 6), the company's key metric, the average placement unit price per career transition , is on a clear upward trend. Driven by the expansion of AI-related hiring needs, particularly in the consulting industry, and intensified competition for high-end talent, corporate hiring appetite remains extremely robust. The placement unit price for FY26 H1 saw an increase of +17.8% compared to FY25 H2.
Furthermore, the quarterly number of career transitions (new hires) shown in the graph on the right also grew significantly by +33.0% YoY in FY26 Q2, reaching a record high. The simultaneous strength in both unit prices and volume is the primary driver behind the doubling of the top line.
4. Expansion of Career Advisors and Productivity Gains
The revenue model in the recruitment business is defined by "Number of Career Advisors (CAs) × Productivity (Revenue per CA)." The company is showing steady progress on both fronts.
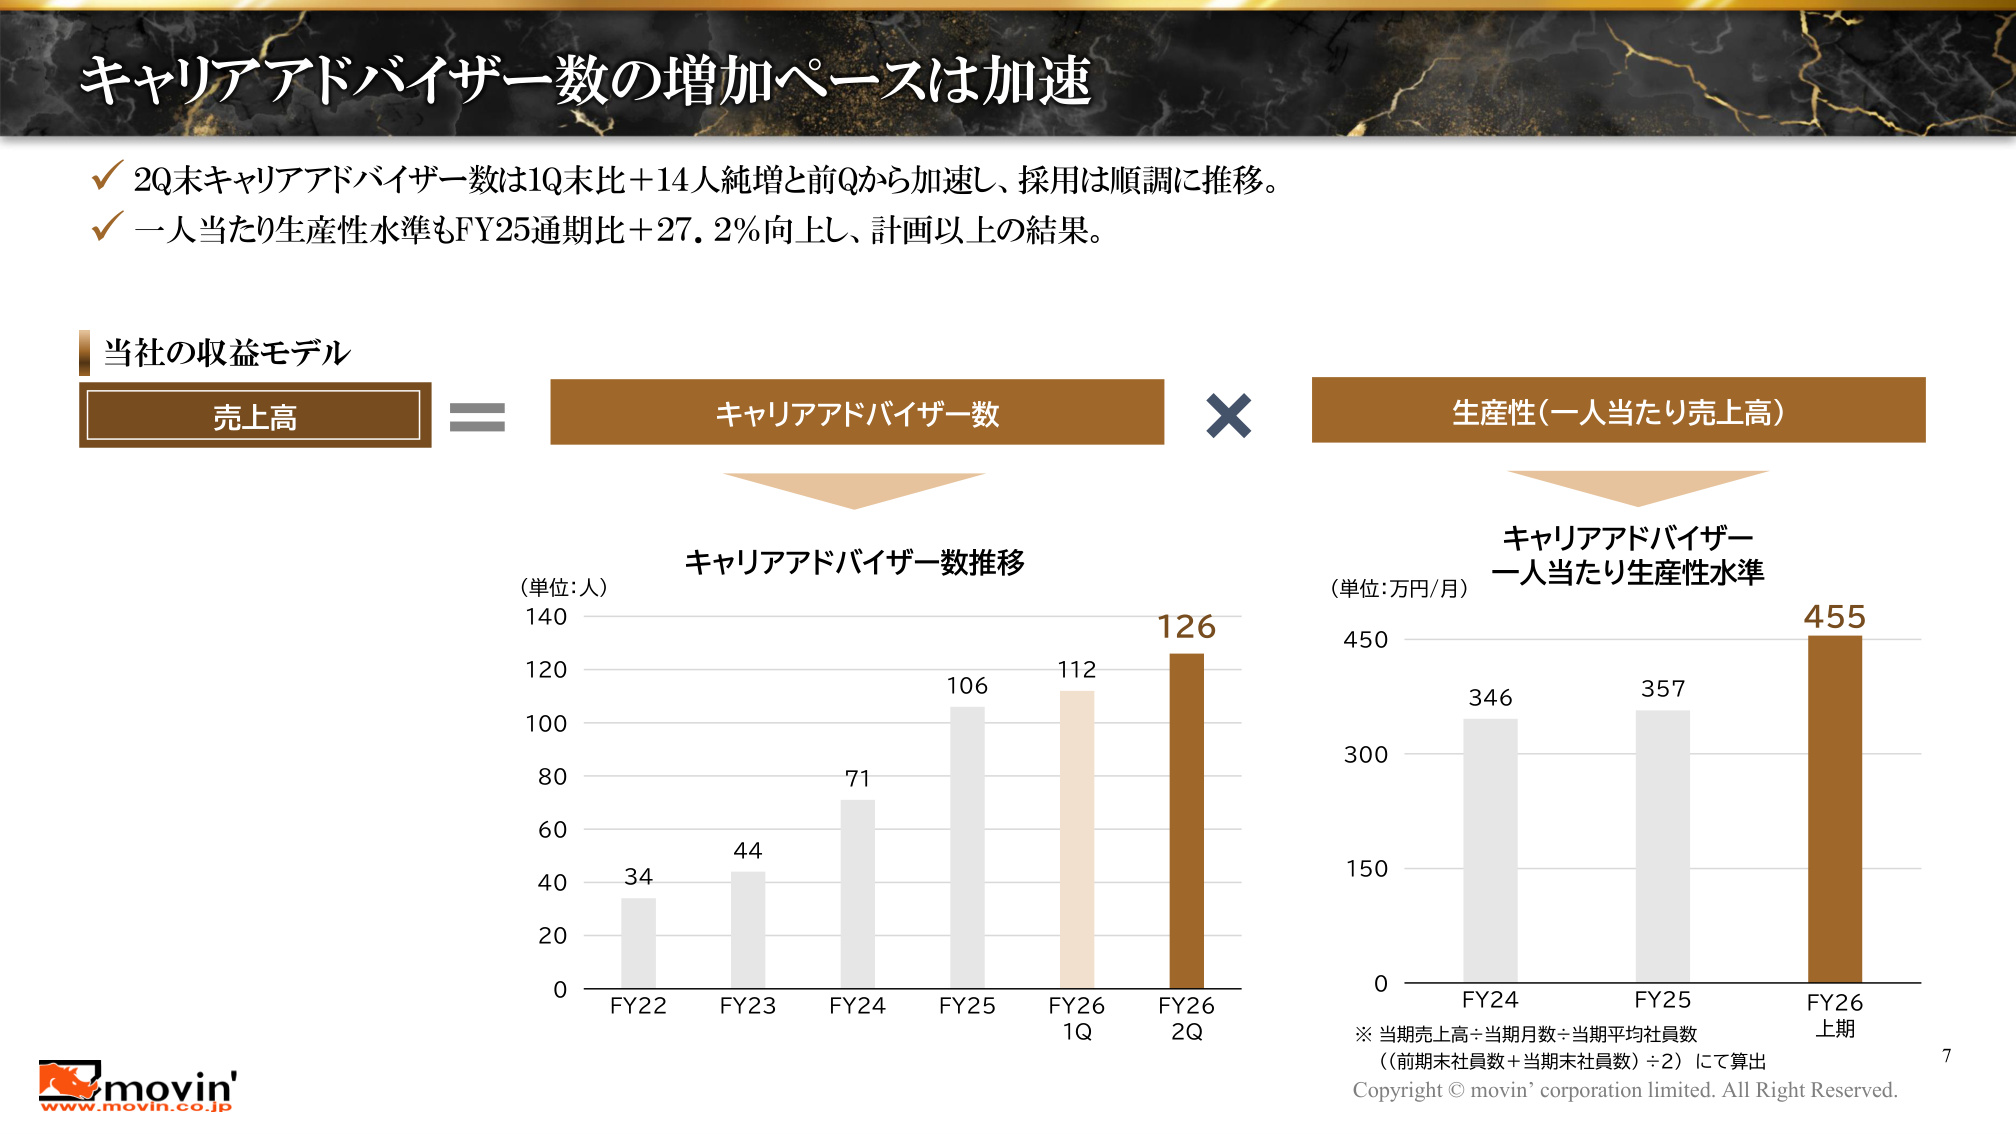
As indicated by the left graph in the slide above (Page 7), the number of CAs reached 126 at the end of FY26 Q2 , a net increase of 14 from the end of Q1. The number of new hires per year is also trending upward, with the company's attractive compensation structure (an average annual salary of 9.8 million yen , exceeding the average for listed recruitment firms) serving as the source of its recruitment competitiveness.
Focusing on the productivity level per person in the right graph, FY26 H1 reached 4.55 million yen per month (+27.2% compared to FY25 full-year results) . Through the establishment of training models, the renewal of sales management systems (DX), and the utilization of generative AI, new CAs are becoming productive faster, allowing the company to achieve both increased headcount and sustained, improved productivity.
5. Proprietary Platform and Agile Customer Portfolio Management
Two structural strengths underpin the company's competitive advantage:
-
In-house Attraction Platform (Reduced Advertising Costs and Maximized LTV) Rather than relying on external scout sites, the company leverages its 25-year history and extensive web content (over 32,900 pages) to maintain a proprietary database of approximately 118,000 professional talents . By repeatedly supporting career changes through its "Concierge Desk," the company aims to maximize the LTV (Lifetime Value) of each customer .
-
Agile Customer Portfolio Rotation The company dynamically reallocates sales resources in response to shifting hiring needs among consulting firms and high-growth companies. With four of the top 10 revenue-generating clients changing over the last three years, the company has established a system to concentrate its approach on the companies with the highest hiring appetite .
6. Second Upward Revision of Full-Year Forecast and Mid-Term Management Plan
Based on the current favorable business environment and H1 results, the company has announced a second upward revision to its FY2026 full-year earnings forecast .
- Full-year Revenue : 6,400 million yen (+10.3% from the previous revised plan of 5,800 million yen; +68.4% YoY )
- Full-year Operating Profit : 3,030 million yen (+13.9% from the previous revised plan of 2,660 million yen; +68.3% YoY )
With the FY26 plan revised upward, progress toward the mid-term management plan goal of "10 billion yen in revenue by 2028 (CAGR of approx. 38%)" has significantly accelerated. While quarterly revenue may fluctuate due to the nature of the success-fee model, the underlying trend on a semi-annual basis remains extremely solid.
Conclusion
Movin Strategic Career's FY2026 Q2 earnings were the result of synergistic effects from rising placement unit prices driven by AI consulting demand , net growth in CA headcount and productivity , and a high-margin attraction model utilizing a proprietary database . Including the second upward revision of the full-year forecast, the results demonstrate steady progress toward the company's mid-to-long-term growth targets.
This content is not intended as investment advice or a recommendation. Any opinions expressed are solely the personal views of each article.