


Plaza Holdings: Q1 FY2027 Earnings Deep Dive Report

StockClub
Published: Aug 11, 2026, 09:59 AM
Sentiment Analysis

This report provides a detailed analysis of the Q1 FY2027 financial results (April 1, 2026 – June 30, 2026) for Plaza Holdings Co., Ltd. (Securities Code: 7502), based on the company's earnings presentation materials. We examine the overall performance, underlying structural factors, segment progress, and future growth strategies.
1. Earnings Highlights: Temporary Revenue and Profit Decline Due to Strategic Restraint
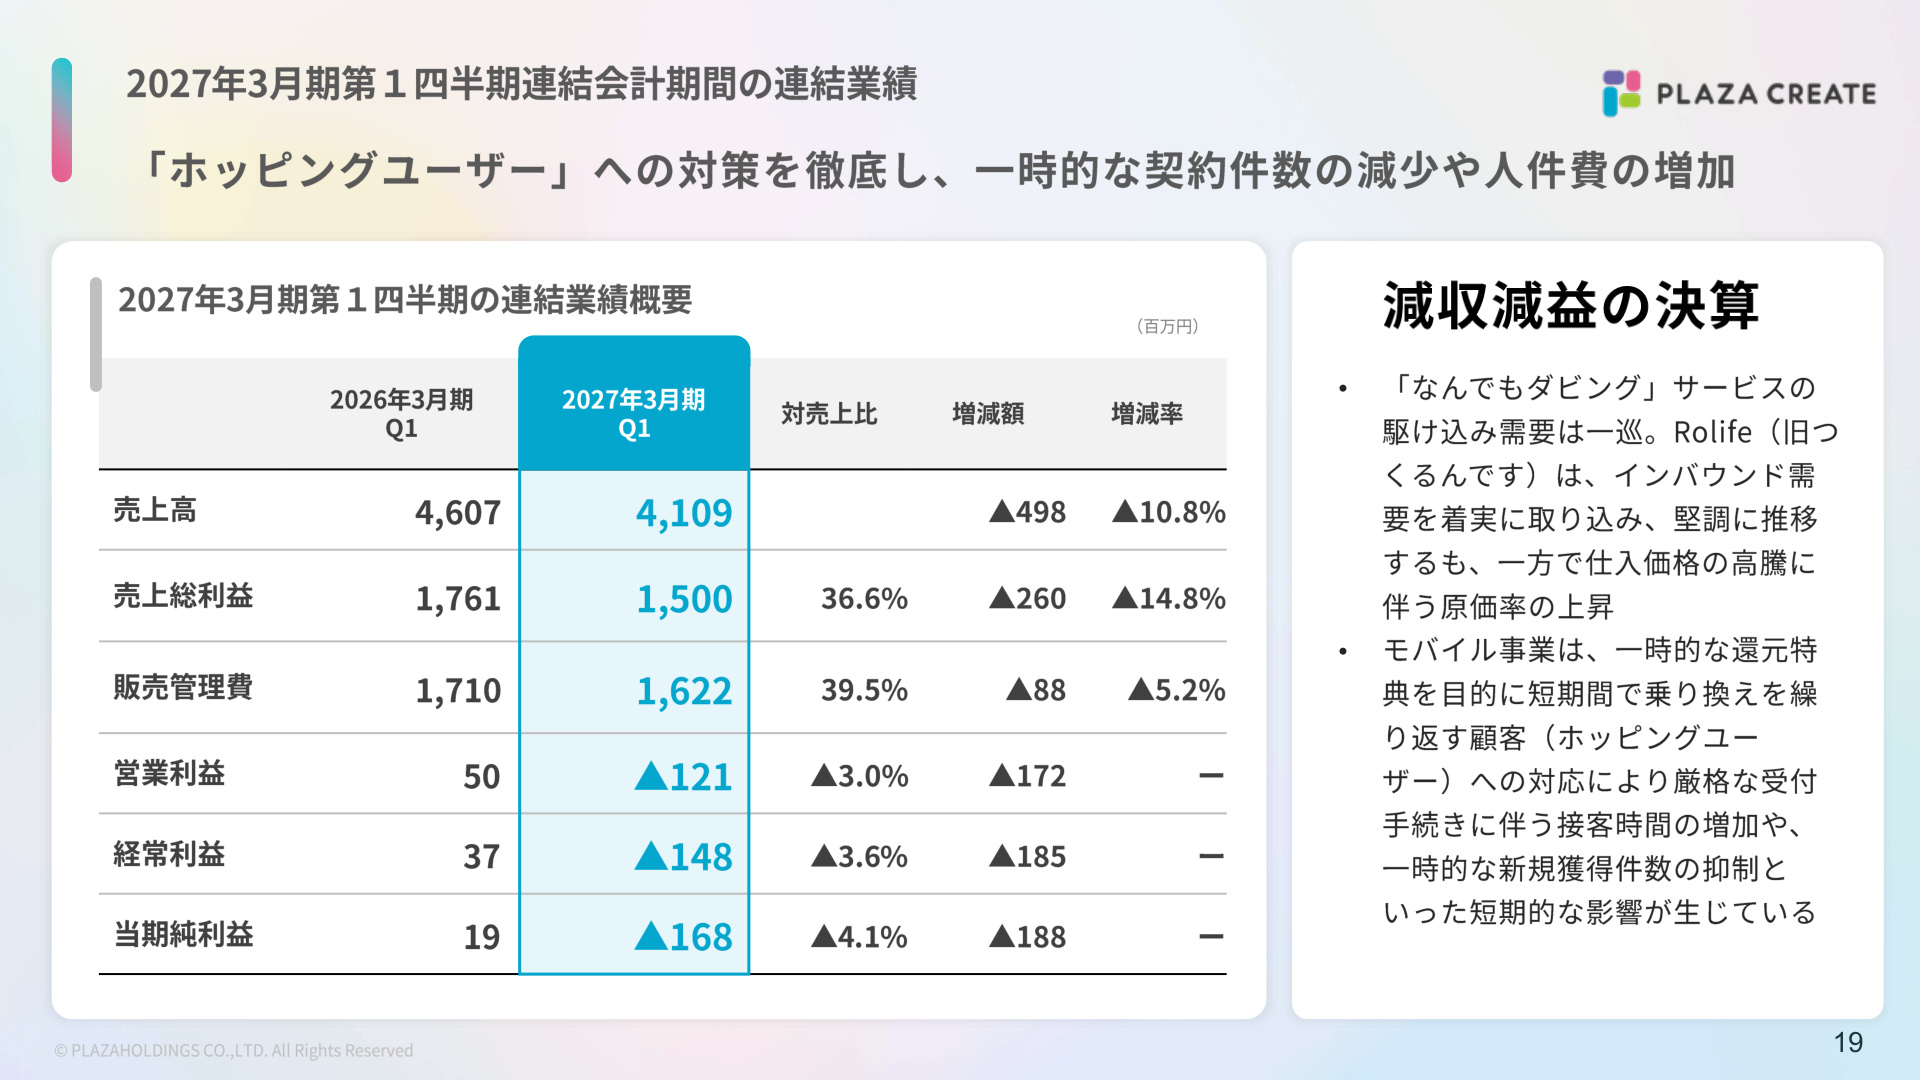
For the first quarter of the fiscal year, Plaza Holdings reported consolidated net sales of ¥4,109 million (down 10.8% YoY ), an operating loss of ¥121 million (compared to a profit of ¥50 million in the same period last year), an ordinary loss of ¥148 million (compared to a profit of ¥37 million), and a net loss attributable to owners of the parent of ¥168 million (compared to a profit of ¥19 million).
The primary drivers for the revenue decline and the shift to an operating loss include the rigorous implementation of "anti-hopping user" measures in the core mobile segment, which temporarily suppressed contract acquisitions and increased labor costs due to longer customer service times. Additionally, the imaging segment faced soaring procurement costs and the normalization of the one-time demand for the "Nandemo Dubbing" (digitization) service.
The following slide provides an overview of the consolidated financial results for the first quarter.
[Significance and Background of Slide 19]
This slide is critical as it clearly illustrates the overall numerical impact the company faced at the start of the fiscal year. In addition to a ¥498 million decrease in net sales compared to the previous year, gross profit was squeezed to ¥1,500 million (down 14.8% YoY ). While the company managed to contain SG&A expenses to ¥1,622 million (down 5.2% YoY ), it could not offset the margin compression caused by lower revenue, resulting in a ¥172 million profit decline (swinging to a loss) at the operating level. While the results appear severe at first glance, this decline is underpinned by structural reform measures intentionally executed by the company to strengthen its long-term management foundation.
2. Core Strategy: Rebuilding the Customer Base from "Quantity to Quality" in the Mobile Business
The mobile segment, which accounts for approximately 80% of the company's consolidated sales, is undergoing a major shift in business policy: strengthening its response to "hopping users."
The Hopping User Problem and Policy Shift
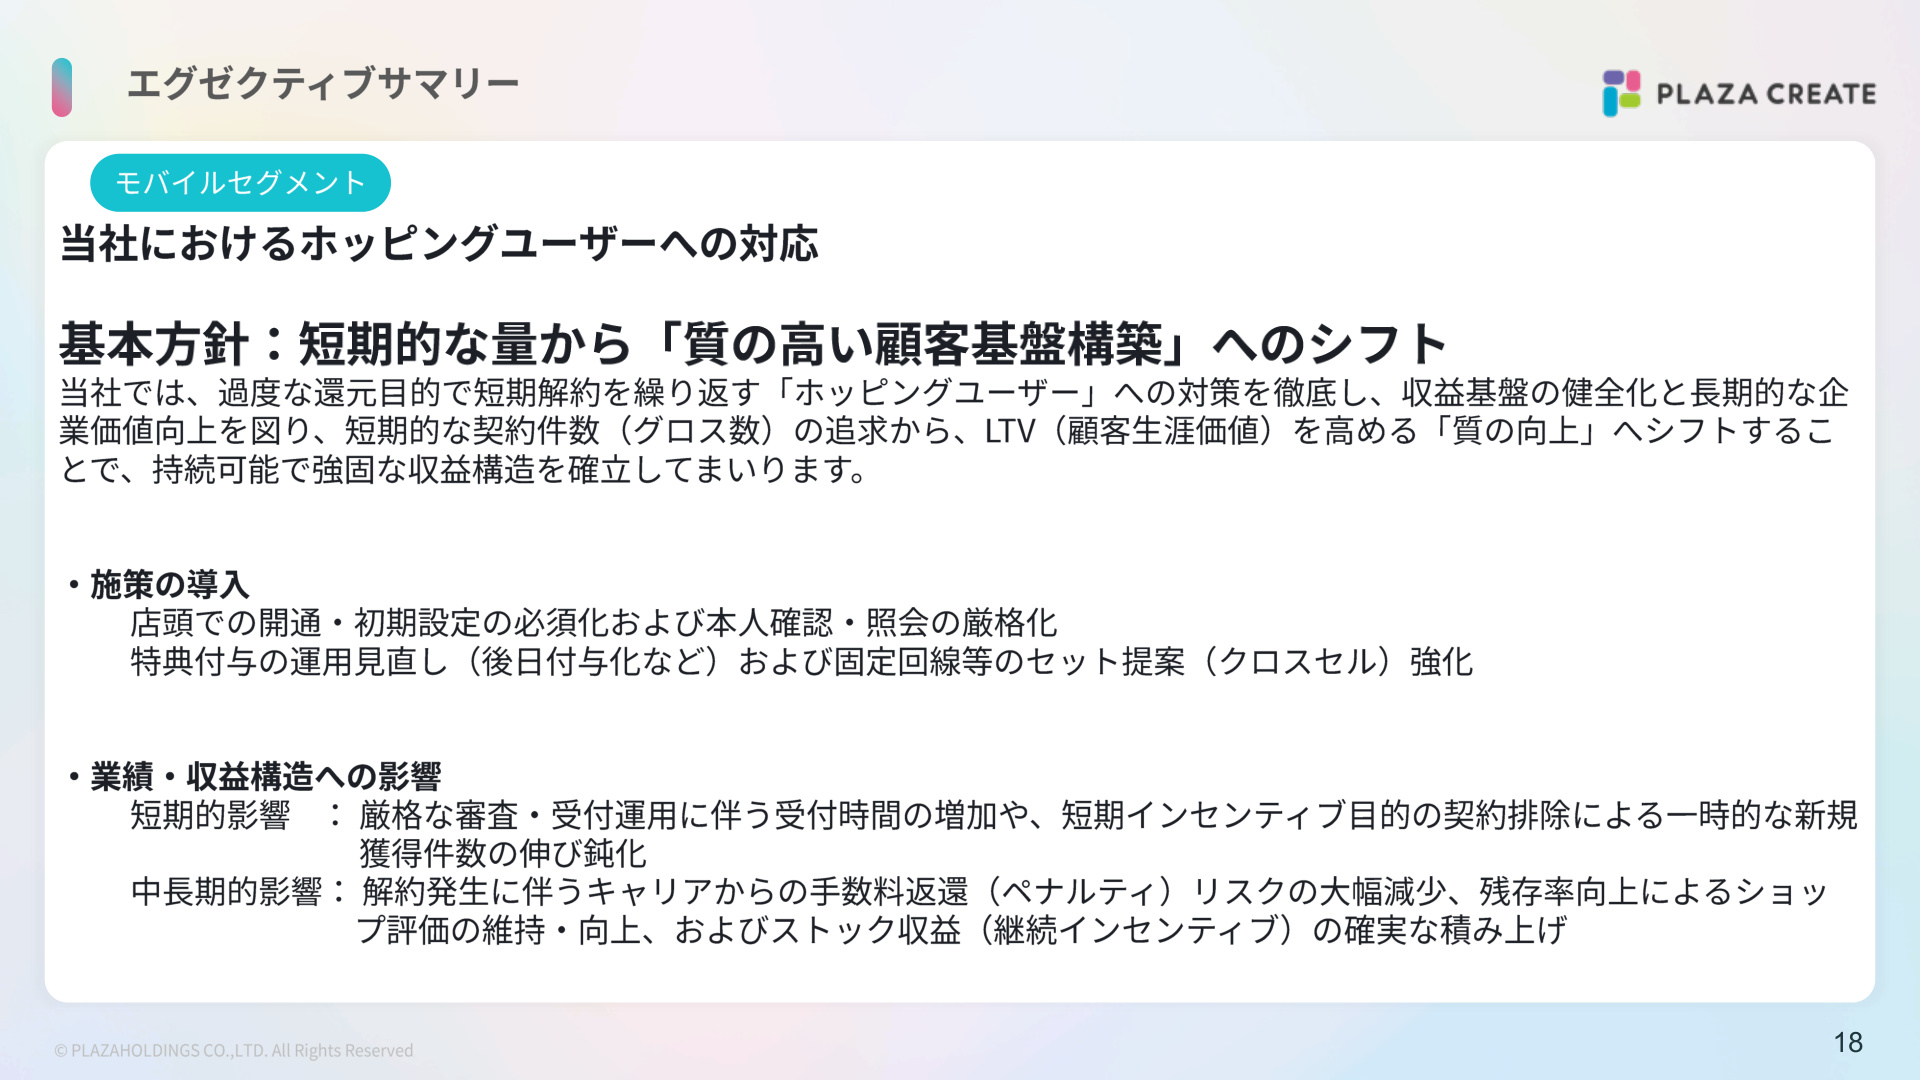
In recent years, the mobile communications market has struggled with "hopping users"—customers who repeatedly cancel and switch carriers in short periods to exploit excessive promotional incentives. The company has prioritized a shift from the traditional pursuit of "short-term contract volume (gross numbers)" to "building a high-quality customer base" that enhances Customer Lifetime Value (LTV).
The following slide outlines these anti-hopping measures and their impact on performance and profit structure.
[Significance and Background of Slide 18]
This slide serves as vital evidence that the factors depressing current performance are not "transient failures" but rather "upfront investments and structural reforms for mid-to-long-term profitability." Specific measures implemented include mandatory in-store activation and initial setup , stricter identity verification , revision of incentive distribution (e.g., deferred payouts) , and strengthened cross-selling of fixed-line services .
These stricter protocols have caused a dual impact in the short term:
- Cost and Efficiency : Increased time required for screening, explanation, and processing has led to longer service times, resulting in higher labor and operational costs .
- Revenue : By eliminating contracts driven by short-term incentives, new acquisitions have temporarily declined, leading to a decrease in short-term incentive income from carriers .
Conversely, the mid-to-long-term benefits include a significant reduction in the risk of carrier clawbacks (penalties) due to churn , improved store ratings through higher retention rates, and the steady accumulation of recurring revenue such as continuous incentives. It can be said that in Q1, the company chose to accept short-term profit declines to establish a robust future revenue structure .
3. Segment Trends and Progress in Business Structural Reform
(1) Mobile Segment
- Performance Overview : Net sales of ¥3,198 million (down 14.3% YoY ), segment operating profit of ¥47 million (down 72.5% YoY ).
- Sales Volume Trends : Cumulative mobile sales for Q1 (April–June) reached 17,560 units , representing 77% of the previous year's volume (22,718 units). This directly reflects the strategic restraint resulting from the stricter reception protocols.
- Store Network Reorganization : As part of efficiency efforts, the company is consolidating Y!mobile (YM) shops into SoftBank (SB) shops to reduce fixed costs (mobile store count decreased from 75 to 63 YoY).
- Strengthening Corporate Mobile Business : The company is expanding solution proposals to support DX for SMEs , including business chat (LINE WORKS), cloud PBX, attendance management systems (KING OF TIME), and security tools, targeting corporate customers visiting the stores.
(2) Imaging Segment
- Performance Overview : Net sales of ¥911 million (up 4.2% YoY ), segment operating loss of ¥71 million (compared to a loss of ¥63 million). Despite the increase in sales, the loss widened due to a higher cost-of-sales ratio.
- Palette Plaza Business : While the one-time demand for "Nandemo Dubbing" (driven by the "Magnetic Tape Alert" regarding degradation risks) has normalized, the company is optimizing its profit structure by consolidating low-profit franchise (FC) stores (FC count decreased from 151 to 118 , while directly managed stores increased to 20).
- Souzou Business :
- Rolife (formerly Tsukurun-desu) : The DIY craft kit brand (miniature houses and 3D wood puzzles) saw steady sales, capturing inbound demand primarily through mass retailers. Despite focusing on IP collaborations (e.g., Sanrio Characters) and the value of the assembly experience, rising procurement costs from overseas pressured margins.
- One-Bo & Others : The company continues to cultivate new space-and-experience-based businesses, such as the "One-Bo" private work booths, brand promotion via "HATTO COFFEE" in Harajuku, and the operation of glamping facilities like "Ise-Shima BASE" in Mie Prefecture and "Alps BASE" in Nagano Prefecture.
4. Full-Year Forecast and Progress Evaluation: Second-Half Weighted Structure
Full-Year Forecast Overview
The company has announced the following consolidated earnings forecast for the fiscal year ending March 2027:
- Net Sales: ¥18,000 million (down 6.3% YoY )
- Operating Profit: ¥300 million (down 17.8% YoY )
- Ordinary Profit: ¥230 million (down 29.3% YoY )
- Net Profit: ¥180 million (down 12.7% YoY )
- Annual Dividend Forecast: ¥25 per share (planned reduction from the previous year's ¥50)
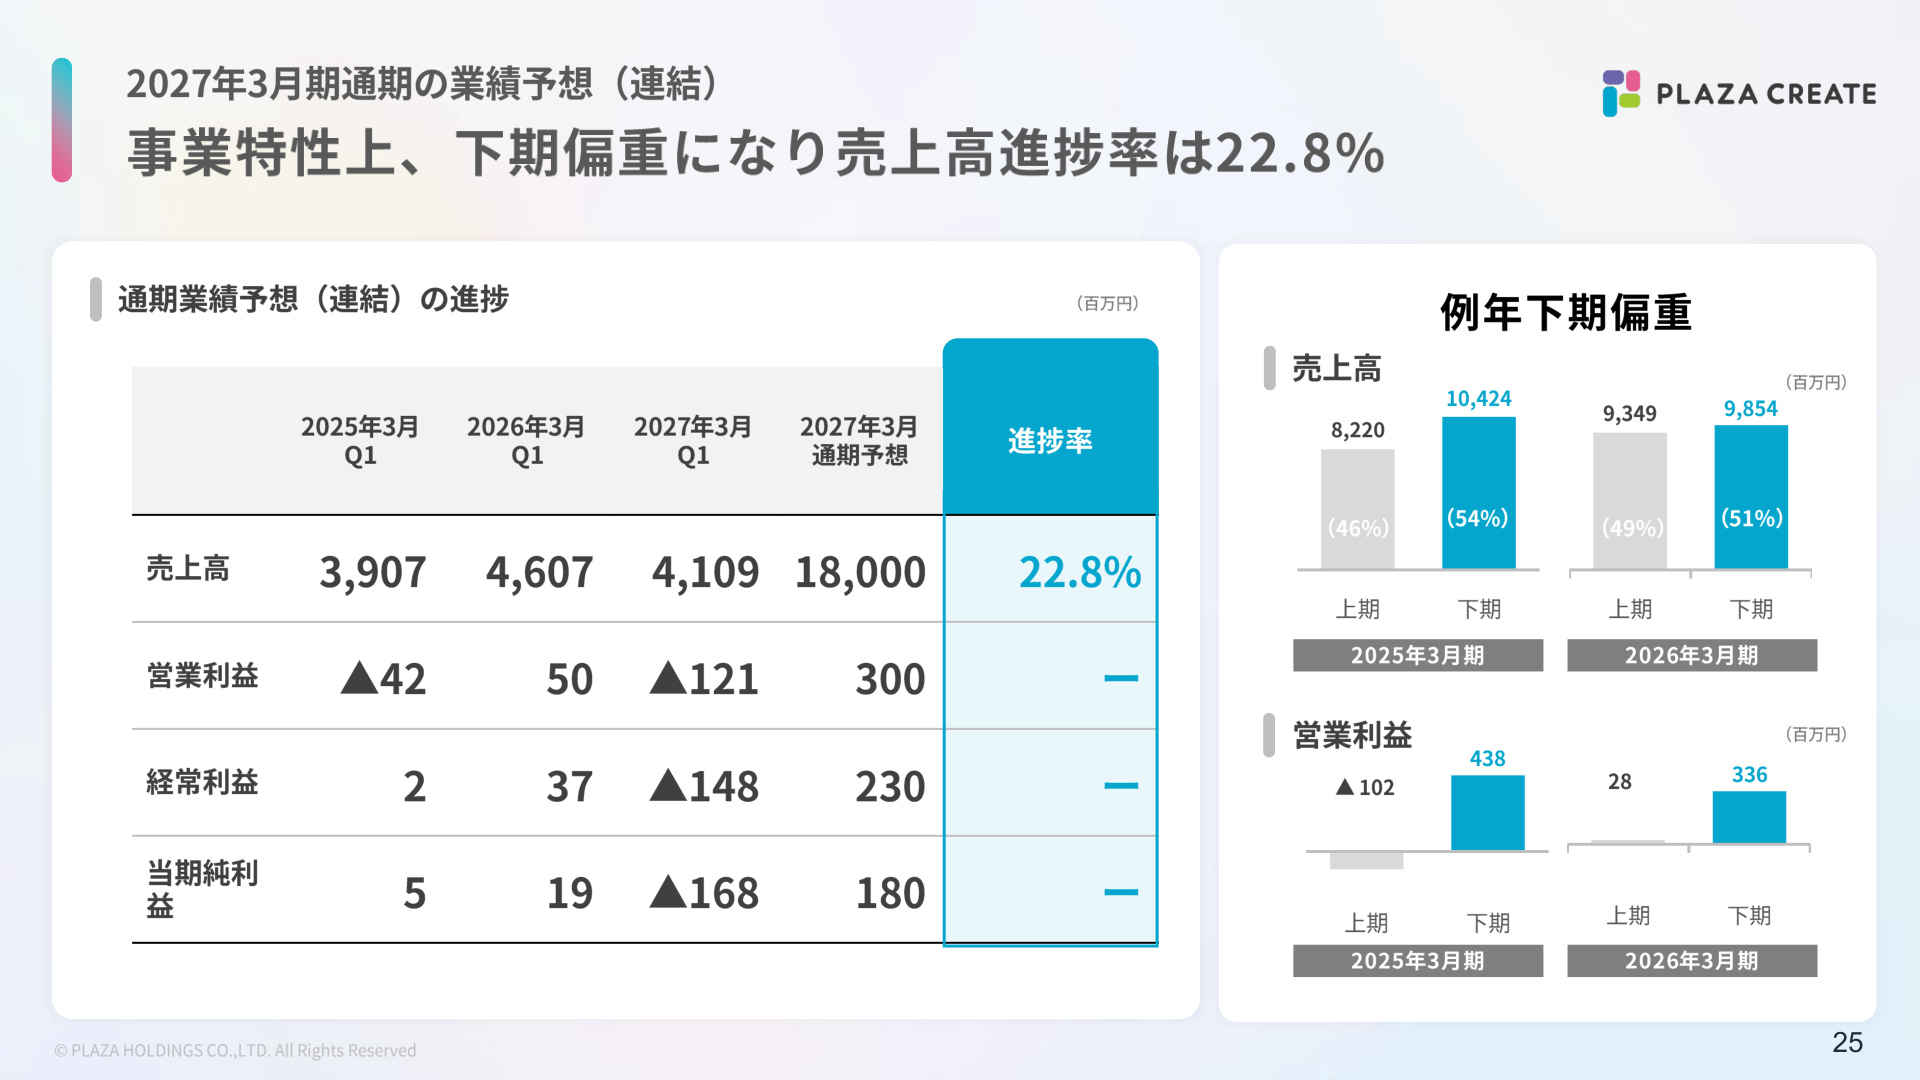
With an operating loss of ¥121 million in Q1, the achievement of the full-year target may seem questionable. However, the company's business model is characterized by a strong seasonal bias toward the second half of the year .
The following slide shows the progress against the full-year forecast and historical quarterly/half-year trends.
[Significance and Background of Slide 25]
This slide provides the most important supplementary data for evaluating the Q1 loss. As shown in the table, the Q1 sales progress rate against the full-year forecast (¥18,000 million) is 22.8% (¥4,109 million). While this may appear low, comparing historical performance shows that in FY2025, the first half accounted for 46% of sales and the second half for 54% (H1 operating loss of ¥102 million vs. H2 profit of ¥438 million). Similarly, in FY2026, the first half accounted for 49% of sales and the second half for 51% (H1 operating profit of ¥28 million vs. H2 profit of ¥336 million). The company has a structure where the majority of profits are concentrated in the second half (particularly the Q3–Q4 year-end and new-life shopping seasons) .
Therefore, the Q1 operating loss is within the scope of the company's annual plan. If the temporary shock from anti-hopping measures and contract volume declines subsides during the first half, the company has a roadmap to recover in the second half through the expansion of recurring revenue and contributions from high-margin projects .
5. Summary and Key Points to Watch
Plaza Holdings' Q1 FY2027 results show a decline in revenue and an operating loss on the surface. However, in reality, this represents a strategic transition period to adapt to changes in the mobile market, cutting off unhealthy contracts driven by short-term incentives to improve the "quality" of the customer base.
Key points for future investment decisions and corporate evaluation include:
- Results of the Qualitative Shift in the Mobile Business : The timing when the rigorous reception protocols normalize, leading to improved service efficiency per customer, lower churn rates, and increased recurring revenue.
- Progress of the Second-Half Weighted Scenario : Whether the mobile and imaging segments recover as planned during the profit-heavy second half, putting the company on track to achieve the ¥300 million operating profit target.
- Cost Management in New Areas like Rolife : Establishing a foothold for profitability in the imaging segment through price pass-throughs to offset rising procurement costs and achieving efficient sourcing.
Whether the company's efforts to rebuild a robust, stock-based revenue foundation will bear fruit after this short-term period of restraint is the key to its future growth.
This content is not intended as investment advice or a recommendation. Any opinions expressed are solely the personal views of each article.