


Square Enix Holdings Q1 FY2027 Earnings Analysis: Strong Growth Driven by Core Digital Entertainment Segment

StockClub
Published: Aug 10, 2026, 10:43 AM
Sentiment Analysis

1. Earnings Overview and Highlights
Square Enix Holdings Co., Ltd. reported its consolidated financial results for the first quarter of the fiscal year ending March 31, 2027 (April 1, 2026 – June 30, 2026) . Driven by robust growth in its core Digital Entertainment segment, the company achieved significant year-on-year increases in both sales and profits .
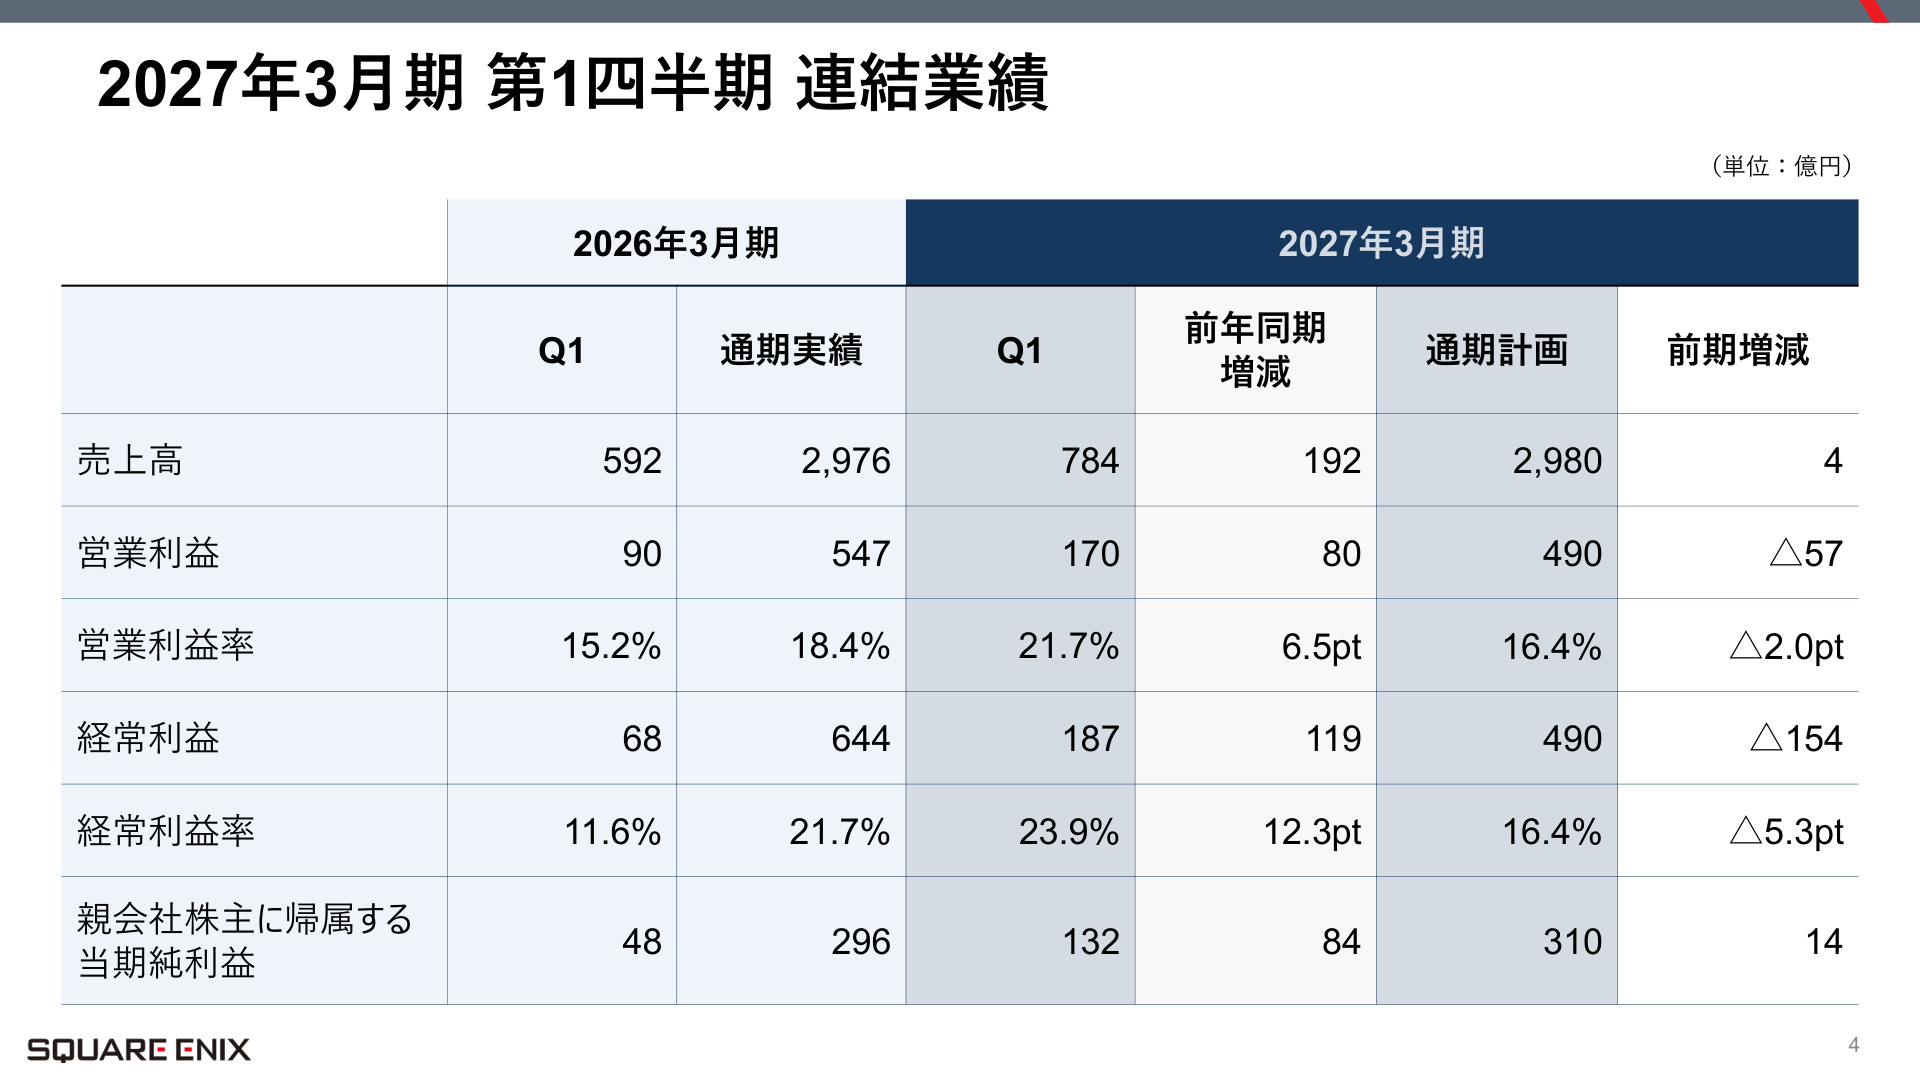
Net sales reached ¥78.4 billion (up 32.4% YoY) , operating income was ¥17.0 billion (up 88.9% YoY) , ordinary income stood at ¥18.7 billion (up 175.0% YoY) , and net income attributable to owners of the parent company was ¥13.2 billion (up 175.0% YoY) . All metrics significantly outperformed the same period last year, marking an exceptionally strong start to the fiscal year.
Why This Slide Is Important and Its Context
The slide above (Page 3) is the most critical data point for understanding these earnings, as it provides a concise overview of the quarterly performance and progress against the full-year plan. Compared to the same period last year (Q1 FY2026), net sales increased by ¥19.2 billion and operating income rose by ¥8.0 billion . Furthermore, the operating margin saw a significant expansion of 6.5 percentage points, rising from 15.2% to 21.7% . Regarding progress toward the full-year forecast, the company has already achieved approximately 34.7% of its full-year operating income target (¥49.0 billion) in the first quarter, indicating a highly favorable trajectory toward meeting its annual goals.
2. Comprehensive Analysis by Reporting Segment
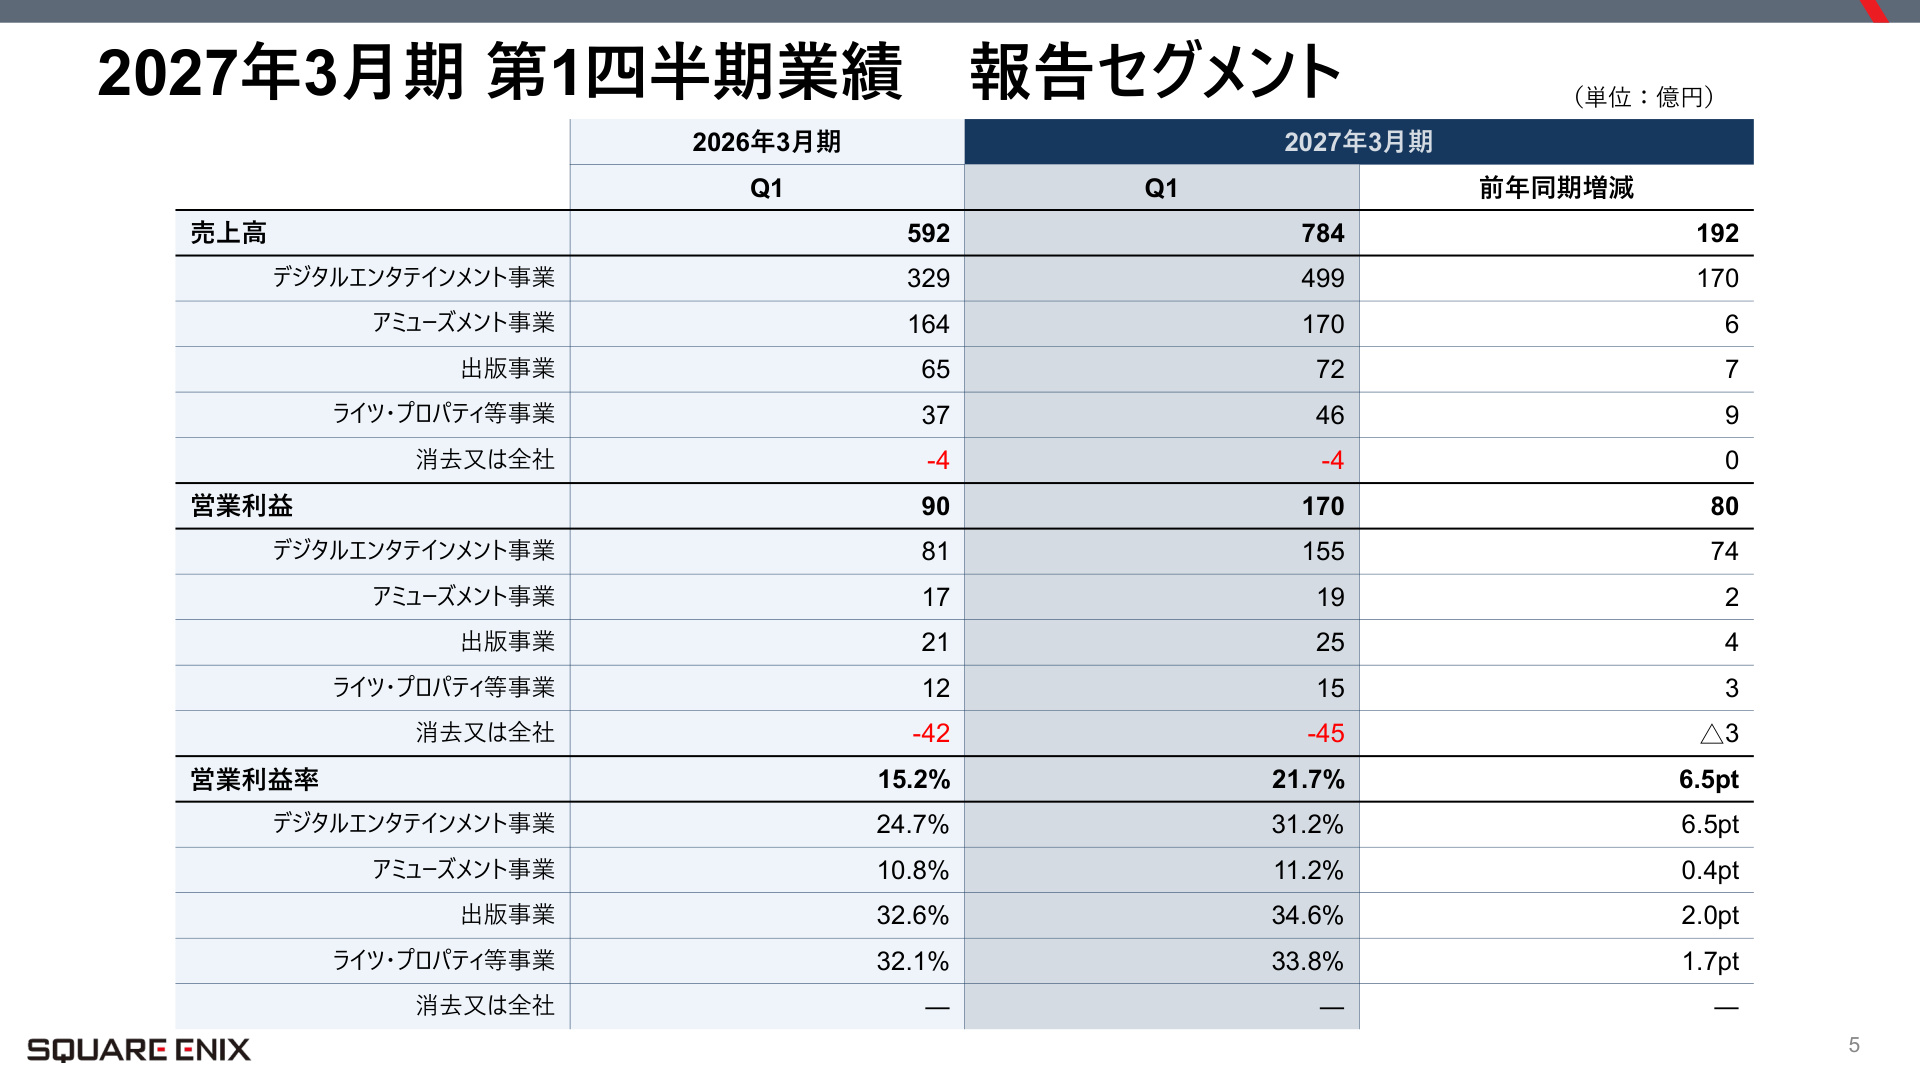
The expansion of company-wide performance was supported by year-on-year growth in both sales and profits across all segments. The Digital Entertainment segment , the company's largest business area, was the primary driver of this overall growth.
Why This Slide Is Important and Its Context
The segment breakdown (Page 4) provides a detailed look at how the company's diverse business portfolio contributes to earnings. The operating margin for the Digital Entertainment segment reached 31.2% (up 6.5 points YoY) , highlighting a notable improvement in profitability. Additionally, the Publishing segment’s operating margin of 34.6% and the Rights and Properties segment’s margin of 33.8% clearly demonstrate a structure where high-margin businesses leveraging content IP solidify the company's overall profit foundation.
Overview of each segment:
- Digital Entertainment : Net sales of ¥49.9 billion (up ¥17.0 billion YoY) , operating income of ¥15.5 billion (up ¥7.4 billion YoY) .
- Amusement : Net sales of ¥17.0 billion (up ¥0.6 billion YoY) , operating income of ¥1.9 billion (up ¥0.2 billion YoY) .
- Publishing : Net sales of ¥7.2 billion (up ¥0.7 billion YoY) , operating income of ¥2.5 billion (up ¥0.4 billion YoY) .
- Rights and Properties : Net sales of ¥4.6 billion (up ¥0.9 billion YoY) , operating income of ¥1.5 billion (up ¥0.3 billion YoY) .
3. Digital Entertainment Sub-segment Analysis
We break down the trends within the Digital Entertainment segment into three sub-segments: HD Games, MMO, and Smart Devices/PC Browsers.
(1) HD Games (Console / PC)
The HD Games division saw a dramatic recovery, with net sales of ¥17.7 billion (up ¥8.8 billion YoY) and operating income of ¥6.1 billion (up ¥5.1 billion YoY) . In addition to the release of new titles, the multi-platform expansion of existing catalog titles (such as the launch on Nintendo Switch™ 2) contributed to a significant increase in unit sales.
(2) MMO (Massively Multiplayer Online)
The MMO division recorded net sales of ¥12.7 billion (up ¥3.1 billion YoY) and operating income of ¥3.6 billion (up ¥0.03 billion YoY) . While user activity increased following the announcement of the latest expansion package for Final Fantasy XIV (8.0 "The Silver Wanderer"), profit growth remained modest due to the booking of upfront advertising and development costs for releases scheduled for early 2027.
(3) Smart Devices / PC Browsers
Net sales reached ¥19.4 billion (up ¥5.1 billion YoY) , with operating income of ¥5.7 billion (up ¥2.4 billion YoY) . The revenue contribution from new titles launched since the previous year, such as Emberstoria and Dragon Quest Smash Glow, stabilized, contributing to the growth in both sales and profits.
4. Global Expansion and Digital Shift Progress
The competitive edge of the company's Digital Entertainment business lies in its high digital sales ratio and penetration into global markets.
Why This Slide Is Important and Its Context
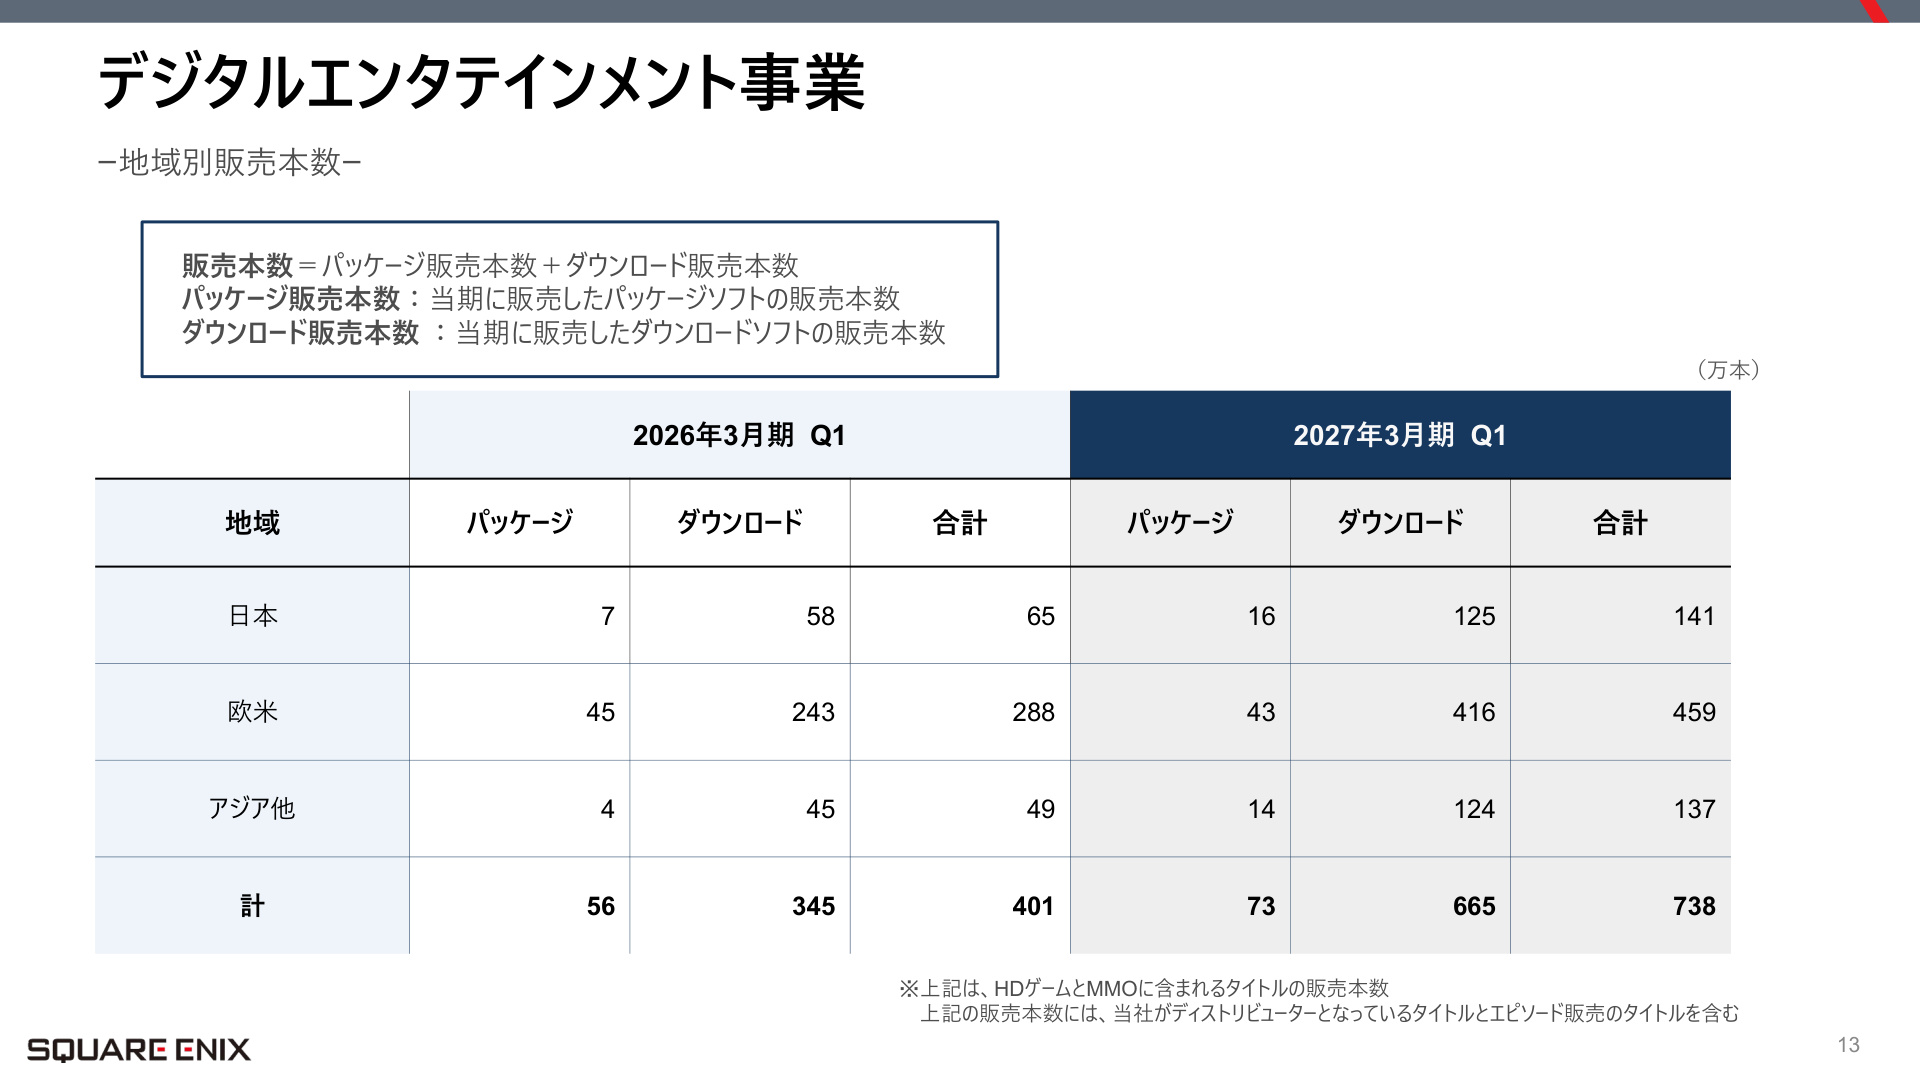
The regional unit sales data (Page 12) is a key indicator of the company's progress in its digitalization and globalization strategies. Total unit sales for the quarter rose significantly to 7.38 million units (up 84.0% YoY) . Of this total, 6.65 million units were digital downloads , accounting for approximately 90.1% of the total. By region, the North American and European markets accounted for 4.59 million units, or 62.2% of the total, confirming that a digital distribution structure—which minimizes physical inventory risk while maintaining high profit margins globally—has become firmly established.
5. Trends in Non-Game Segments (Publishing, Amusement, Rights)
Efforts to maximize IP value are also yielding steady results in non-gaming business segments.
- Publishing : Achieved growth in both sales and profits due to increased sales of comic volumes and the steady performance of the digital comic app "Manga UP!". Of the ¥7.2 billion in sales, digital revenue accounted for ¥4.2 billion (59% of the total) , continuing the trend of improved profit margins (34.6% operating margin) driven by the digital shift.
- Amusement : Provided a stable earnings base with net sales of ¥17.0 billion and operating income of ¥1.9 billion, supported by the steady maintenance of existing store sales and growth in sales of original merchandise for amusement facilities.
- Rights and Properties : Achieved net sales of ¥4.6 billion and operating income of ¥1.5 billion, driven by the sale of new character merchandise (figures, TCGs, etc.) utilizing in-house IP and successful cross-industry collaborations (e.g., the "Yoshinoya x Dragon Quest Walk" campaign).
6. Financial Position and Capital Efficiency
According to the consolidated balance sheet (Page 5), total assets stood at ¥430.7 billion (a decrease of ¥7.3 billion from the end of the previous fiscal year) . The company maintains a highly sound and robust financial foundation, holding ¥259.6 billion in cash and deposits and maintaining an equity ratio of 83.5% . Content production accounts stood at ¥50.3 billion (up ¥4.1 billion) , indicating that development investments to expand the pipeline are continuing.
7. Summary and Future Outlook
The Q1 FY2027 earnings results achieved record-high quarterly performance, driven by the recovery of all sub-segments in the Digital Entertainment business and the success of the digital shift and multi-platform strategy .
Looking ahead, the company’s trajectory toward its full-year targets (net sales of ¥298.0 billion, operating income of ¥49.0 billion) will be closely monitored, supported by the launch of major MMO expansion packages, IP deployment across diverse hardware, and continued media-mix initiatives in the publishing and rights sectors.
This content is not intended as investment advice or a recommendation. Any opinions expressed are solely the personal views of each article.