


Sony Financial Group FY26 Q1 Earnings Analysis: Simultaneous Profit Growth Across Life, Non-Life, and Banking Segments and Progress in Capital and Earnings Structure

StockClub
Published: Aug 10, 2026, 10:36 AM
Sentiment Analysis
Sony Financial Group FY26 Q1 Earnings Deep-Dive Report
Sony Financial Group Inc.'s FY26 Q1 (first quarter of fiscal year 2026) earnings demonstrated the group's robust and sustainable earnings growth, with all three core business segments—Life Insurance, Non-Life Insurance, and Banking—achieving year-on-year profit growth . This report provides an in-depth analysis based on 10 key topics extracted from the disclosure materials, covering earnings highlights, segment trends, financial soundness, full-year forecasts, and growth strategies.
1. Earnings Highlights and Full-Year Forecast Overview
Significant Growth in Group Adjusted Net Income
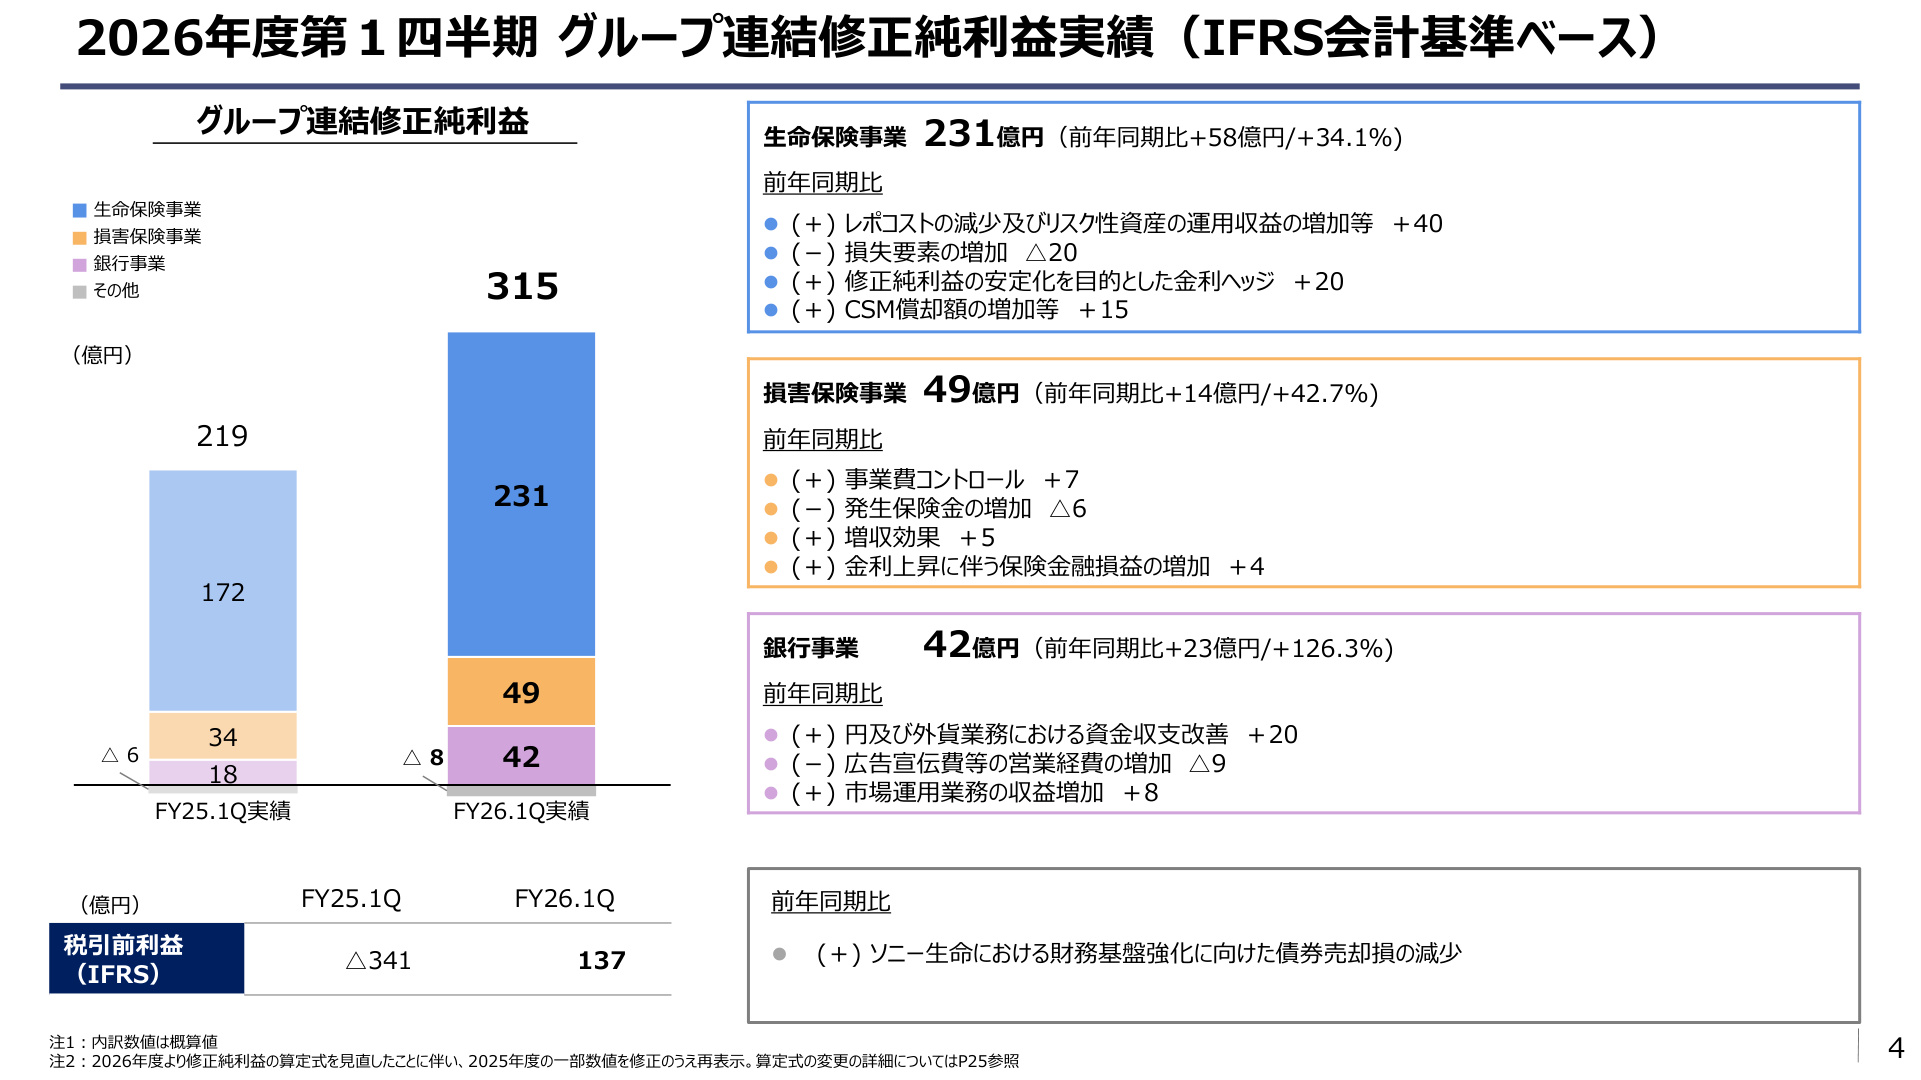
In the first quarter of FY26, Group adjusted net income reached 31.5 billion yen , marking a significant year-on-year increase of +43.6% from 21.9 billion yen in the same period last year. This metric, which reflects the underlying earning power by excluding financial market fluctuations and one-time factors, was driven by profit growth across all three core segments.
The slide below shows the performance of Group adjusted net income and its segment breakdown based on IFRS accounting standards.
[Slide Commentary: Importance of Group Adjusted Net Income Performance]
This slide is critical as it visualizes the underlying earnings trends of Sony Financial Group by segment .
- Life Insurance Business : Adjusted net income was 23.1 billion yen (+34.1% YoY) . This was supported by a decrease in repo costs (securities procurement costs), increased investment income from risk assets, and steady growth in CSM (Contractual Service Margin) amortization.
- Non-Life Insurance Business : Adjusted net income was 4.9 billion yen (+42.7% YoY) . Despite an increase in incurred insurance claims, the impact was offset by strict expense control and revenue growth.
- Banking Business : Adjusted net income doubled to 4.2 billion yen (+126.3% YoY) . This significant growth was driven by improved net interest income in both yen and foreign currency operations, as well as increased revenue from market operations. Additionally, IFRS profit before tax improved significantly to 13.7 billion yen (compared to a loss of 34.1 billion yen in the same period last year), with the reduction in bond sale losses driving a dramatic turnaround to profitability.
Revision of FY26 Full-Year Earnings Forecast
Compared to the initial plan (as of May), the Group consolidated ordinary income has been revised to 1.07 trillion yen (+20 billion yen increase), and profit before tax to 37 billion yen (+57 billion yen significant upward revision). This reflects the inclusion of gains from the transfer of equity-method investments related to SP.LINKS (formerly SPSV) in addition to a reduction in bond sale losses following a review of assets held for sale at Sony Life. Note that the forecast for Group adjusted net income (110 billion yen) , which represents underlying earning power, and the annual dividend per share forecast (8.0 yen) remain unchanged.
2. Business Trends and KPI Analysis of Core Segments
(1) Sony Life: Expansion of Policies in Force and Qualitative Evolution of Earnings Structure
As the group's largest earnings driver, Sony Life shows steady progress in both top-line growth and the accumulation of CSM, the source of future profits.
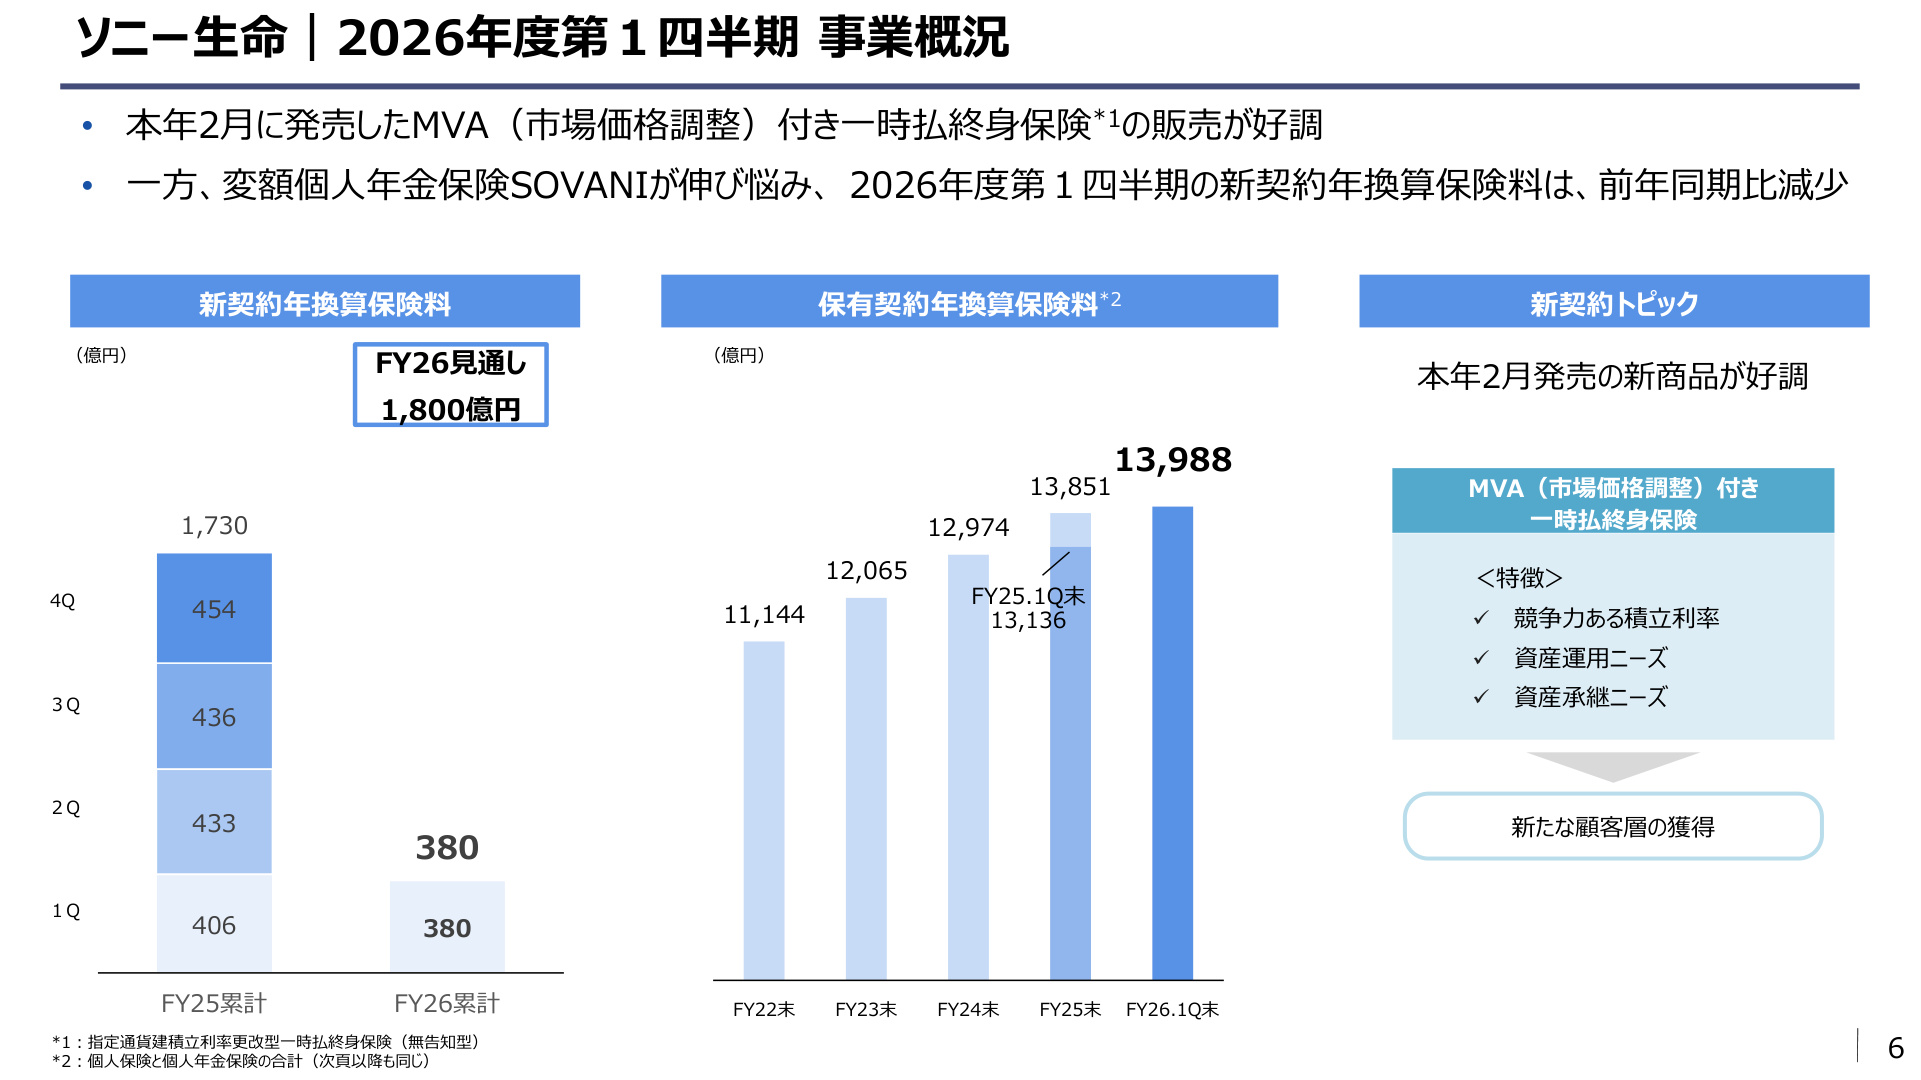
The slide below shows the business overview and key KPIs for Sony Life.
[Slide Commentary: Sony Life Business Overview and Expansion of Policies in Force]
This slide provides essential data to evaluate both the stock revenue base and flow growth of the life insurance business.
- New Policy Annualized Premiums (ANP) : Totaled 38 billion yen for the quarter (-6.5% YoY) . While the variable individual annuity insurance "SOVANI" underperformed, the single-premium whole life insurance with MVA (Market Value Adjustment) , launched in February 2025, performed exceptionally well by capturing needs for competitive accumulation rates and asset succession, thereby supporting new business.
- Annualized Premiums in Force : Reached 1.3988 trillion yen through steady accumulation, further expanding the foundation for stable future insurance premium income.
CSM (Contractual Service Margin) and Sales Channel Status
Under IFRS 17, the pre-tax CSM balance reached 2.0979 trillion yen (an increase from the end of FY25), steadily building up a stock of future profits. New business CSM generated during the quarter was 56.2 billion yen, with CSM amortization of 41.6 billion yen. In terms of product mix, the ratio of protection-type products (such as variable term insurance) , which have higher profit margins and faster CSM amortization speeds, rose to 39.2% , indicating qualitative improvement in earnings.
The sales force, Lifeplanners (LPs), grew steadily to 6,067 (+36 from the end of the previous year), with the expansion plan toward the FY30 target of 7,000 progressing well. The surrender and lapse rate remained at 1.4% (5.5% annualized); while a slight increase was observed in some foreign currency-denominated insurance due to the recent yen depreciation, the overall level remains controlled.
(2) Sony Assurance: Improved Combined Ratio through Expense Ratio Optimization
At Sony Assurance, net premiums written grew steadily to 56.1 billion yen (YoY increase), led by automobile insurance. Although the loss ratio (E.I. loss ratio of 63.8%) rose slightly YoY due to higher insurance claim unit costs, this was offset by an improvement in the net expense ratio (21.7%) through digitalization and operational efficiency. As a result, the combined ratio, which indicates the profitability of the insurance business, improved to 85.5% (84.8% excluding natural disasters), maintaining very high profitability.
(3) Sony Bank: Flexible Adaptation to Interest Rate Environment and Spread Security
At Sony Bank, yen deposit balances were 3.9898 trillion yen and foreign currency deposit balances were 761.7 billion yen, with total deposit balances remaining largely flat (approx. 4.75 trillion yen) . While profit-taking sales of foreign currency deposits (transfers to yen deposits) were observed amid the yen's depreciation, funds remained within the bank. Regarding the interest rate environment, following the Bank of Japan's policy rate hikes, the bank revised mortgage and deposit rates, securing high interest margins with a yen loan-to-deposit spread of 0.84% and a foreign currency loan-to-deposit spread of 1.5% .
3. Financial Soundness and Capital Management (ESR Trends)
From the perspective of risk management and capital efficiency, the movement of the Group consolidated ESR (Economic Solvency Ratio) is critical.
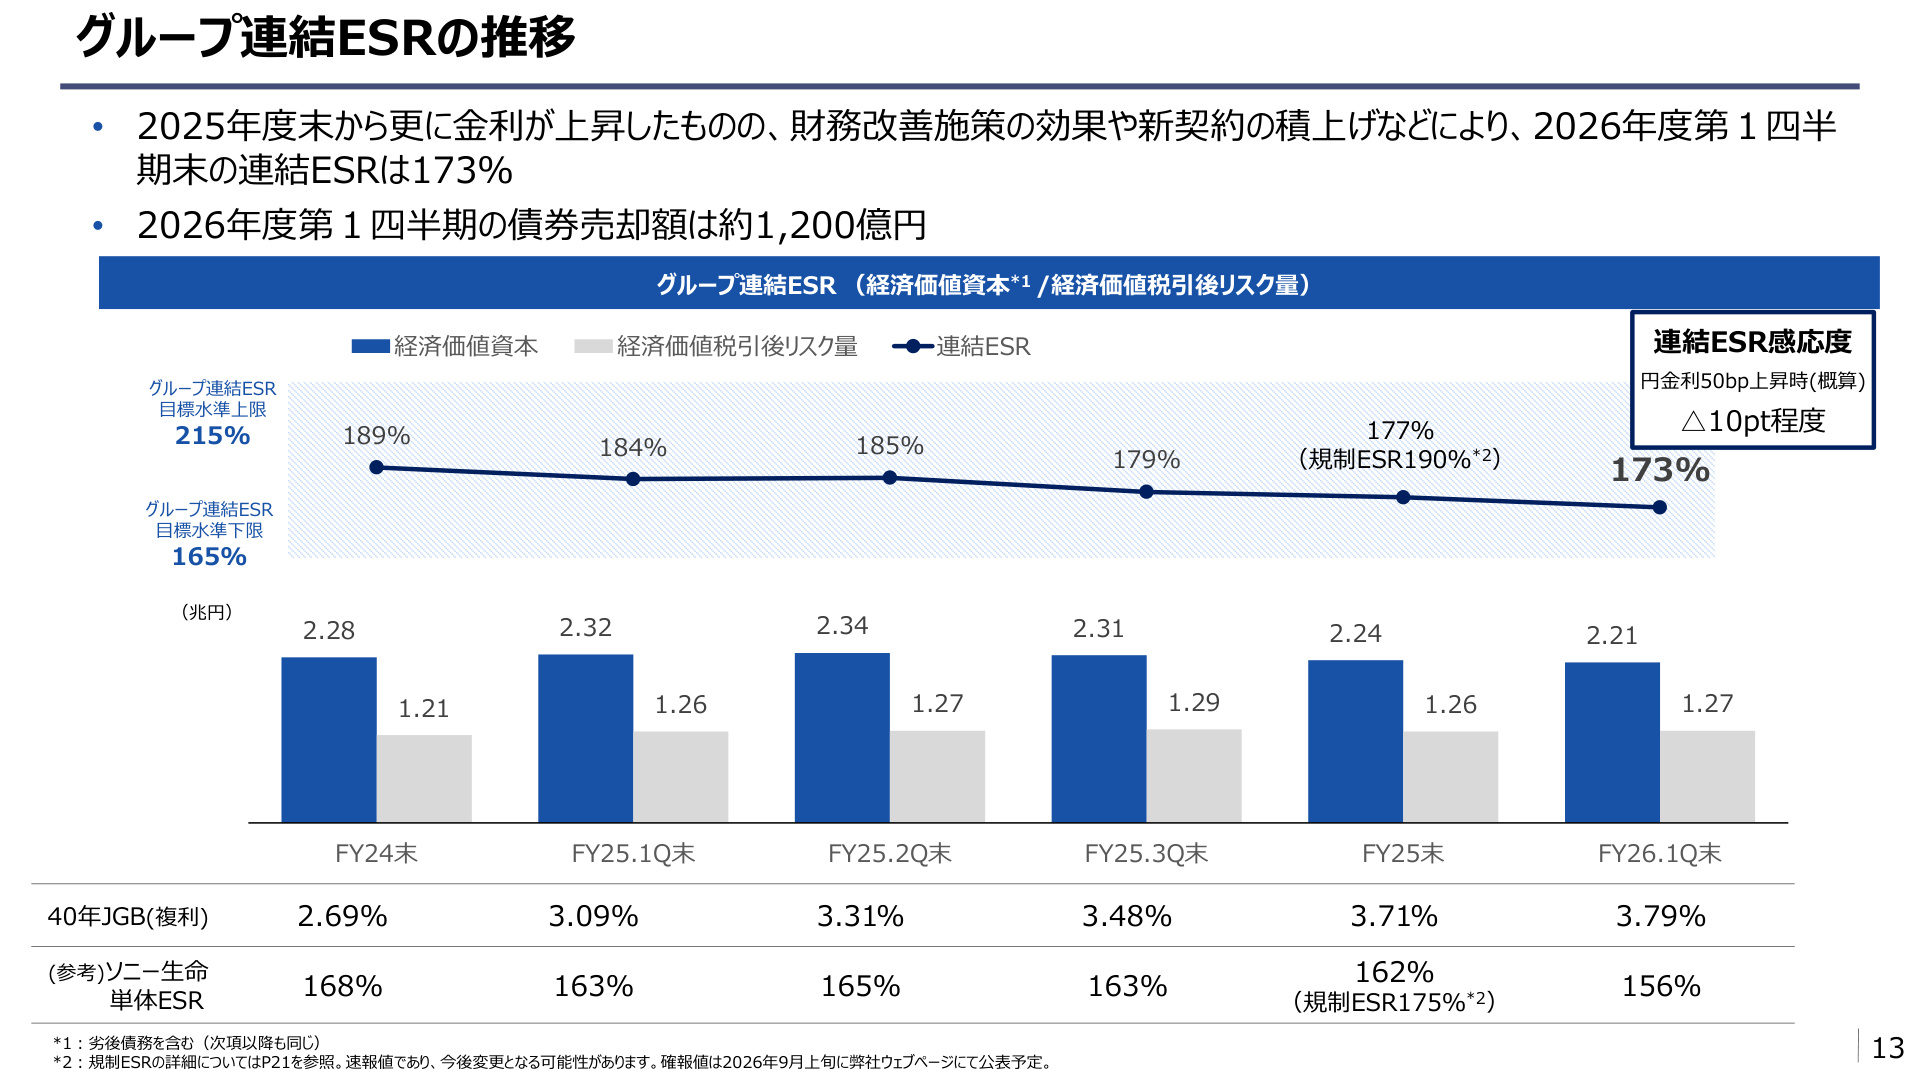
The slide below shows the trend of the Group consolidated ESR.
[Slide Commentary: Group Consolidated ESR Trends and Soundness Evaluation]
This slide objectively demonstrates the group's resilience to interest rate shocks and the trend of financial soundness .
- Consolidated ESR Level : The consolidated ESR at the end of FY26 Q1 was 173% . Although it decreased by 4 points from the end of the previous fiscal year (177%), it remains stable within the target range (165%–215%) .
- Background of Trends : While a capital reduction factor (-7pt) occurred due to rising domestic interest rates (40-year JGB yield rose from 3.71% to 3.79%), the decline was minimized by capital improvement measures such as the use of derivatives and securities sales (+3pt, with bond sales of approx. 120 billion yen during the quarter) and the acquisition of new contracts (+1pt).
- Sensitivity : Sensitivity to a 50bp rise in yen interest rates is estimated at approximately -10pt, indicating that interest rate fluctuation risk is appropriately controlled through thorough ALM (Asset Liability Management).
4. Optimization of Management Indicators and Shareholder Return Policy
Revision of Adjusted Net Income Definition (From FY26 onwards)
Starting in FY26, the company partially revised the definition of "Adjusted Net Income," a key management indicator. In addition to the conventional adjustments for one-time gains and losses, "valuation gains/losses on hedges related to ALM (excluding hedge cost equivalents)" were added as an adjustment item . This eliminates temporary profit fluctuations caused by accounting mismatches, allowing the group to present its essential recurring earning power more accurately and transparently.
Shareholder Return Policy
Regarding shareholder returns, the basic policy of "prioritizing dividends" and "in principle, not reducing the annual dividend per share, aiming for stable dividend growth" is maintained.
- Dividend Metric : Target a dividend payout ratio of 40%–50% based on IFRS adjusted net income.
- Dividend Forecast : The FY26 dividend forecast is 8.0 yen per share annually (4.0 yen interim, 4.0 yen year-end) , continuing the trend of dividend increases from the previous year.
5. Conclusion and Future Focus Points
Through the FY26 Q1 earnings, Sony Financial Group demonstrated the visualization of earnings and stable generation capacity under IFRS accounting standards . Each segment continues to grow by leveraging its strengths: the expansion of protection-type products and CSM accumulation in Life Insurance, excellent cost control in Non-Life Insurance, and improved net interest income in the rising interest rate environment for Banking.
Key points to watch in the future include:
- Penetration of New Products : Whether new products, such as single-premium whole life insurance with MVA, can cover the sluggishness in variable individual annuities and maintain top-line growth.
- Response to Interest Rate Fluctuations : Balancing the maintenance of capital soundness (ESR) through ALM operations and the control of bond sale losses amid rising domestic interest rates.
- Strengthening Sales Channels : Maintaining the net growth trend of Lifeplanners and improving productivity.
The fundamentals of each business are extremely strong, and the earnings results suggest continued corporate value enhancement under a clear capital policy.
This content is not intended as investment advice or a recommendation. Any opinions expressed are solely the personal views of each article.