

Sanrio (8136) Q1 FY2027 Earnings Deep Dive: Record-Breaking Q1 Performance and Accelerated Global Expansion

StockClub
Published: Aug 10, 2026, 10:35 AM
Sentiment Analysis

Sanrio (8136) Q1 FY2027 Earnings Deep Dive Report
Sanrio Co., Ltd. (Ticker: 8136) reported its financial results for the first quarter (Q1) of the fiscal year ending March 31, 2027, achieving record-high Q1 results in both net sales and operating profit, marking its sixth consecutive quarter of year-on-year growth in both revenue and profit . Performance was driven by the rising popularity of proprietary IP in the domestic market, robust foot traffic at retail stores and theme parks, and rapid expansion in overseas markets, particularly in Europe. This report provides a detailed analysis of the company's performance structure, regional trends, and mid-to-long-term growth roadmap based on the disclosed financial materials.
1. Earnings Highlights: Record Performance and Long-Term Growth Trend
For the first quarter of FY2027, consolidated net sales reached ¥52.035 billion (+20.7% YoY) , operating profit was ¥22.435 billion (+11.1% YoY) , adjusted operating profit stood at ¥22.077 billion (+21.8% YoY) , and net profit attributable to owners of the parent was ¥15.516 billion (+9.3% YoY) .
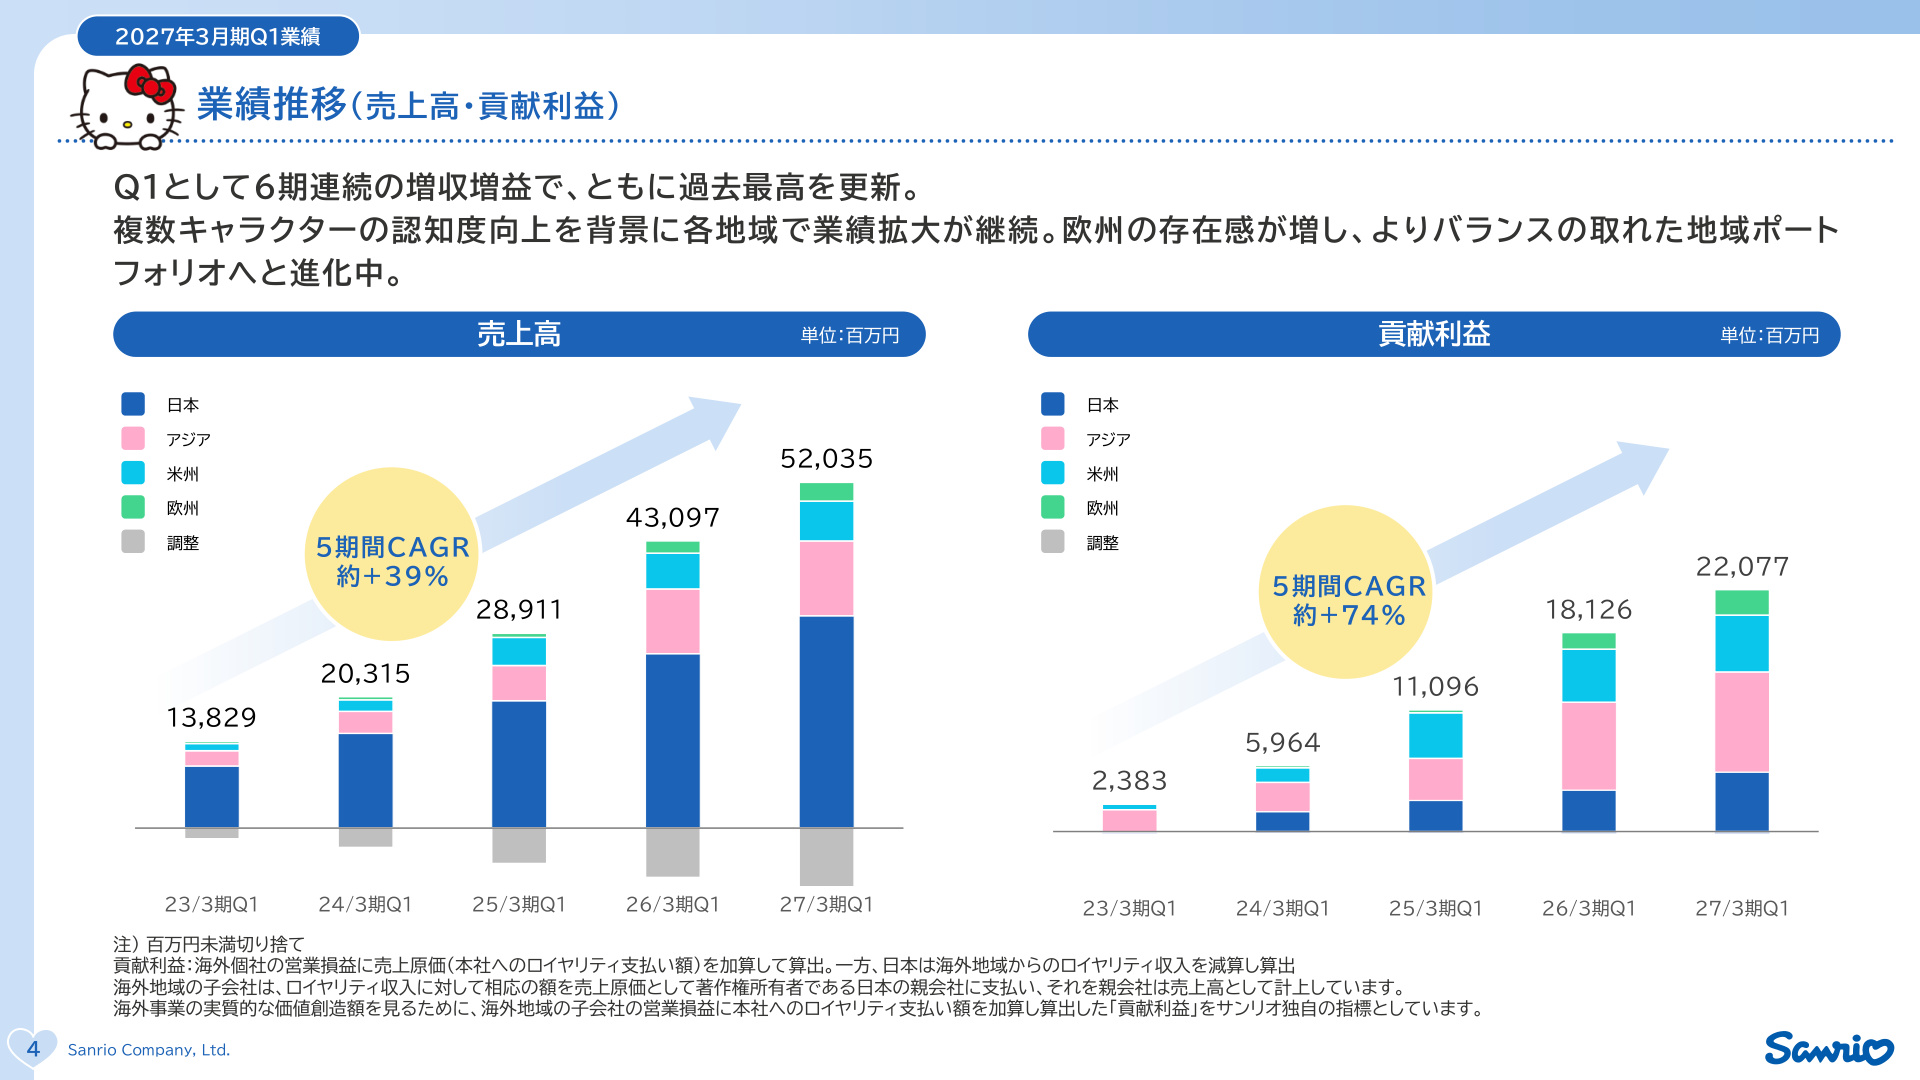
Slide Analysis: The Importance of Performance Trends (Net Sales & Contribution Profit)
This slide clearly illustrates the structural growth Sanrio has achieved over the past five years. The company has demonstrated remarkable expansion, with a 5-year Compound Annual Growth Rate (CAGR) of approximately +39% in net sales and approximately +74% in contribution profit , the company's proprietary earnings metric. By moving away from a structure dependent on specific regions or single characters, Sanrio has evolved into a more sustainable and balanced regional portfolio through "increased recognition of multiple characters" and "development of new markets, starting with Europe."
2. Segment Trends: Growth Across All Regions with a Surge in Europe
Looking at regional performance, all segments achieved year-on-year growth in both sales and profit, underscoring the broadening of the global fan base.
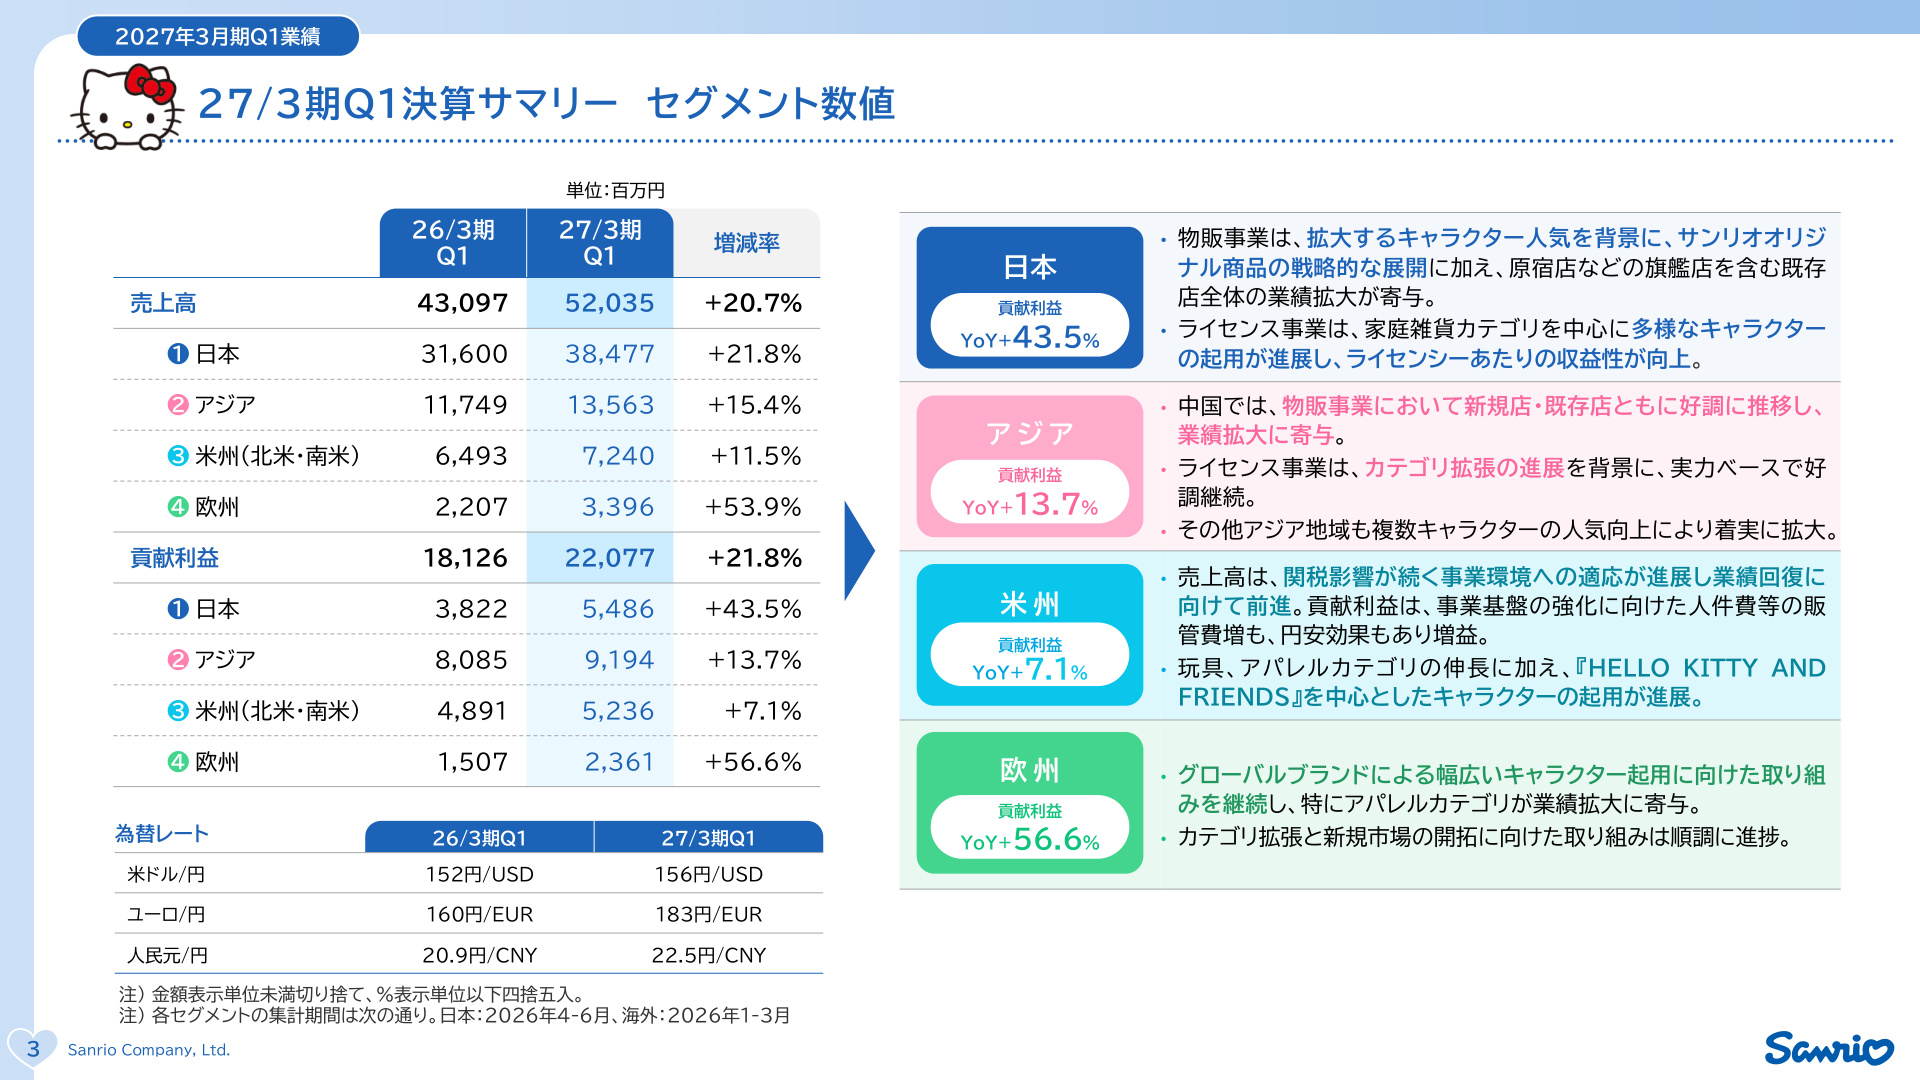
Slide Analysis: Structural Points of Segment Figures
The slide above shows the growth rates for net sales and contribution profit (a metric calculated by adding royalties paid to headquarters to the operating profit/loss of overseas subsidiaries) for each region. Key highlights include:
- Japan (Domestic) : Net sales of ¥38.477 billion (+21.8% YoY) and contribution profit of ¥5.486 billion (+43.5% YoY) . Growth was supported by flagship store expansion in the retail business, original product planning, and the multi-faceted use of characters in the licensing business.
- Asia : Net sales of ¥13.563 billion (+15.4% YoY) and contribution profit of ¥9.194 billion (+13.7% YoY) . Performance was bolstered by the expansion of the retail store network and the broadening of licensing categories in China.
- North & South America : Net sales of ¥7.240 billion (+11.5% YoY) and contribution profit of ¥5.236 billion (+7.1% YoY) . Despite a business environment still affected by tariffs, performance is on a recovery track as licensees adapt to the situation.
- Europe : Net sales of ¥3.396 billion (+53.9% YoY) and contribution profit of ¥2.361 billion (+56.6% YoY) . The segment showed remarkable growth driven by the expansion of core apparel licensing and new market development.
3. Business Details: Domestic and Key Overseas Markets
① Japan Market: Expanding Demand and Enhanced Experiential Value
In the retail business, the expansion of demand for popular characters, including the 30th-anniversary campaign for Pompompurin, and the opening of flagship stores like the Harajuku location, proved successful. While the inbound sales ratio was affected by fluctuations in traveler numbers, store foot traffic increased by 17% YoY due to a rise in domestic customers. In the theme park business (Sanrio Puroland and Harmonyland), the total number of visitors reached 514,000 (+7% YoY) , driven by anniversary events and increased in-park spending.
② China Market: Dramatic Expansion of Retail Business
In China, the retail network expanded to 62 stores (6 directly operated, 56 franchised) . Consequently, net sales in the retail business surged by 125% YoY . In the licensing business, the company continues to cultivate multiple characters beyond Hello Kitty and expand into categories such as toys, home goods, and food.
③ Europe & New Markets: Progress in India and Beyond
In the European segment, adoption by major global apparel brands is creating a ripple effect. Furthermore, as part of new market development, Sanrio has launched brand corners in 40 "AZORTE" apparel stores operated by the Reliance Group, one of India's largest retailers, signaling further expansion into South Asia.
4. Cost Structure and Financial Foundation
SG&A Expenses and Timing Differences
Consolidated SG&A expenses were ¥18.248 billion (compared to ¥14.567 billion in the same period last year) , with the SG&A-to-sales ratio rising to 35.1% (from 33.8% in the previous year). This is attributed to increased personnel costs and strategic global marketing investments. Notably, because approximately ¥2 billion of the planned SG&A budget for Q1 was deferred to Q2 and beyond, Q1 operating profit came in slightly higher than planned.
Robust Financial Position
On the consolidated balance sheet, cash and deposits increased to ¥136.066 billion (an increase of ¥10.632 billion from the end of the previous fiscal year) , with net cash standing at ¥123.520 billion . The equity ratio remains at 65.9% , maintaining an extremely sound financial foundation with ample capacity for growth investment.
5. Full-Year Outlook and 5-Year Growth Roadmap
Full-Year Earnings Forecast (Unchanged)
The full-year consolidated earnings forecast for the fiscal year ending March 31, 2027, remains unchanged from the initial plan:
- Net Sales : ¥229.8 billion (+18.4% YoY)
- Operating Profit : ¥89.5 billion (+15.0% YoY)
- Net Profit Attributable to Owners of the Parent : ¥63.8 billion (+16.8% YoY)
Excluding the deferral of SG&A expenses (approx. ¥2 billion), progress is largely in line with the plan, and the favorable business environment continues.
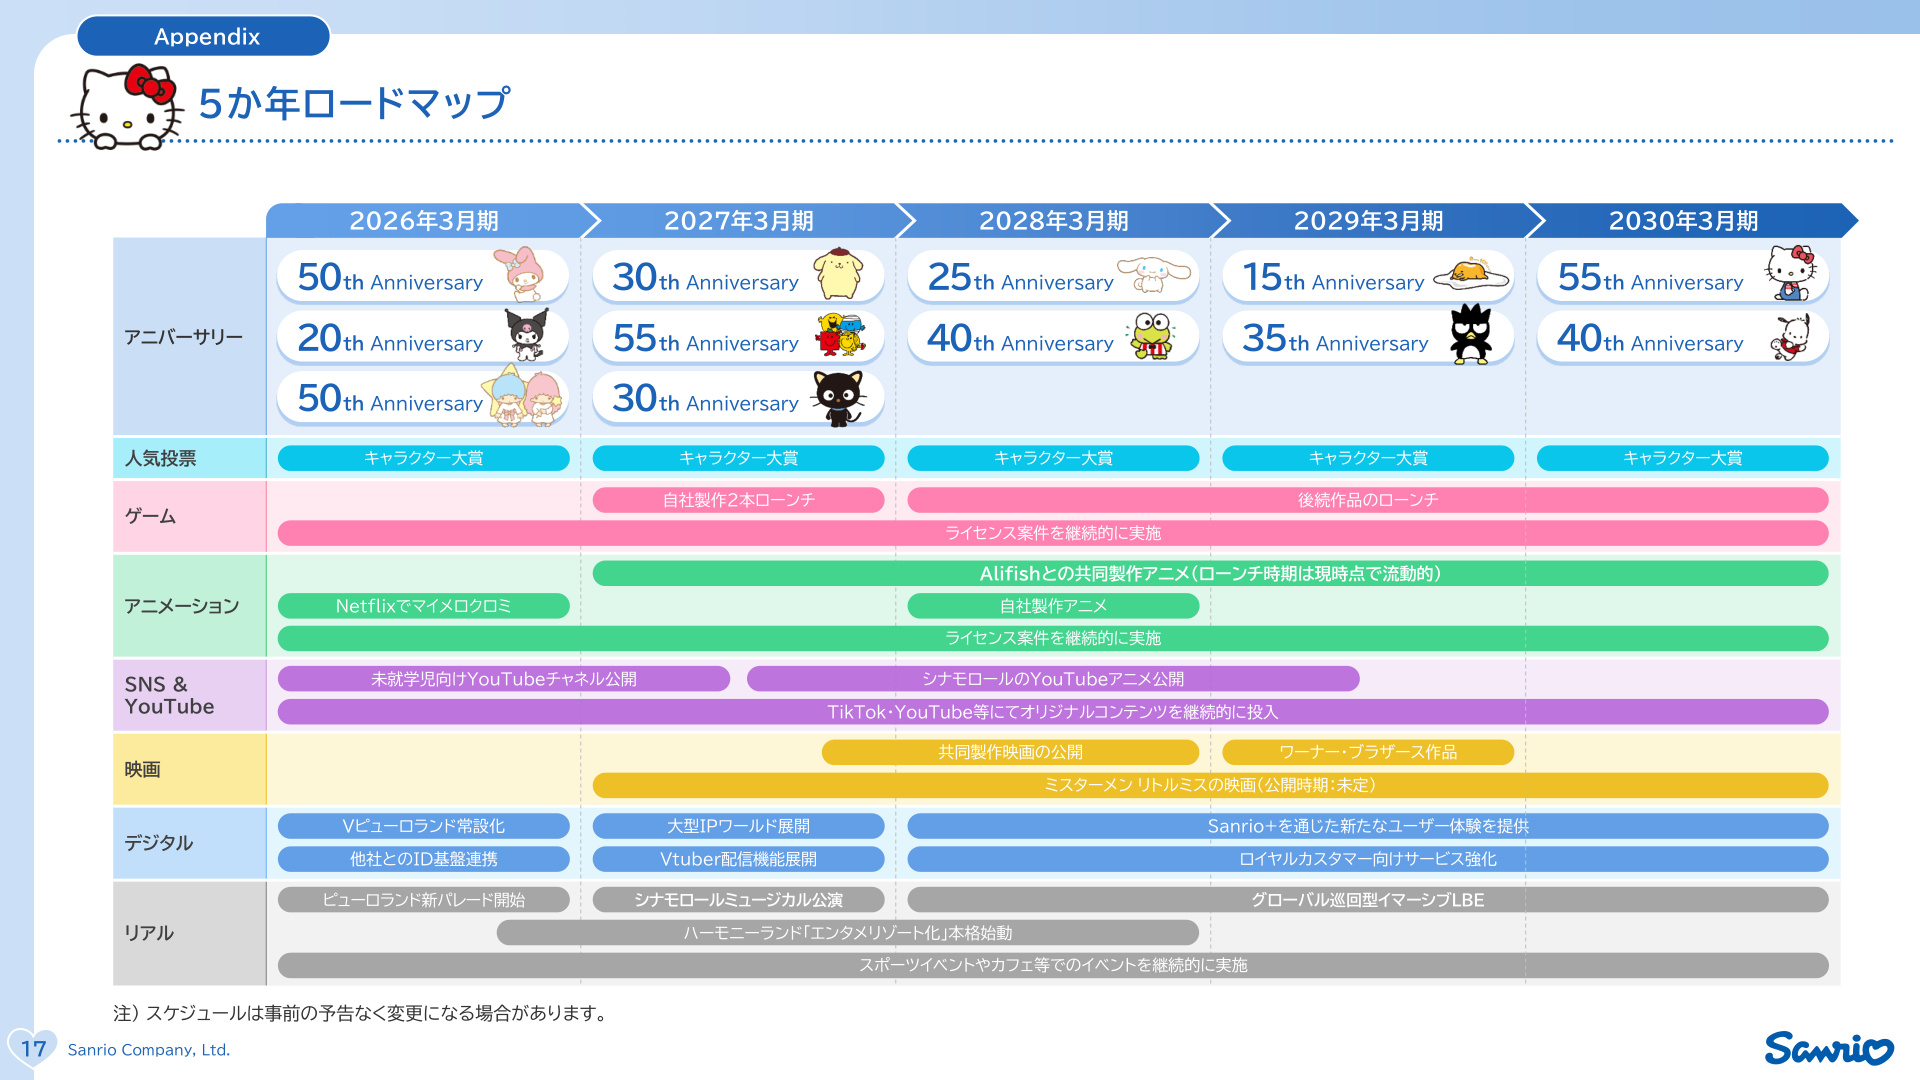
Slide Analysis: The Importance of the 5-Year Roadmap (FY2026–FY2030)
This slide systematizes the company's multi-faceted IP strategy and media-mix plan to ensure sustained mid-to-long-term growth. The roadmap goes beyond simple merchandise sales, incorporating the following multi-layered initiatives:
- Anniversary Initiatives : Continuous marketing campaigns capturing milestones for major IP, such as the 30th anniversary of Pompompurin, 25th of Cinnamoroll, 20th of Kuromi, and 55th of Hello Kitty.
- Digital, Gaming, and Anime : Launching proprietary games, co-producing anime with Alifish, developing content for Netflix, and releasing original content on YouTube/TikTok.
- Film and Immersive Experiences : Developing co-produced films and Warner Bros. projects, and launching global touring immersive Location-Based Entertainment (LBE).
These initiatives, which fuse digital and physical realms, clearly outline a strategy to expand customer touchpoints globally and maximize IP value.
Conclusion
Sanrio's Q1 FY2027 results achieved record-high performance, driven by strong domestic foot traffic, synergies between retail and licensing, and the diversification of global markets, particularly in Europe and China. While short-term profit was bolstered by the deferral of SG&A expenses, the company has demonstrated a clear commitment to sustained IP value enhancement and market expansion, supported by a robust financial foundation and a well-defined 5-year roadmap.
This content is not intended as investment advice or a recommendation. Any opinions expressed are solely the personal views of each article.