


Miahelsa Holdings: Q1 FY2027 Earnings In-Depth Analysis Report

StockClub
Published: Aug 10, 2026, 10:31 AM
Sentiment Analysis
Miahelsa Holdings Inc.'s financial results for the first quarter of the fiscal year ending March 31, 2027 (April 1, 2026, to June 30, 2026), showed increased revenue but decreased profit compared to the same period last year. This was primarily due to the impact of revisions to dispensing fees and rising fixed costs, such as personnel expenses. However, each profit metric significantly outperformed the company's initial internal forecasts , marking a solid start to the fiscal year.
This report extracts and covers 10 key topics from the supplementary earnings materials, providing a detailed analysis of the company's performance structure, segment-specific conditions, and future growth strategies.
1. Q1 FY2027 Consolidated Financial Highlights
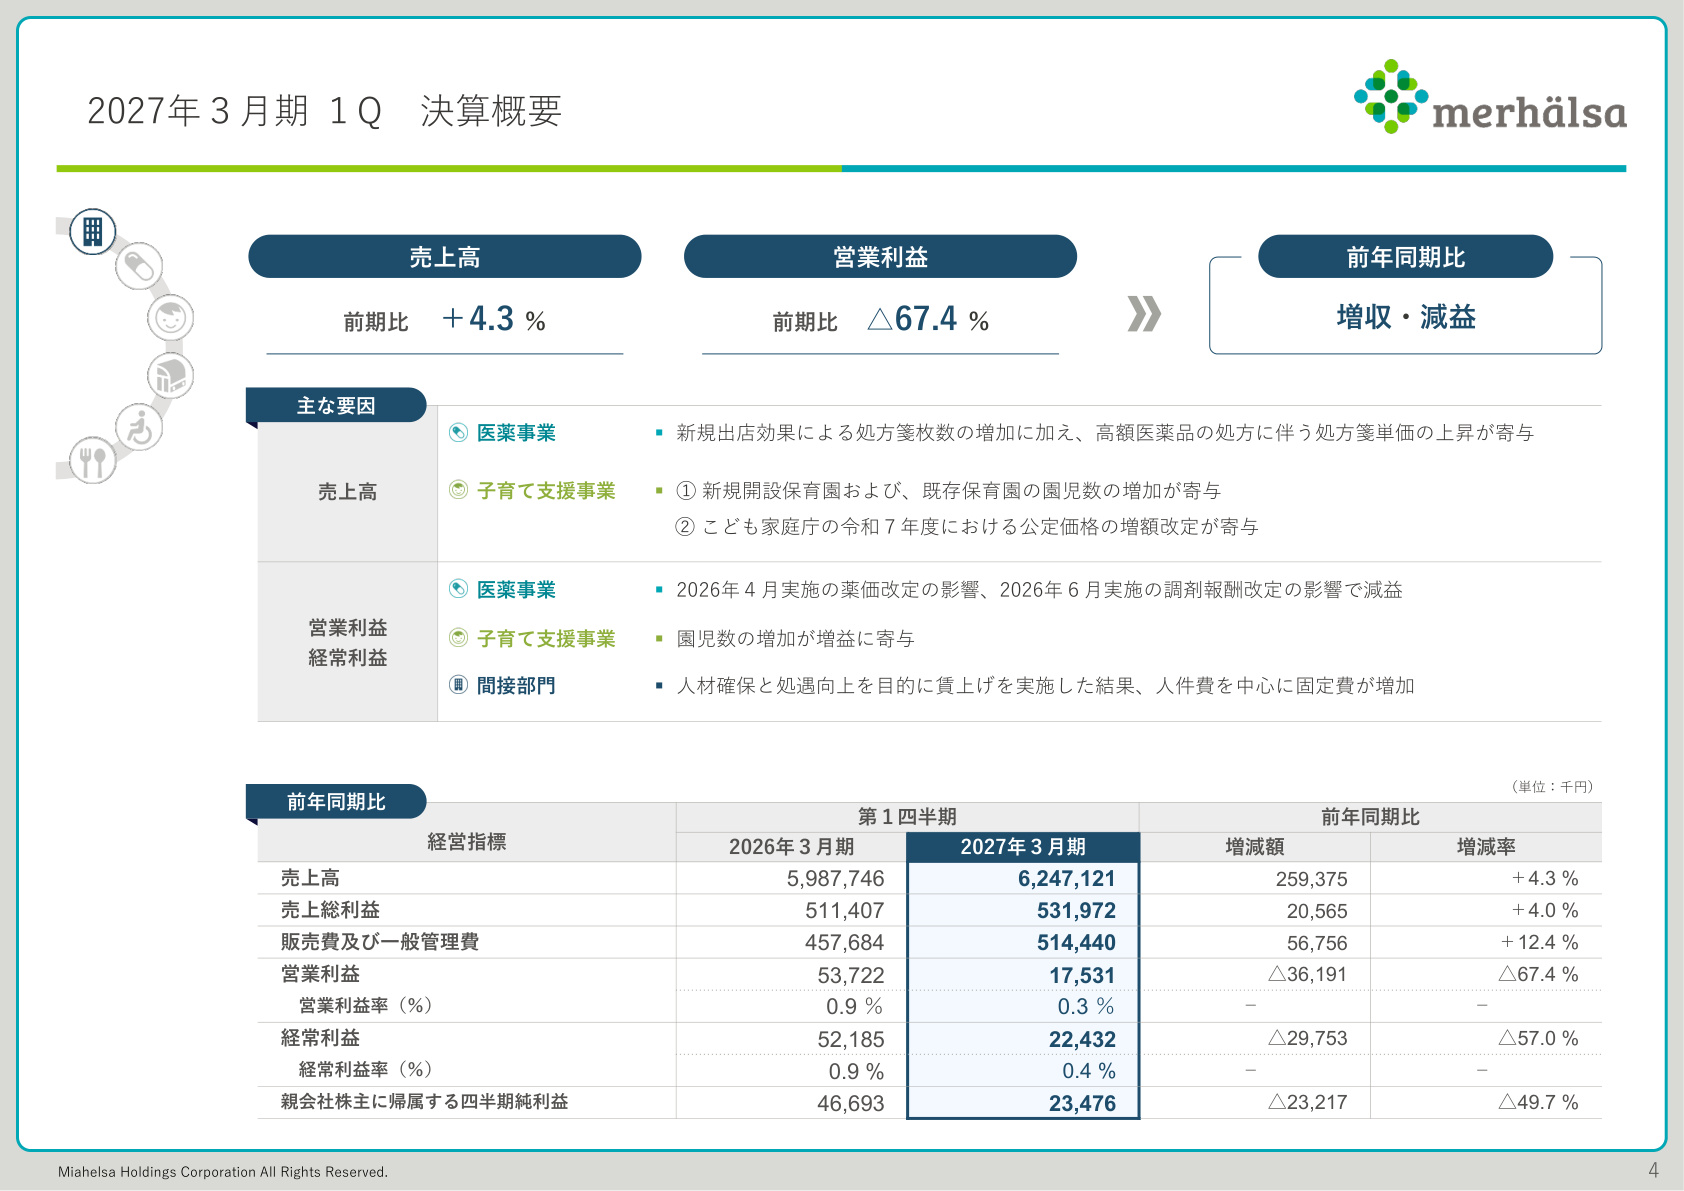
Consolidated results for the first quarter were as follows: Net Sales of 6,247 million yen (+4.3% YoY) , Operating Profit of 17 million yen (-67.4% YoY) , Ordinary Profit of 22 million yen (-57.0% YoY) , and Quarterly Net Profit attributable to owners of the parent of 23 million yen (-49.7% YoY) .
Slide Commentary (P4: Q1 FY2027 Earnings Overview)
The slide above summarizes the overall consolidated performance and the factors behind the year-on-year profit fluctuations. Net sales increased by 259 million yen (+4.3%) compared to the same period last year, driven by growth in the Pharmaceutical and Childcare Support segments. Conversely, operating profit declined by 36 million yen (-67.4%) , falling from 53 million yen in the previous year to 17 million yen.
This decline is attributed to the downward pressure on profitability caused by the April 2026 drug price revision and the June 2026 dispensing fee revision in the Pharmaceutical segment , as well as increased fixed costs from wage hikes implemented to secure and retain talent. The revenue growth and profit gains in the Childcare Support segment were insufficient to offset these cost increases, resulting in a year-on-year profit decline.
2. Comparison Against Public Forecasts: Significant Outperformance of Initial Plans
Although profit declined year-on-year, the critical point for investors is the "achievement status against initial earnings forecasts." The company significantly exceeded its internal Q1 forecasts across all profit items.
Slide Commentary (P13: Comparison Against Earnings Forecasts)
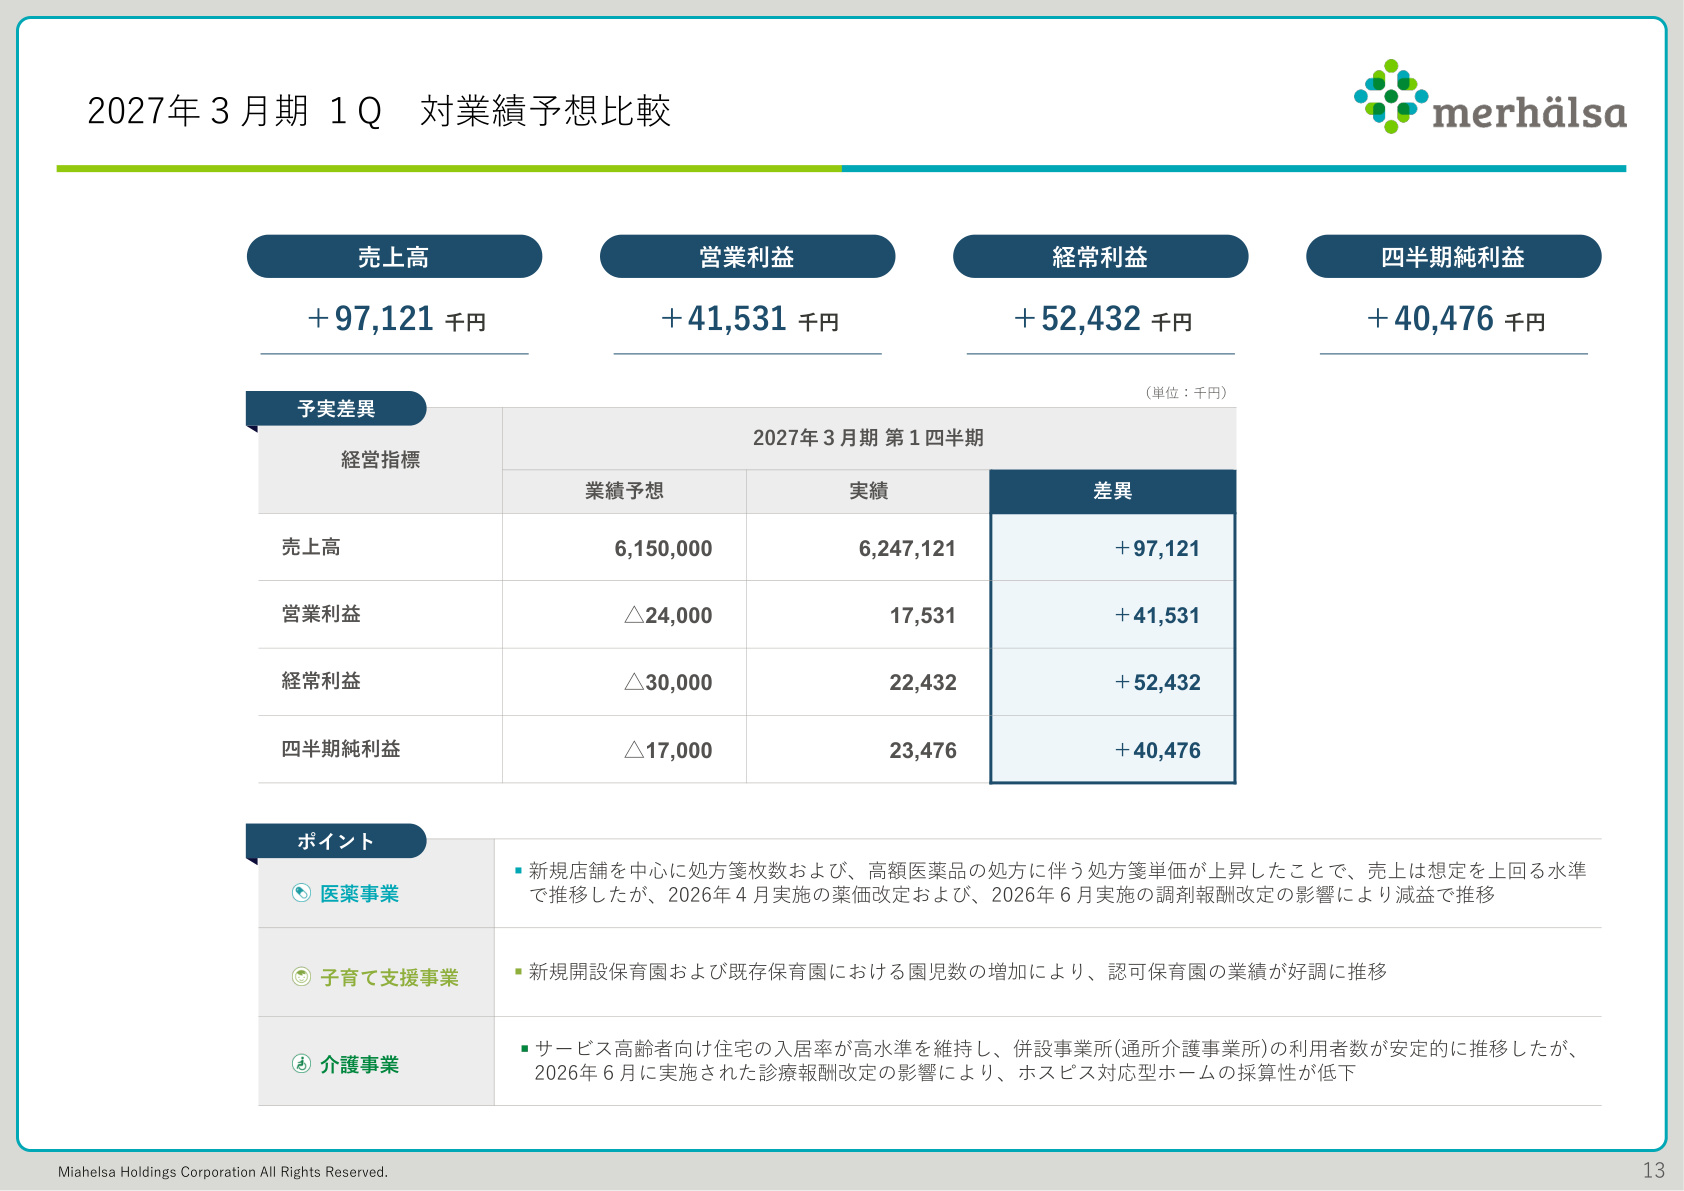
This slide provides vital data on the variance between Q1 forecasts and actual results. The company's initial forecast anticipated a loss—with net sales of 6,150 million yen, an operating loss of 24 million yen, an ordinary loss of 30 million yen, and a net loss of 17 million yen— factoring in seasonality and the impact of institutional revisions .
In reality, the company achieved net sales of 6,247 million yen (+97 million yen vs. forecast) and an operating profit of 17 million yen (+41 million yen vs. forecast) , successfully turning a projected loss into a profit . This was driven by higher prescription unit prices in the Pharmaceutical segment and stronger-than-expected performance in the Childcare Support segment, characterized by increased enrollment in licensed nursery schools and improved operational efficiency.
3. Overview of Segment Performance
The trends in net sales and segment profit for each business segment are as follows:
| Business Segment | Net Sales (YoY) | Segment Profit (YoY) | Profit Margin | Overview |
|---|---|---|---|---|
| Pharmaceutical | 2,473 million yen (+3.0%) | 65 million yen (-16.1%) | 2.7% | Higher prescription volume offset by fee revisions |
| Childcare Support | 2,597 million yen (+6.1%) | 243 million yen (+18.9%) | 9.4% | Significant profit growth from enrollment and price revisions |
| Nursing Care | 885 million yen (+1.8%) | 3 million yen (-41.9%) | 0.4% | High occupancy maintained, but hit by medical fee revisions |
| Other (Food, etc.) | 290 million yen (+8.3%) | 7 million yen (-32.6%) | 2.7% | Revenue growth offset by rising costs |
Overall, while the Childcare Support segment acted as a powerful growth driver, the Pharmaceutical and Nursing Care segments struggled in terms of profitability due to the direct impact of institutional revisions.
4. Deep Dive: Pharmaceutical Segment Analysis (Prescription Volume and Unit Price)
The Pharmaceutical segment reported net sales of 2,473 million yen (+3.0% YoY) and a segment profit of 65 million yen (-16.1% YoY). While prescription volume grew steadily due to new store openings, the impact of revisions pressured profits.
Slide Commentary (P7: Pharmaceutical Segment Key KPI Quarterly Trends)
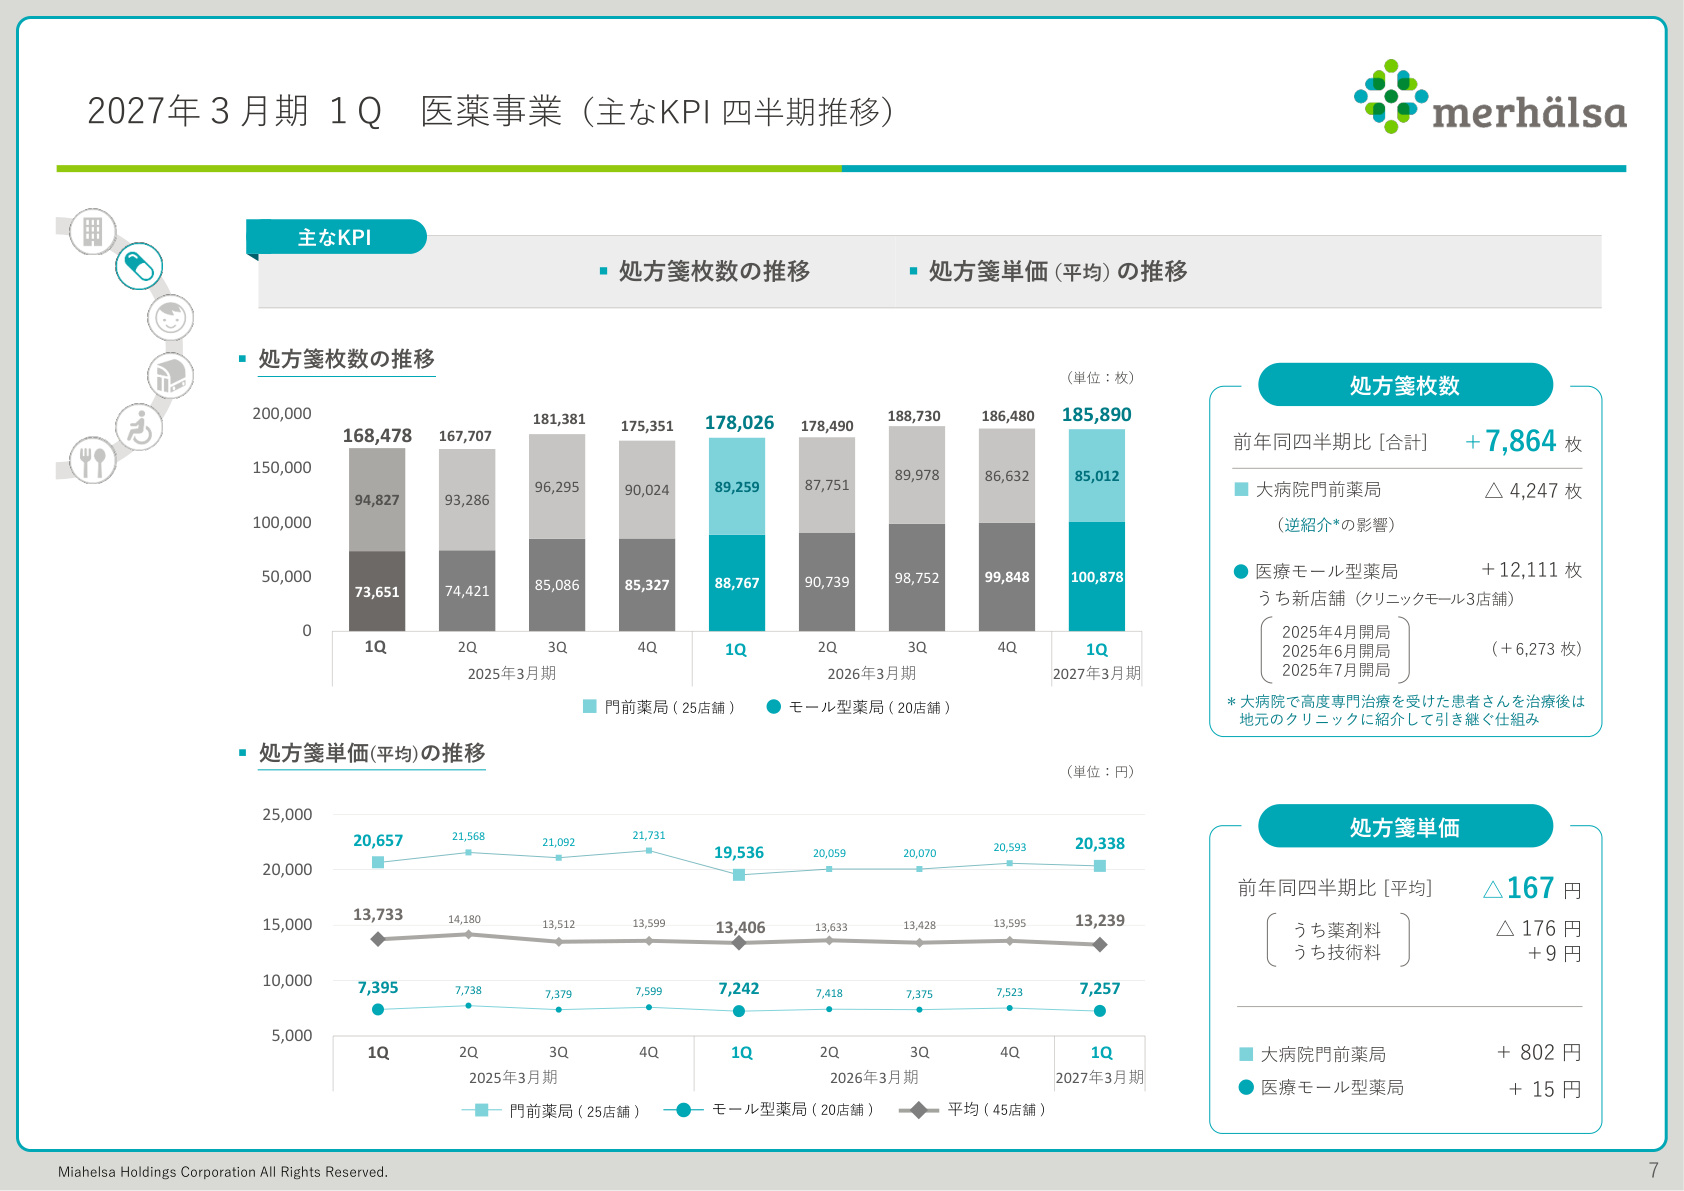
The slide above shows the quarterly trends for "Prescription Volume" and "Prescription Unit Price," which are critical for measuring sustainable growth in the Pharmaceutical segment.
- Increase in Prescription Volume : Total volume reached 185,890 prescriptions (+7,864 YoY) . While volume at pharmacies located in front of large hospitals decreased by 4,247 due to patient referrals to local clinics, medical mall-type pharmacies grew significantly by 12,111 , with new stores (3 clinic malls) contributing 6,273 prescriptions.
- Fluctuation in Prescription Unit Price : The average unit price was 13,239 yen (-167 yen YoY) . While the drug cost component fell to 13,406 yen (-176 yen) due to price revisions and stricter concentration rate rules, the technical fee component rose to 7,257 yen (+9 yen) through efforts to acquire additional dispensing and pharmaceutical management fees.
A structure is being established where volume growth covers the decline in unit prices to maintain revenue growth.
5. Deep Dive: Childcare Support Segment (Enrollment Expansion and Profitability)
The Childcare Support segment delivered excellent performance , with net sales of 2,597 million yen (+6.1% YoY) and segment profit of 243 million yen (+18.9% YoY). The segment profit margin improved by 1.0 percentage point to 9.4% .
- Expansion of Enrollment : Total enrollment reached 9,230 children (+228 YoY) , with steady gains in both newly opened and existing facilities.
- Positive Contribution of Official Price Revisions : The increase in the official government price for FY2025 contributed to revenue, successfully absorbing the rise in personnel costs associated with improving working conditions for childcare staff.
The company maintains a total of 57 facilities (53 licensed and 4 certified nursery schools), leveraging strong local appeal and operational expertise to drive profitability.
6. Deep Dive: Nursing Care Segment (High Occupancy and Hospice Challenges)
The Nursing Care segment reported net sales of 885 million yen (+1.8% YoY) and segment profit of 3 million yen (-41.9% YoY).
- High Utilization Levels : Occupancy at serviced housing for the elderly reached 96.5% (+3.4 points YoY) . Day service users increased to 17,218 (+781 YoY), with an operating rate of 79.1% (+3.6 points YoY) .
- Profit Pressure Factors : Despite high occupancy, the June 2026 medical fee revision negatively impacted the profitability of hospice-type homes , leading to a decline in segment profit.
7. Cost Structure and Personnel Investment Trends
Group-wide Selling, General, and Administrative (SG&A) expenses increased to 514 million yen (+12.4% YoY). This is the result of proactive investments aimed at securing and retaining talent to address the severe labor shortage in the medical and welfare industries.
While this acts as a short-term profit-depressing factor due to increased fixed costs in indirect departments, it is positioned as an essential investment to maintain service quality and support future growth.
8. Quarterly Seasonality and Progress Against Full-Year Plan
The full-year consolidated earnings forecast for FY2027 remains unchanged: Net Sales of 25,200 million yen, Operating Profit of 600 million yen, Ordinary Profit of 550 million yen, and Net Profit of 360 million yen.
Progress rates at the end of Q1:
- Net Sales : 24.8%
- Operating Profit : 2.9%
- Ordinary Profit : 4.1%
- Net Profit : 6.5%
While the operating profit progress rate of 2.9% appears low, the company's earnings structure has a clear seasonal bias toward the second half (particularly Q3 and Q4) . According to the materials (P15), the company plans for profit to expand significantly toward the end of the year. Securing a profit in Q1, despite an initial loss forecast, indicates an extremely favorable start toward achieving the full-year target .
9. Long-term Management Indicators and Financial Foundation
Reviewing the past five years of management indicators (P17), net sales have shown a consistent upward trend , growing from 22,249 million yen in FY2023 to the current forecast of 25,200 million yen. The equity ratio stood at 25.1% at the end of the previous fiscal year, and the company continues to maintain an annual dividend of 30.0 yen per share , balancing growth investment with shareholder returns.
10. Conclusion and Future Outlook
Miahelsa Holdings' Q1 FY2027 results demonstrate that despite external pressures from institutional revisions and increased personnel investments, the company successfully absorbed these impacts through business expansion (medical malls, nursery enrollment, and high occupancy in nursing care), outperforming its initial plans .
Key points to watch moving forward:
- Further prescription volume growth and unit price improvement in medical mall-type pharmacies.
- Maintaining high occupancy and profitability in the Childcare Support segment.
- Profitability improvement measures for the Nursing Care segment (hospice-type homes) following fee revisions.
- Whether seasonal profit expansion in the second half proceeds according to the initial plan.
Successfully navigating the uncertainty of institutional revisions through robust field operations and demand capture will be the key to achieving the full-year targets.
This content is not intended as investment advice or a recommendation. Any opinions expressed are solely the personal views of each article.