

Tsubaki Nakashima (6464) H1 FY2026 Earnings Deep Dive: Structural Reforms and Growth Segment Recovery Shaping the Future
Sentiment Analysis
The H1 FY2026 (January–June) financial results for Tsubaki Nakashima (Ticker: 6464) , a global leader in precision balls and rollers, demonstrate that the company is successfully rebuilding its core earning power through self-driven structural reforms and selective investment in growth areas, despite facing a challenging business environment characterized by a global slowdown in internal combustion engine vehicle demand and rising labor costs.
This deep-dive report provides a comprehensive analysis of the company's performance, profit structure, regional and product trends, and the progress of its medium-term management plan, centered on 10 key topics extracted from the earnings materials.
1. Overview of H1 Performance and Full-Year Outlook
For the first half of the fiscal year ending December 2026, consolidated net sales were ¥36.86 billion (+2.2% YoY; down 6.4% YoY on a real basis excluding currency effects), and operating profit was ¥1.32 billion (compared to ¥0.79 billion in the same period last year, +67.1% YoY; up 57.0% YoY on a real basis excluding currency effects).
While the results appear to show a significant profit increase against a decline in sales, this includes a one-time ¥1.0 billion gain from land sales . Excluding this, the real operating profit stands at ¥0.28 billion . However, the second quarter (April–June) included structural reform costs , such as expenses for the closure of the Irwin plant and organizational restructuring. Excluding these, a steady recovery trend in the core business is evident.
The full-year forecast (net sales of ¥70.0 billion , operating profit of ¥2.5 billion , and net income of ¥0.5 billion ) remains unchanged, indicating that performance is tracking in line with initial expectations.
2. Anatomy of Operating Profit Changes (Waterfall Analysis)
A detailed analysis of the factors behind the H1 operating profit (¥1.32 billion) compared to the same period last year (¥0.79 billion) reveals a complex interplay between deteriorating external conditions, internal improvement efforts, and one-time factors.
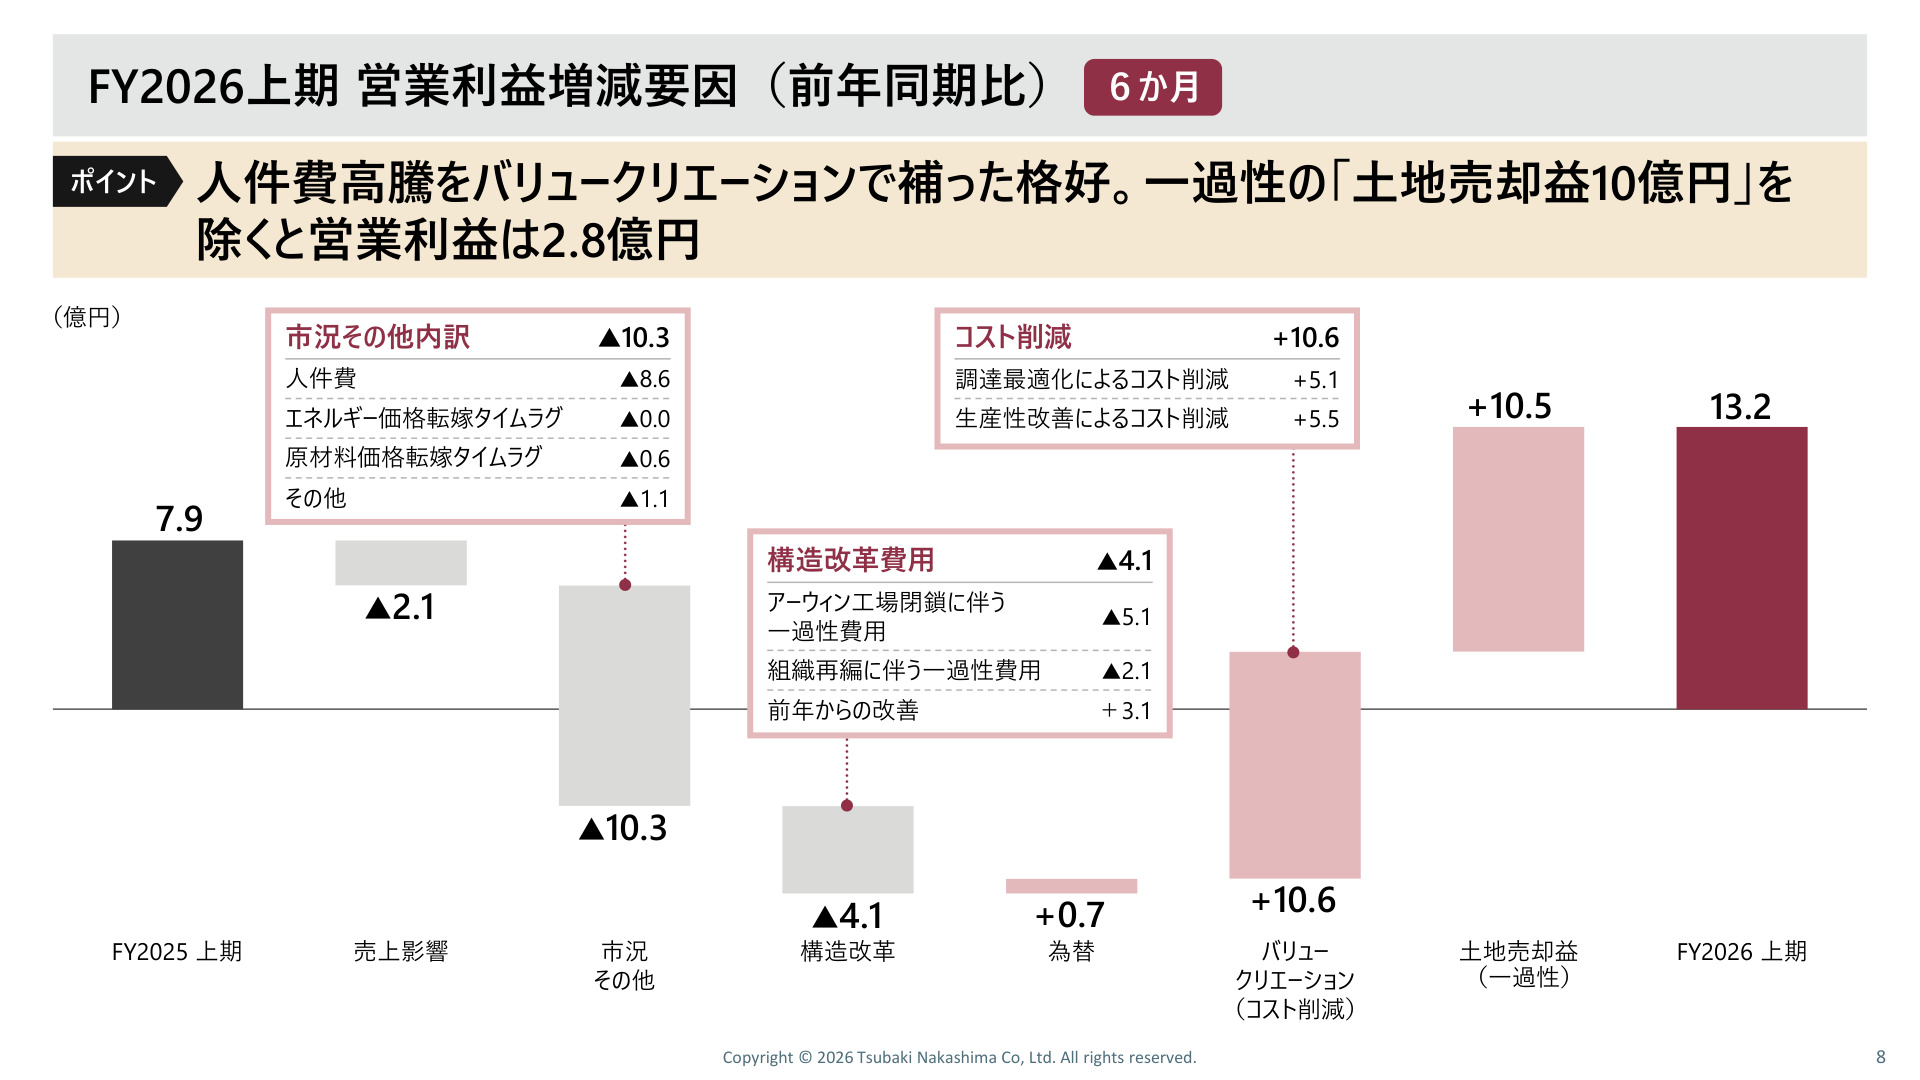
[Significance of the Slide (PAGE 8) and Data Analysis]
This slide is the most critical waterfall chart visualizing the changes in operating profit from the previous year . It provides decisive data to determine whether profit growth relies solely on one-time land sale gains or if internal cost-reduction efforts (value creation) are functioning effectively.
- External Deterioration Factors (Market conditions, etc.: -¥1.03 billion) : Primarily driven by global rising labor costs (-¥0.86 billion) and the time lag in passing on raw material and energy price increases (-¥0.06 billion).
- Sales Volume Impact (-¥0.21 billion) : Reflects the demand decline, particularly in Europe.
- Structural Reform Costs (-¥0.41 billion) : Includes one-time costs associated with the closure of the U.S. Irwin plant (-¥0.51 billion) and one-time costs related to organizational restructuring (-¥0.21 billion) (net of a ¥0.31 billion improvement from the previous year).
- Cost Reductions via Value Creation (+¥1.06 billion) : Procurement optimization (+¥0.51 billion) and productivity improvements (+¥0.55 billion) completely offset the negative impact of external factors (-¥1.03 billion).
- Land Sale Gain (+¥1.05 billion / ¥1.0 billion one-time) : Resulting from the transfer of idle land at the Georgia plant in the U.S., which absorbed structural reform costs and boosted the final bottom line.
This analysis confirms that even on a real-value basis excluding one-time gains, the company is steadily increasing its structural profit-generating capacity through robust value creation measures.
3. Regional and Segment Performance: Resilience in Japan/Asia vs. Struggles in Europe
Regional trends in the core Precision Components business (H1 net sales of ¥36.36 billion , down 6.5% YoY excluding currency effects) show clear regional disparities.
- Japan (Sales ¥6.16 billion, +7.1% excluding currency) : Strong performance in the ceramic business drove revenue growth.
- Asia (excluding China) (Sales ¥3.28 billion, +14.1% excluding currency) : Achieved double-digit growth due to expanding demand in India and strong ceramic demand in Thailand.
- North America (Sales ¥7.38 billion, -3.1% excluding currency) : Struggling slightly due to economic stagnation and market adjustments.
- China (Sales ¥8.15 billion, -6.6% excluding currency) : Experienced negative growth due to intensifying market competition.
- Europe (Sales ¥11.40 billion, -14.7% excluding currency) : Continues to face the most severe conditions, impacted by delayed recovery in internal combustion engine vehicle demand, intensified competition in the bearing industry, and a shifting competitive landscape in the ball market.
However, on a quarterly basis (Q2: April–June), the Precision Components segment saw an 8.5% QoQ increase in revenue (including currency), with regions outside of Europe (Japan +18.5%, China +17.2%, Asia excluding China +16.7%) showing clear signs of bottoming out and recovery.
4. Progress in Growth Segments: Led by Ceramics and Plastics
The H1 progress of the four "growth segments" designated in the medium-term management plan is as follows:
- Ceramic Balls (Progress: 56.3%) : Sales of ¥4.0 billion (Full-year target: ¥7.1 billion). Showing a strong recovery in automotive electrification and industrial machinery.
- High-Performance Plastics (EPC) (Progress: 55.2%) : Sales of ¥2.2 billion (Full-year target: ¥3.9 billion). Tracking ahead of schedule.
- Indian Market (Progress: 43.5%) : Sales of ¥1.5 billion (Full-year target: ¥3.6 billion). Strengthening of local manufacturing and sales foundations is underway, with further expansion expected in H2.
- Aerospace & Defense (Progress: 21.6%) : Sales of ¥0.3 billion (Full-year target: ¥1.2 billion). Demand is solid, and the plan is tracking as expected with deliveries weighted toward H2 .
Ceramic balls and high-performance plastics, in particular, have exceeded 50% progress toward their full-year targets, serving as pillars for the company's business transformation.
5. Rapid Recovery of Ceramic Balls by Application and New Demand in Advanced Industries
The ceramic ball business, where the company's technological superiority is most evident, has seen a rapid recovery in demand entering the second quarter.
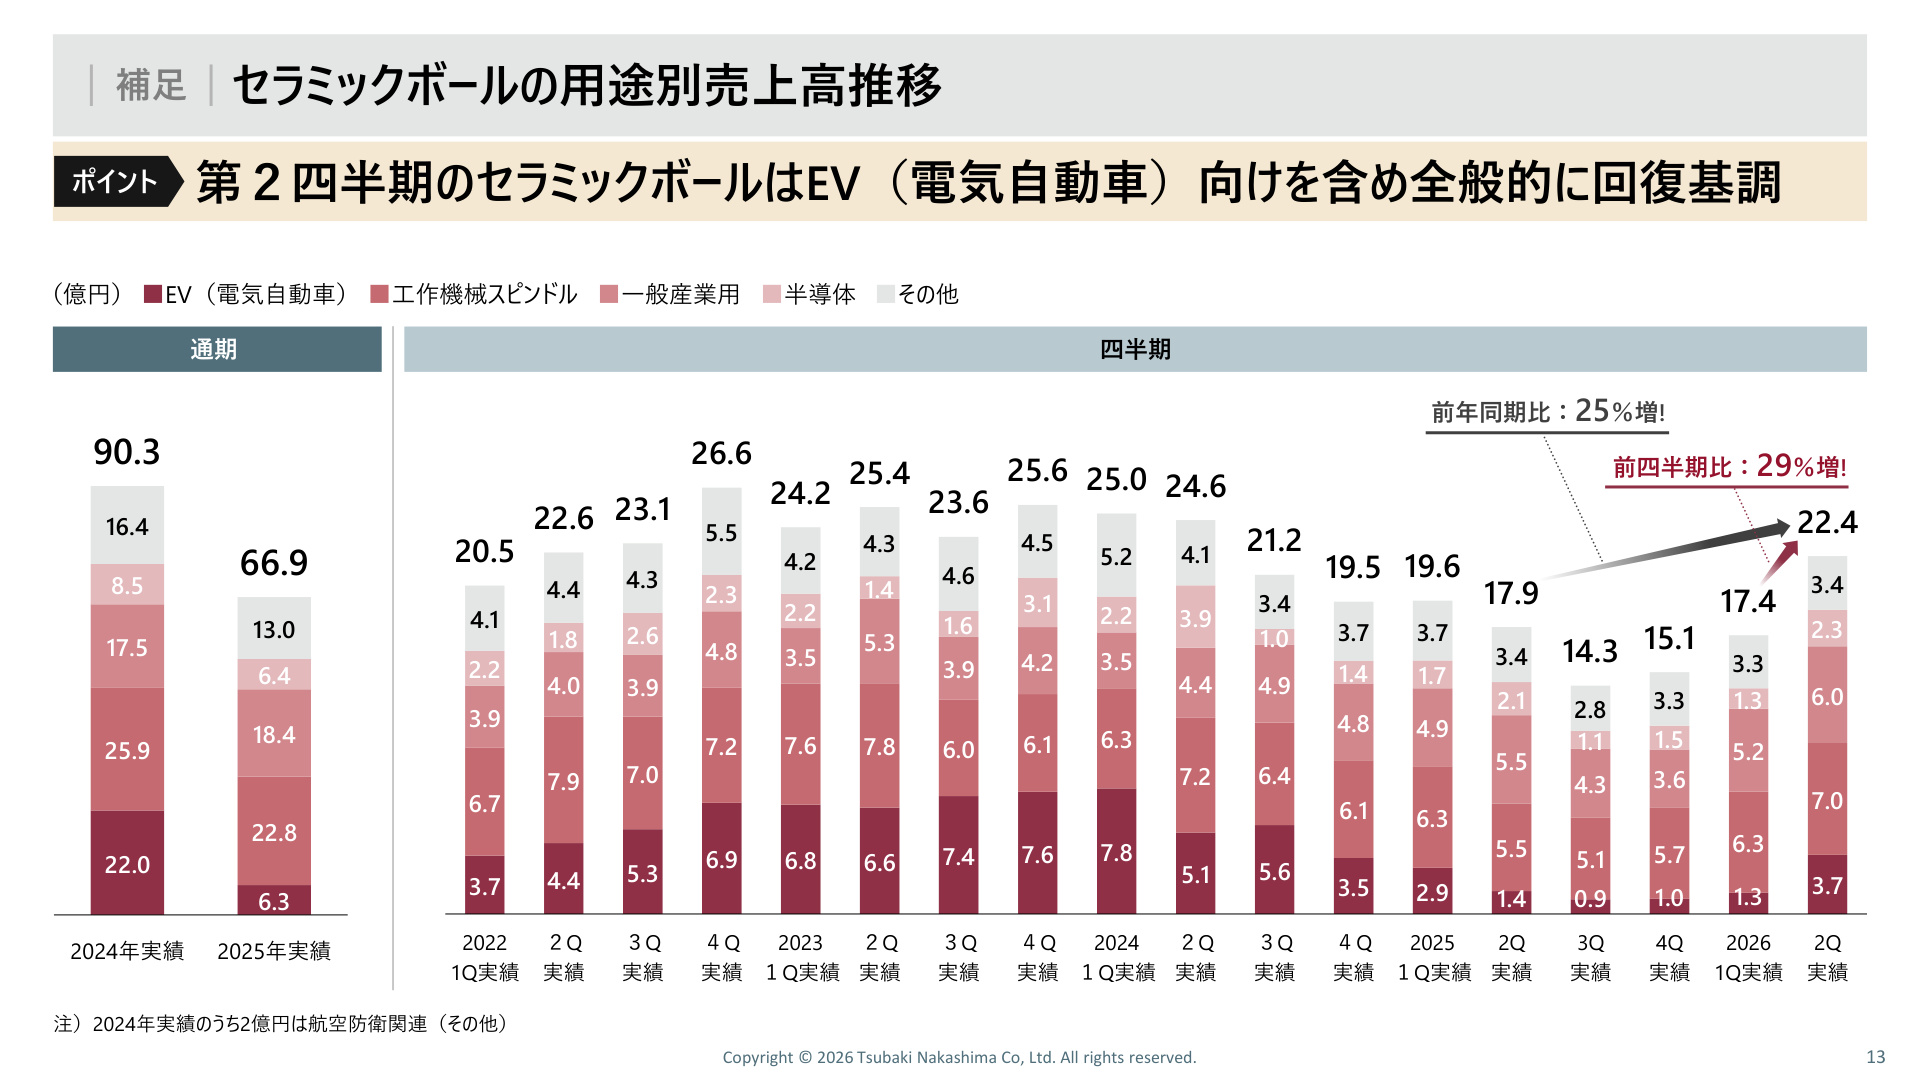
[Significance of the Slide (PAGE 13) and Data Analysis]
This slide presents data on the sales trends of ceramic balls by application , a high-value-added product. It is a direct indicator of the shift toward electrification (EV) and industrial machinery trends, and is crucial for forecasting future gross margin improvements.
Key points from the graph:
- Sharp Quarterly Recovery : Q2 FY2026 (April–June) sales reached ¥2.24 billion , a 25% increase YoY and a 29% increase QoQ .
- Recovery in EV Demand : EV-related sales, which bottomed out between Q3 and Q4 of 2025, rebounded to ¥0.7 billion in Q2 2026 (compared to ¥0.63 billion in Q1 and ¥0.56 billion in the same period last year).
- Bottoming Out in Machine Tool Spindles, Semiconductors, and General Industry : Sales in non-EV industrial applications (machine tools, semiconductors, etc.) are also trending toward recovery.
Furthermore, the materials mention potential new demand related to AI infrastructure . Specifically, adoption is expected to expand for precision components essential to cutting-edge hardware in the AI era, such as vacuum pumps for semiconductors , humanoid robots (precision balls for actuators, with an expected CAGR of over 50% toward 2035), and cooling fans for data centers .
6. Strengthening Business Foundations in the Strategic "Indian Market"
In the Indian market, which the company positions as a growth driver, active site development and expansion of production systems are underway.
- New Sales Office in Pune : Opened a new base in Pune, a leading manufacturing and IT hub, specializing in sales and customer support.
- Expansion of Bilad Plant No. 2 : Construction has begun to expand the Bilad plant to serve as a recipient for production transferred from the closed U.S. Irwin plant and to capture growing domestic demand in India.
- BIS (Bureau of Indian Standards) License Acquisition : Obtained the BIS license, proving the quality and standard compliance of the company's products and creating entry barriers locally.
- Customer Recognition : Received the "Best in Overall Performance" supplier award from a Japanese bearing manufacturer operating locally, earning high trust.
7. Cash Flow and Balance Sheet Health
Even under a challenging business environment, the company is ensuring financial health and optimizing working capital.
- Reduction of Inventories : Inventories at the end of H1 FY2026 were ¥24.83 billion . While temporarily up by ¥0.3 billion from Q1, this represents a ¥0.9 billion reduction compared to the end of 2025 (¥25.73 billion).
- Cash Conversion Cycle (CCC) : The H1 FY2026 CCC was 204 days. While the overall figure worsened by 6 days due to longer accounts receivable collection periods, the inventory turnover period improved by 5 days YoY to 136 days .
- Free Cash Flow (FCF) : H1 FCF remained in the black at ¥0.07 billion (compared to ¥3.92 billion in the same period last year). Although lower than the previous year due to increased receivables and a smaller reduction in inventory, the company maintained positive cash flow while absorbing structural reform costs.
- Capital Expenditure : H1 actuals were ¥0.97 billion (Q1: ¥0.27 billion, Q2: ¥0.70 billion). The company plans to invest approximately ¥4.5 billion for the full year, with the plan weighted toward H2.
8. Progress of the Medium-Term Management Plan (2025-2029) and the "6 Pillars of Value Creation"
In its medium-term management plan toward FY2029, the company has set targets of ¥87 billion in net sales , ¥10 billion in operating profit (11% operating margin) , and a CCC of 175 days (FY2024: 260 days).
At the core are the "6 Pillars of Value Creation." In FY2026, the company is prioritizing "I. Global Production Site Reorganization" and "IV. Focus on Growth Segments."
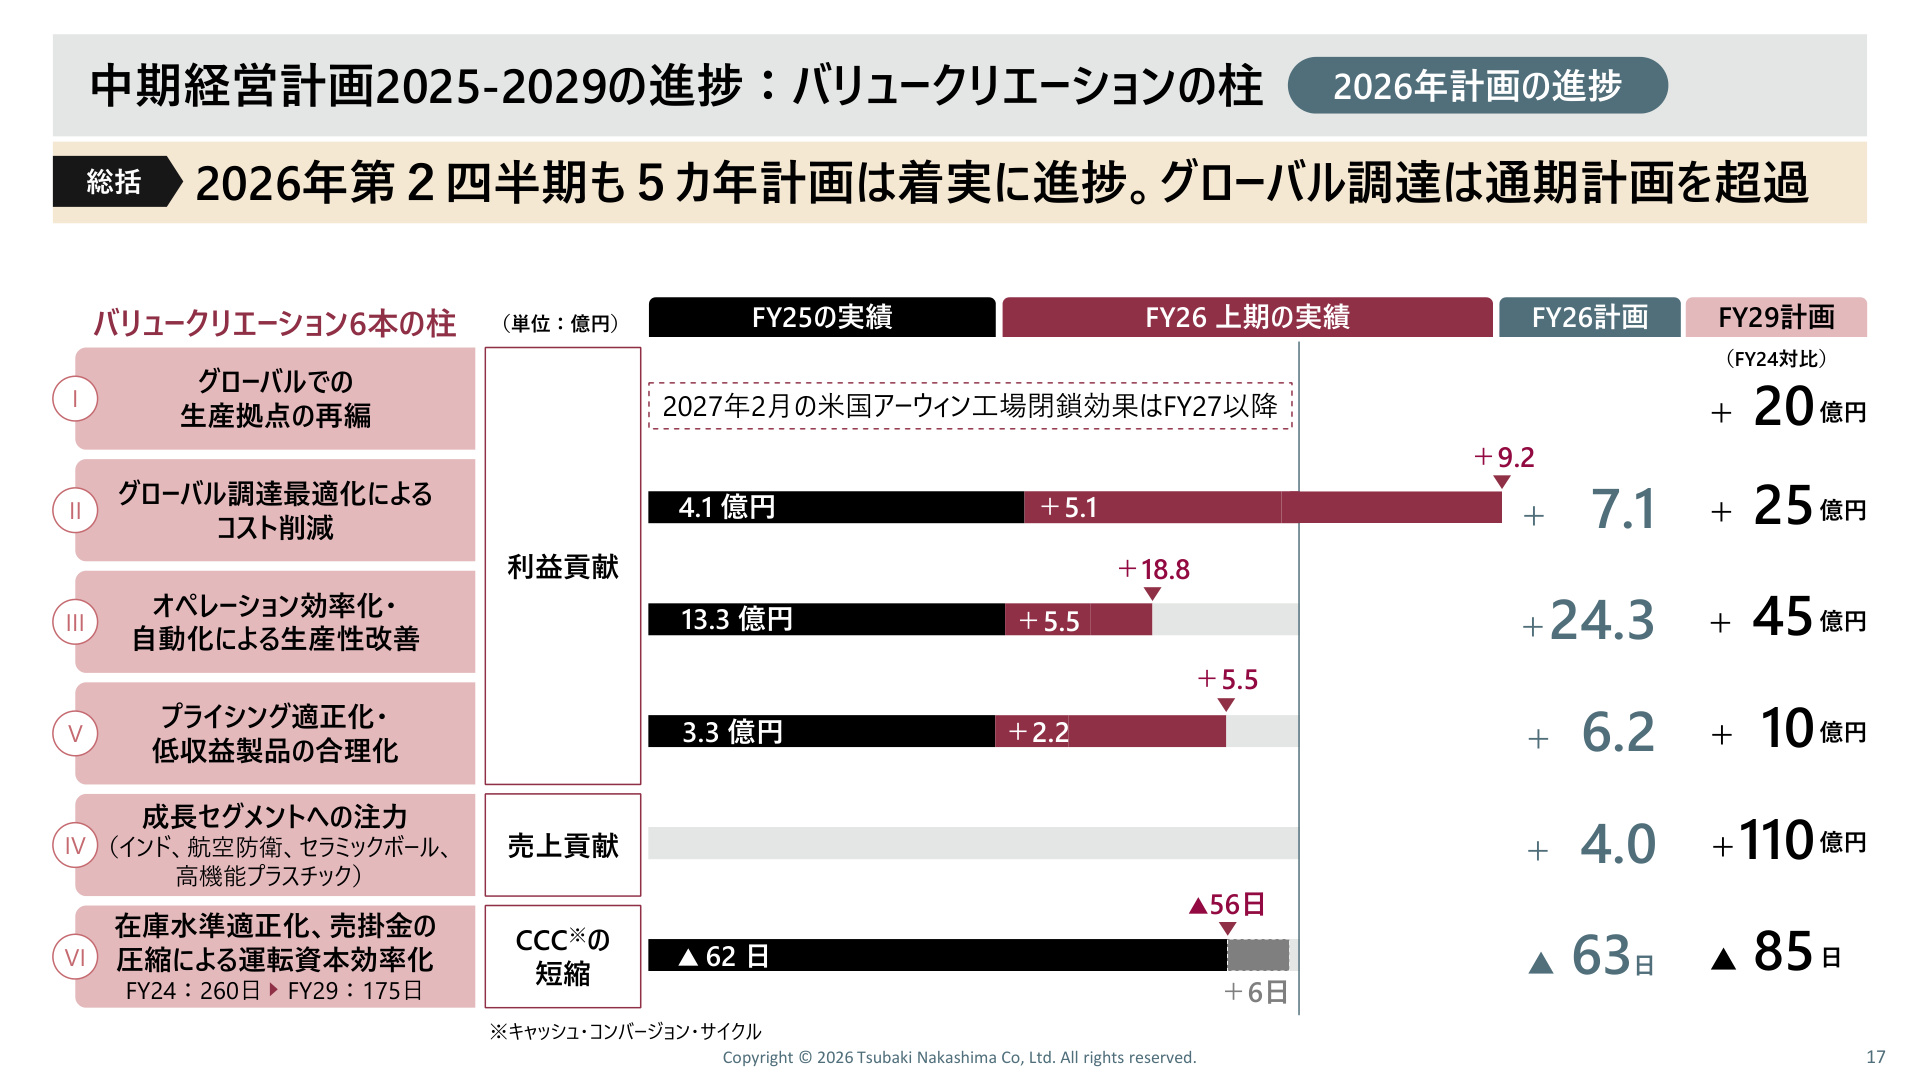
[Significance of the Slide (PAGE 17) and Data Analysis]
This slide is a roadmap quantitatively summarizing the progress and future goals of each of the 6 Pillars of Value Creation . It is the most important document for evaluating the logic behind the company's profit margin improvement and goal achievement.
Progress results are clearly shown as follows:
- I. Global Production Site Reorganization : Proceeding with the closure of the U.S. Irwin plant. The structural cost reduction effect is expected to contribute significantly from FY2027 onwards (target of +¥2.0 billion profit contribution by FY2029).
- II. Cost Reduction via Global Procurement Optimization : Contributed +¥0.51 billion to profit in H1 FY2026 (up from ¥0.41 billion in FY2025). Showing very high progress against the full-year plan (+¥0.71 billion), functioning as the most immediate measure.
- III. Productivity Improvement via Operational Efficiency/Automation : Contributed +¥0.55 billion to profit in H1 FY2026 (full-year plan +¥2.43 billion). Effects of smart factory and automation investments are beginning to emerge.
- V. Pricing Optimization/Rationalization of Low-Profit Products : Contributed +¥0.22 billion to profit in H1 FY2026 (full-year plan +¥0.62 billion). Proceeding with the streamlining of unprofitable items and appropriate price pass-throughs.
- IV. Focus on Growth Segments : Steadily expanding with a goal of +¥11.0 billion in sales contribution by FY2029, centered on ceramic balls and the Indian market.
- VI. Working Capital Efficiency (CCC Shortening) : Against the plan to shorten from 260 days in FY2024 to 175 days in FY2029, the company has maintained a 56-day reduction (204 days) as of H1.
9. Sustainability Initiatives (ESG/Decarbonization)
In parallel with business reforms, the company is firmly committed to sustainability management.
- CO2 Emission Reduction Project : Launched 19 major projects that combine CO2 reduction with productivity improvement.
- Introduction of Green Power : Purchased green power certificates at 5 factories to reduce CO2 emissions in manufacturing processes.
- Improvement in Carbon Footprint : H1 FY2026 carbon footprint reached 0.64 (CO2 tons/ton) , achieving a superior level well below the annual target of 0.80, a 14% improvement YoY (0.74).
- Total CO2 Emissions : H1 FY2026 CO2 emissions totaled 27,292 tons (Q1: 14,107 tons; Q2: 13,185 tons), a 17% reduction from the same period last year (32,686 tons).
- External Certifications/Initiatives : Maintains a "B" level in CDP "Climate Change" and has received certification for "Science Based Targets" from the SBTi, gaining objective recognition.
10. Conclusion and Future Business Outlook
In summary, Tsubaki Nakashima's H1 FY2026 earnings reflect a phase of "absorbing headwinds such as the European market slump and rising labor costs with one-time gains, while front-loading structural reform costs like plant closures, and building future earning power through self-driven value creation and growth areas (ceramics/India)."
Beyond short-term profit fluctuations, the company is steadily advancing structural strengthening measures , such as the reorganization of global production sites (contributing to profit from FY2027) and procurement optimization/productivity improvements (+¥1.06 billion cost reduction in H1).
Furthermore, the company is successfully sowing seeds for a medium-to-long-term growth story, including the bottoming out of demand for EV ceramic balls, potential new demand in cutting-edge fields like AI infrastructure and humanoid robots, and aggressive investment in the Indian market. How these reform measures translate into improved profitability (11% operating margin target) in H2 and beyond will be the key point to watch in tracking the company's future trajectory.
Correction (September 29, 2026): Corrected the specified amounts, rates or reporting periods against the original company disclosure; the verified changes are recorded in the correction ledger. Source
This content is not intended as investment advice or a recommendation. Any opinions expressed are solely the personal views of each article.