


DIC H1 FY2026 Earnings Deep Dive: Record-High Profits Driven by Semiconductor Material Growth and Rapid Price Pass-Through; Full-Year Guidance Raised and Shareholder Returns Enhanced

StockClub
Published: Aug 10, 2026, 10:09 AM
Sentiment Analysis

DIC Corporation’s financial results for the first half (H1) of fiscal year 2026 demonstrate robust performance, with record-highs achieved in both net sales and profit at all levels . The strong results were driven by the core Chemtronics business, where shipments of high-value-added products surged due to expanding demand for AI semiconductors. Furthermore, the company successfully implemented price revisions at a faster pace than in the past to offset rising global raw material costs. Alongside these results, the company announced an upward revision to its full-year earnings forecast, accompanied by increased dividends and a share buyback program , signaling a significant expansion of shareholder returns.
Below, we break down the key topics from the earnings presentation into 10 points, providing an in-depth analysis of the company’s performance highlights, profit drivers, segment trends, and mid-to-long-term growth and capital strategies.
1. H1 Performance Highlights: Record-High Sales and Profits
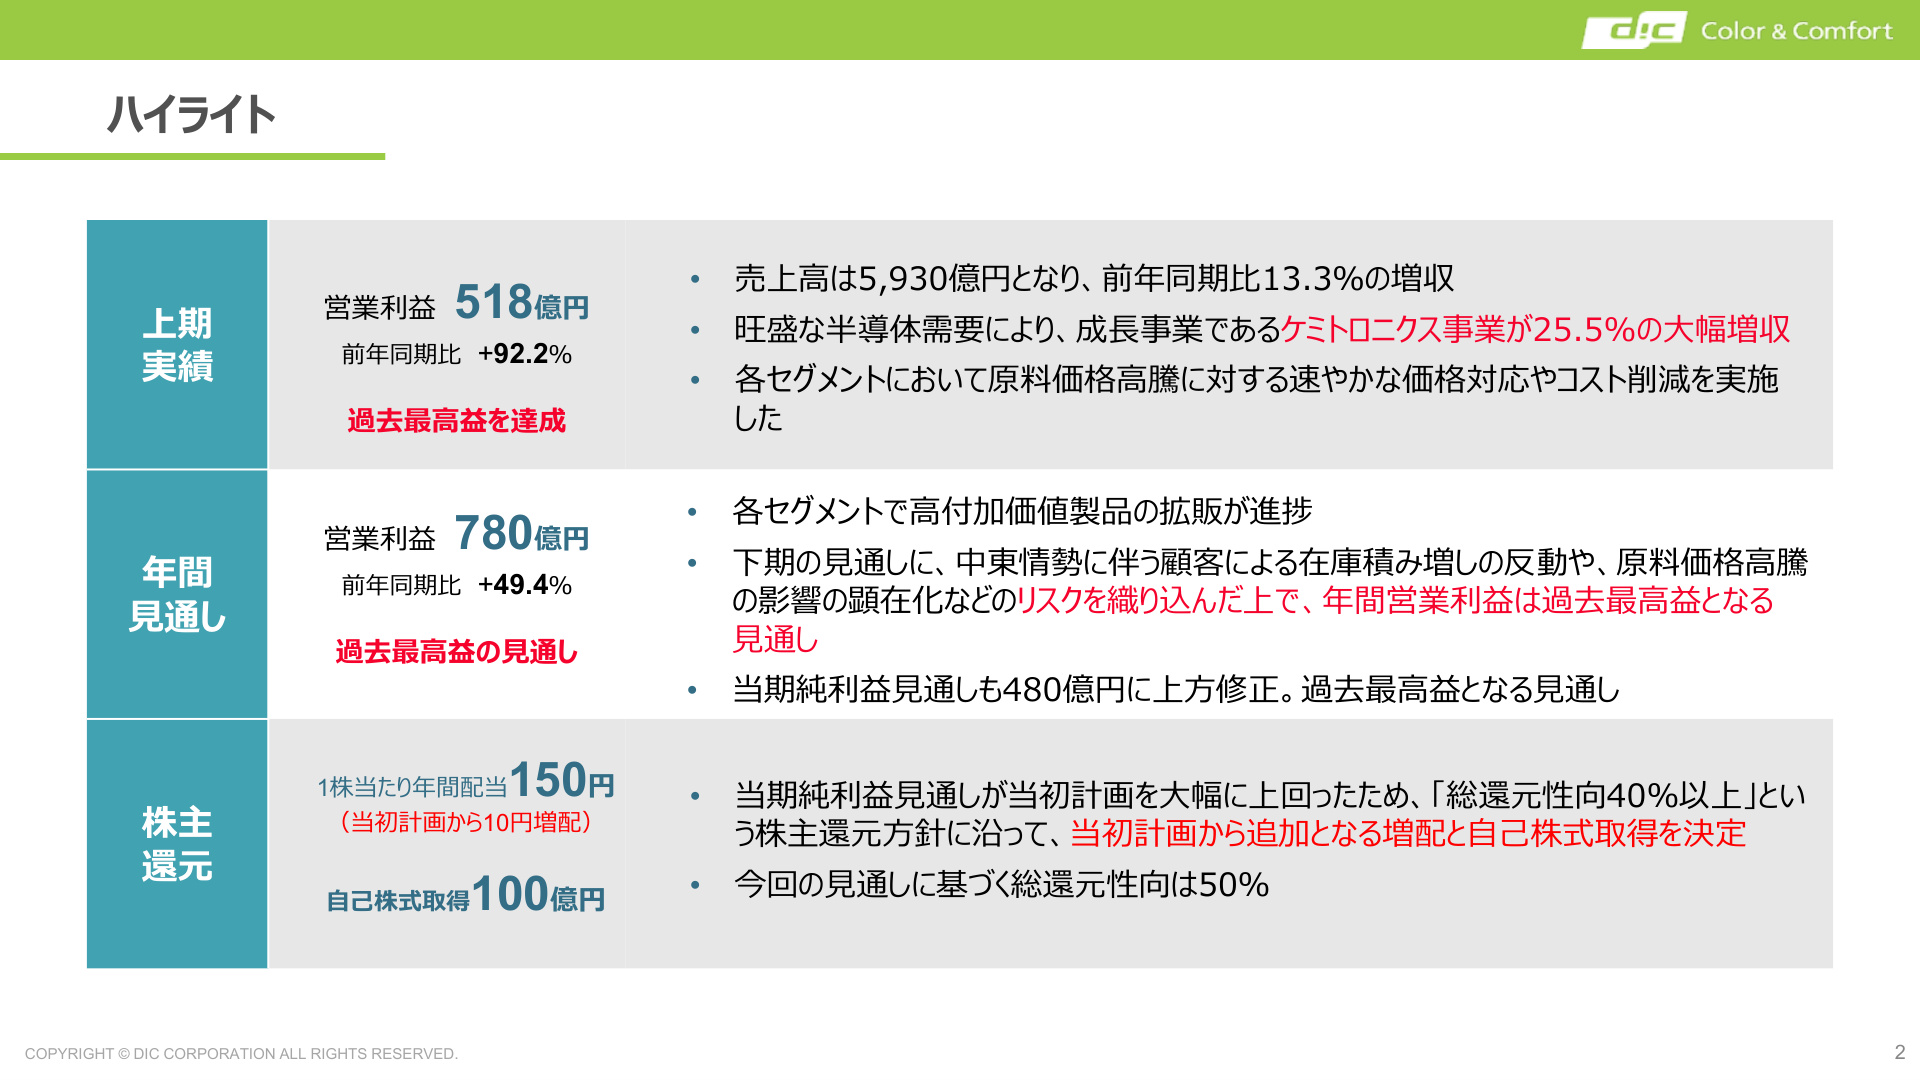
Consolidated results for H1 FY2026 were as follows: Net sales of 593.0 billion yen (+13.3% YoY) , Operating profit of 51.8 billion yen (+92.2% YoY) , Ordinary profit of 52.3 billion yen (+157.7% YoY) , and Net income attributable to owners of the parent of 37.2 billion yen (+184.1% YoY) . All major indicators reached record highs for the first half.
Slide Commentary (Page 1: Highlights)
This slide is critical, summarizing the core announcements: "Record H1 Profits," "Upward Revision of Full-Year Guidance," and "Enhanced Shareholder Returns." The primary drivers behind the nearly twofold increase in H1 operating profit (+92.2% YoY) were the growth of the Chemtronics business (sales +25.5%) , supported by strong semiconductor demand, and swift price revisions and cost reductions in response to soaring raw material costs. The slide also provides a clear overview of the revised annual operating profit forecast of 78.0 billion yen (+49.4% YoY) , a 10-yen dividend increase (150 yen/share) , and a 10 billion yen share buyback program .
2. Quarterly Operating Profit Trends: A Story of Dramatic Profitability Improvement
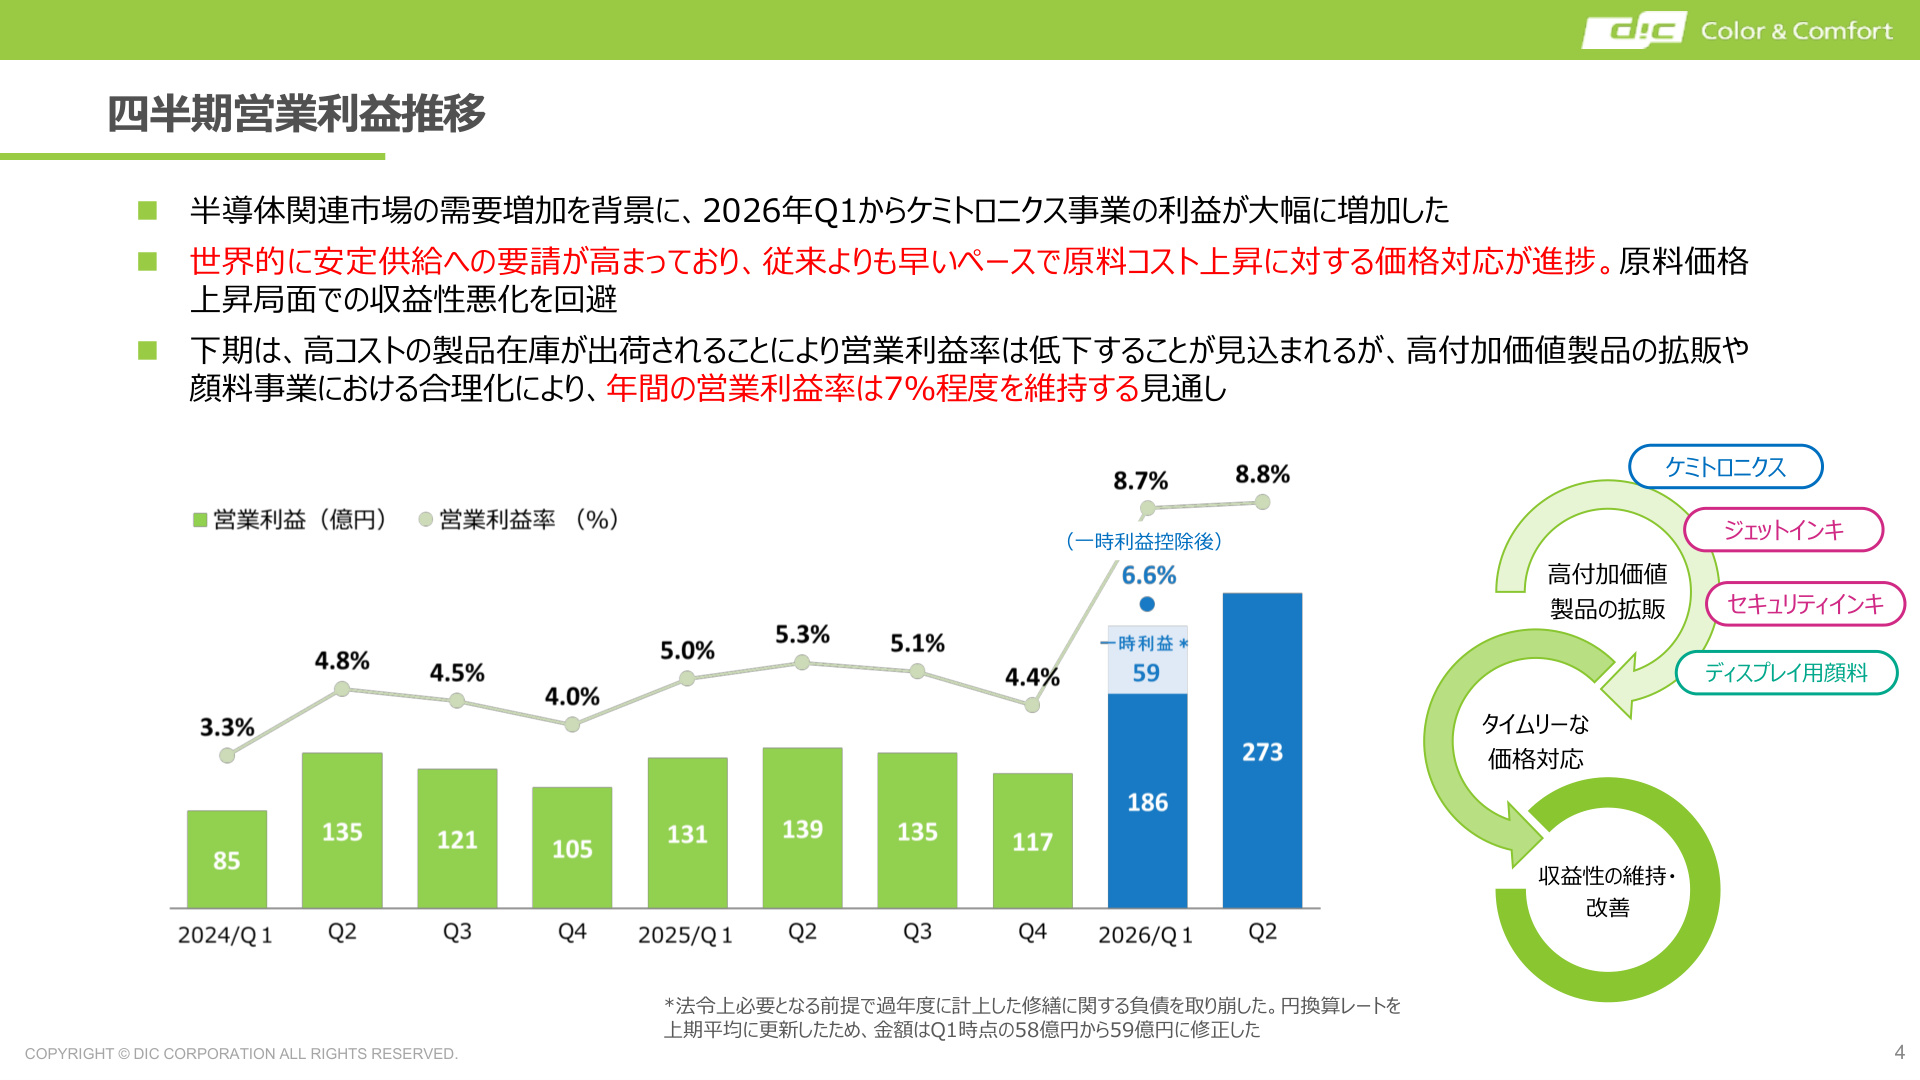
Looking at quarterly operating profit trends, the company’s structural increase in earning power is evident. While operating margins hovered between 3.3% and 5.3% from FY2024 to FY2025, they surged to 8.7% in Q1 2026 (6.6% excluding one-time gains) and 8.8% in Q2 2026 .
Slide Commentary (Page 3: Quarterly Operating Profit Trends)
This slide illustrates the momentum and qualitative shift in profit growth. Even excluding the one-time gain from the reversal of prior-year repair liabilities in Q1 (5.9 billion yen), the underlying operating margin has significantly improved . This is attributed to the expansion of high-value-added product sales (improved product mix) —such as Chemtronics products, jet inks, security inks, and pigments for displays—and timely price increases, demonstrating the company’s strong pricing power and product competitiveness.
3. Factors Behind H1 Operating Profit Growth: Led by Price Revisions and High-Value Products
The 24.9 billion yen increase in operating profit (from 27.0 billion yen in the previous H1 to 51.8 billion yen) is broken down as follows:
- Sales Price Revisions: +16.1 billion yen (Timely response to raw material inflation)
- Volume/Product Mix Improvement: +8.3 billion yen (Strong performance in Chemtronics and other high-value products)
- One-time Gains: +5.9 billion yen (Reversal of repair liabilities in Q1, etc.)
- FX Impact/Other: +2.9 billion yen (Boost from yen depreciation)
- Pigment Structural Reform: +1.8 billion yen (Realization of reform benefits)
- Raw Material Cost Inflation: -5.6 billion yen (Impact of rising naphtha prices, etc.)
- Cost Increases: -4.6 billion yen
The ability to significantly offset raw material inflation (-5.6 billion yen) with sales price revisions (+16.1 billion yen) was the key driver of profit expansion.
4. Segment Trends ①: Packaging & Graphic
- Net Sales: 307.2 billion yen (+14.3% YoY)
- Operating Profit: 21.7 billion yen (+62.6% YoY)
- Operating Margin: 7.1% (vs. 5.0% in the previous H1)
Although demand for packaging inks was soft due to global consumption declines caused by inflation, customers engaged in front-loaded procurement in anticipation of worsening Middle East tensions . Significant profit growth was achieved through the expansion of high-value-added fields like jet and security inks, and successful price pass-through across all regions.
5. Segment Trends ②: Color & Display
- Net Sales: 142.5 billion yen (+8.6% YoY)
- Operating Profit: 12.0 billion yen (2.1x YoY)
- Operating Margin: 8.4% (vs. 4.3% in the previous H1)
Despite demand fluctuations and high raw material costs, the segment saw revenue growth due to front-loaded demand, price revisions, and the weak yen. Operating profit benefited from the Q1 one-time gain (5.9 billion yen), increased shipments of display pigments due to improved panel manufacturer utilization , and cost reductions from structural reforms in the pigment business.
6. Segment Trends ③: Functional Products and the Breakthrough of "Chemtronics"
- Net Sales: 161.6 billion yen (+13.0% YoY)
- Operating Profit: 21.3 billion yen (+96.4% YoY)
- Operating Margin: 13.2% (vs. 7.6% in the previous H1)
This segment, centered on high-value materials for digital and mobility applications, was a major driver of company-wide performance. In particular, the "Chemtronics Business Division" delivered stellar results:
- Chemtronics H1 Net Sales: 37.6 billion yen (+25.5% YoY)
- Chemtronics H1 Operating Profit: 8.1 billion yen (2.5x YoY)
- Operating Margin: 21.6% (vs. 10.9% in the previous H1)
Supported by the surge in AI semiconductor demand , shipments of epoxy resins for semiconductor packaging increased by 23% YoY . Industrial tapes for mobile devices (+14% YoY) and UV-curable resins (+26% YoY) also performed well, underscoring the division's status as a key growth engine.
7. Upward Revision of FY2026 Full-Year Earnings Forecast
Following the strong H1 performance, the company revised its full-year FY2026 forecast upward:
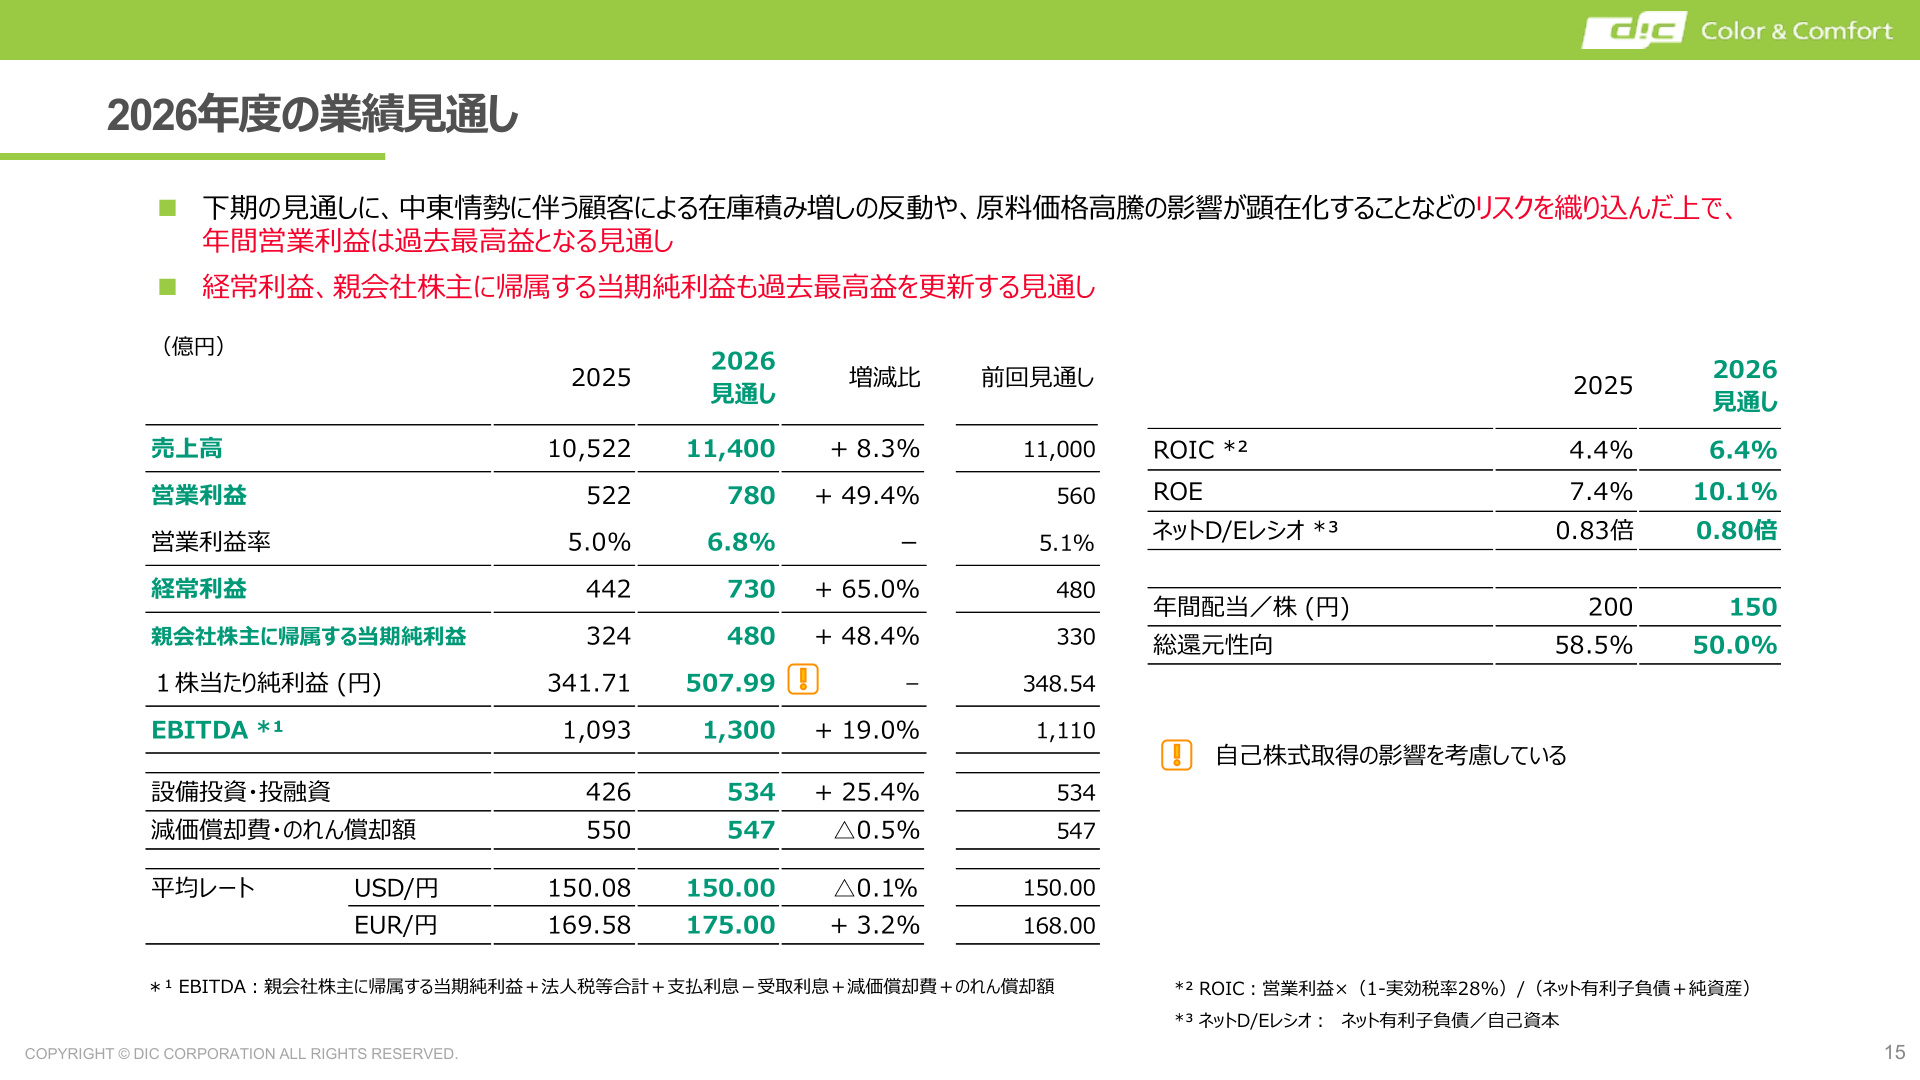
- Net Sales: 1,140 billion yen (+8.3% YoY; previous forecast: 1,100 billion yen)
- Operating Profit: 78.0 billion yen (+49.4% YoY; previous forecast: 56.0 billion yen)
- Ordinary Profit: 73.0 billion yen (+65.0% YoY; previous forecast: 48.0 billion yen)
- Net Income: 48.0 billion yen (+48.4% YoY; previous forecast: 33.0 billion yen)
Slide Commentary (Page 14: FY2026 Earnings Forecast)
This slide outlines the full-year outlook and anticipated H2 risks. The full-year operating profit of 78.0 billion yen and net income of 48.0 billion yen are both projected to be record highs . While the H2 operating profit forecast (26.1 billion yen) is lower than H1 (51.8 billion yen), this conservatively accounts for the absence of H1 one-time gains (5.9 billion yen) , seasonal factors in Color & Display, a reactionary decline in customer inventory buildup related to Middle East tensions , and margin compression as higher-cost raw material/product inventories are shipped . The fact that the company still expects record profits despite these risks highlights its solid underlying earning power.
8. Aggressive Expansion of Shareholder Return Policy
In line with the upward revision and the basic policy of a "Total Payout Ratio of 40% or more," the company has decided to significantly expand shareholder returns:
- Annual Dividend: 150 yen/share (10 yen increase from the initial 140 yen plan)
- Interim: 70 yen (decided)
- Year-end: 80 yen (forecast)
- Share Buyback: 10 billion yen (maximum) (Scheduled to begin August 12, 2026)
- Total Payout Ratio: 50.0% (Estimated based on the current forecast)
By combining increased dividends with a 10 billion yen buyback, the company is demonstrating its commitment to improving capital efficiency (ROE/ROIC) and maximizing shareholder value .
9. Mid-to-Long-Term Cash Allocation and Growth Investment Strategy
Over the five years from 2026 to 2030, the company expects Operating Cash Flow of 409 billion yen and 23 billion yen+ from asset sales . The allocation strategy is as follows:
- Routine Investment: 240 billion yen (Maintenance and rationalization of existing businesses)
- Strategic Investment + CVC: 90 billion yen + α (New epoxy resin plant for semiconductors, establishment of a deep-tech startup investment hub in Switzerland, etc.)
- Shareholder Returns: 78 billion yen + α (Increased returns in line with profit growth)
- Debt Reduction: 24 billion yen (Maintaining financial health)
This structure prioritizes strategic investments in growth areas— semiconductors, batteries, and physical AI —while balancing capital optimization and debt control.
10. Financial Position and Mid-to-Long-Term Capital Efficiency Targets
As of the end of June 2026, net interest-bearing debt stood at 382.8 billion yen, a reduction of 6.6 billion yen from the end of 2025. Due to the accumulation of equity (retained earnings +22.9 billion yen, FX translation adjustments +17.7 billion yen), the equity ratio improved to 38.3% (from 37.0% at end-2025) , and the net D/E ratio improved to 0.75x (from 0.83x) .
The company has set a net D/E ratio of 0.8x or less as its financial health target and aims for ROE of 10.1% and ROIC of 6.4% for FY2026 . By strengthening management through revised ROIC calculation methods for each segment, the company is steadily progressing toward building a business portfolio that exceeds its cost of capital.
This content is not intended as investment advice or a recommendation. Any opinions expressed are solely the personal views of each article.