


Optimus Group: Q1 FY2027 Earnings Deep Dive Report

StockClub
Published: Aug 07, 2026, 12:20 PM
Sentiment Analysis

Optimus Group: Q1 FY2027 Earnings Deep Dive Report
Optimus Group (TSE: 9268) delivered significant growth in both revenue and profit for the first quarter of the fiscal year ending March 2027 (April–June 2026). This performance was driven by a sharp recovery in its core used-vehicle exports to New Zealand (NZ), substantial expansion in European and other regional markets, and the successful monetization of previously unshipped inventory. Progress against the full-year plan has significantly exceeded the 25% benchmark across all key metrics, marking an exceptionally strong start to the fiscal year.
This report provides a comprehensive analysis of the company’s earnings structure, growth drivers, segment-specific trends, and future strategic outlook and risk factors, based on key topics extracted from the financial results.
1. Executive Summary and Earnings Highlights
Consolidated results for Q1 FY2027 were as follows: Revenue of ¥106,641 million (+54.3% YoY) , Gross Profit of ¥15,426 million (+50.4% YoY) , Operating Profit of ¥3,528 million (+78.3% YoY) , and Profit Before Tax of ¥1,369 million (+89.5% YoY) .
Both revenue and operating profit reached record highs for a first quarter. Progress toward the full-year forecasts (Revenue: ¥380,000 million; Operating Profit: ¥11,900 million) has reached 28.1% for revenue , 29.6% for operating profit , and 28.9% for profit attributable to owners of the parent (¥924 million) , indicating a trajectory that outperforms initial targets.
The primary drivers of profit growth included the shipment and monetization of inventory that had been delayed in the previous fiscal year due to port congestion and logistics constraints, a 35.5% YoY recovery in export volume to NZ (11,513 units), and a rapid 185.2% surge in exports to Europe and other regions (8,784 units). Additionally, the impact of past M&A in the Australian (AU) market and favorable foreign exchange translation gains further bolstered earnings.
2. Quarterly Earnings Summary and Momentum Analysis
Analyzing the quarterly performance reveals a clear trend of rising revenue and profit.
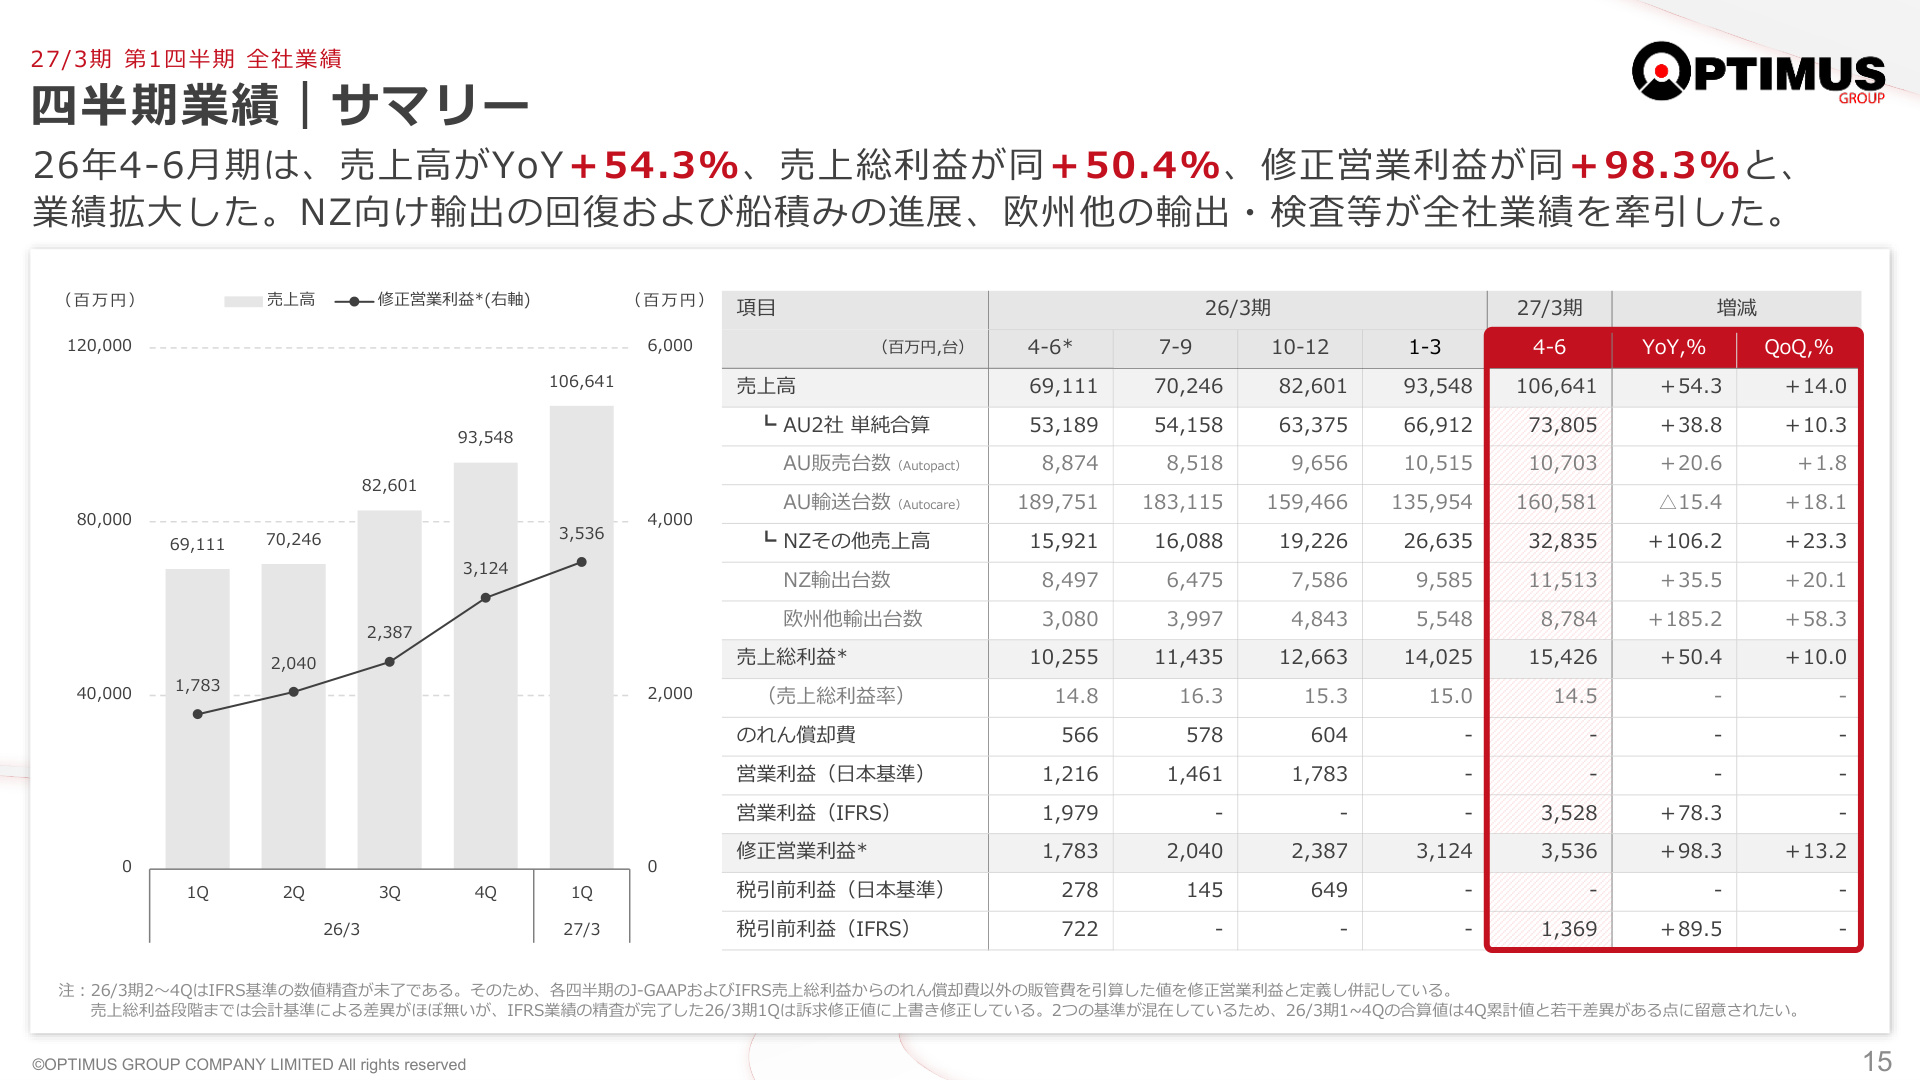
The slide above provides critical data on quarterly revenue and adjusted operating profit trends, along with their breakdowns. This slide is highly significant as it visually demonstrates the momentum contributed by both inorganic growth through M&A (AU business) and the existing used-vehicle value chain (NZ/European business) .
Revenue grew 14.0% quarter-on-quarter (QoQ) from ¥93,548 million in Q4 FY2026 to ¥106,641 million this quarter, while adjusted operating profit expanded from ¥3,124 million to ¥3,536 million (QoQ +13.2%). By region, the combined revenue of the two AU entities (Autopact and Autocare, etc.) stood at ¥73,805 million (YoY +38.8%), accounting for approximately 70% of the total. Meanwhile, revenue from NZ and other regions doubled to ¥32,835 million (YoY +106.2%, QoQ +23.3%), highlighting that the NZ value chain and European recovery are the true engines of top-line growth.
3. Clearing Unshipped Inventory and Normalizing Logistics
The trend of "unshipped inventory," which acted as a bottleneck in the previous fiscal year, is one of the most critical processes for investors to monitor.
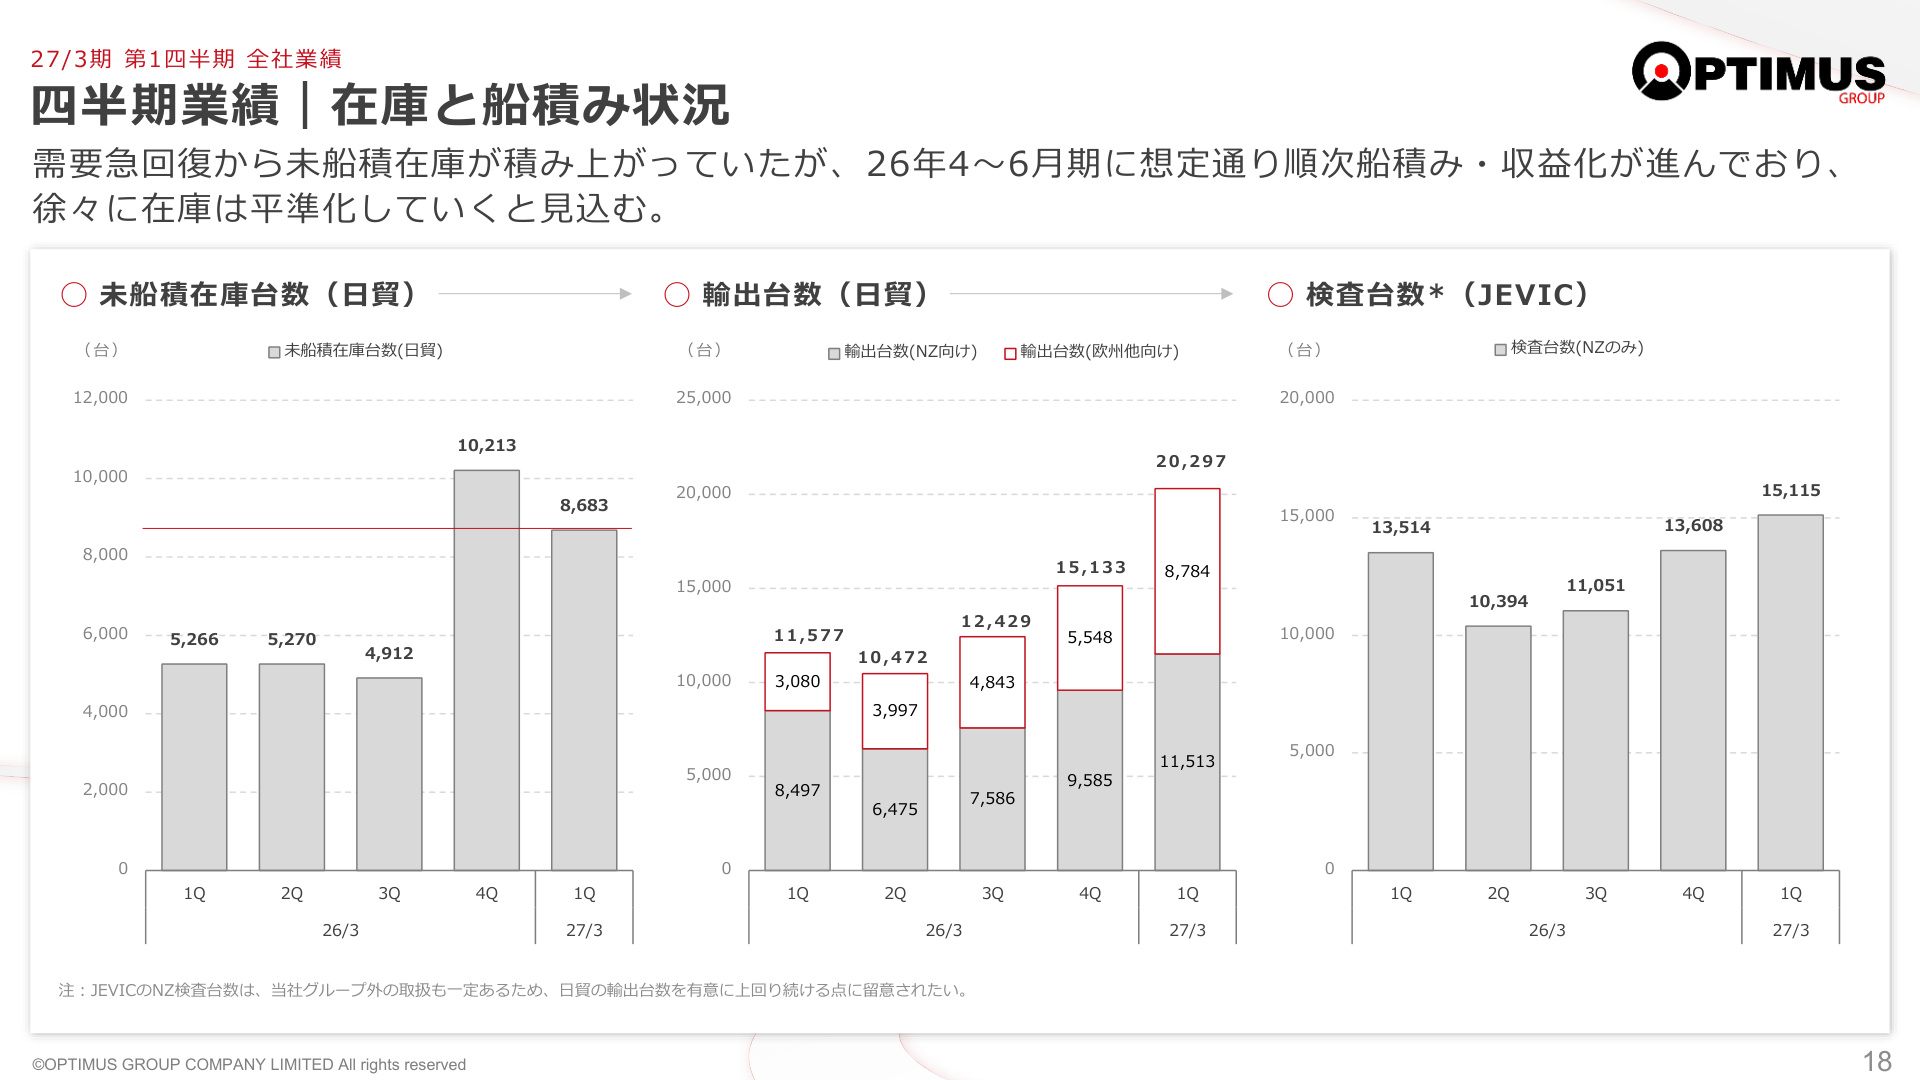
This slide illustrates the trends in unshipped inventory, export volume, and inspection volume by the subsidiary "JEVIC" within the core "Japan Trade (Export Business)." The context and significance of this data lie in the fact that logistics and shipping operations, which had lagged behind the rapid recovery in demand, have normalized, shifting the business into a profit-harvesting phase.
Unshipped inventory for the Japan Trade segment, which had accumulated to 10,213 units at the end of Q4 FY2026, has been reduced and normalized to 8,683 units by the end of this quarter as shipping and land transport progressed. Consequently, export volume reached a record high of 20,297 units (including 11,513 to NZ and 8,784 to Europe/others). This increase in export volume not only boosts vehicle sales revenue (Import/Export segment) but also increases the utilization rates of group-wide services— inspections (15,115 units for NZ by JEVIC), customs clearance, and maritime logistics—generating dual and triple revenue streams across the entire value chain.
4. Segment Trends and Value Chain Interdependency
The company’s operations are organized into five segments: "Retail/Wholesale," "Import/Export," "Logistics," "Services," and "Inspection." Performance by segment is as follows:
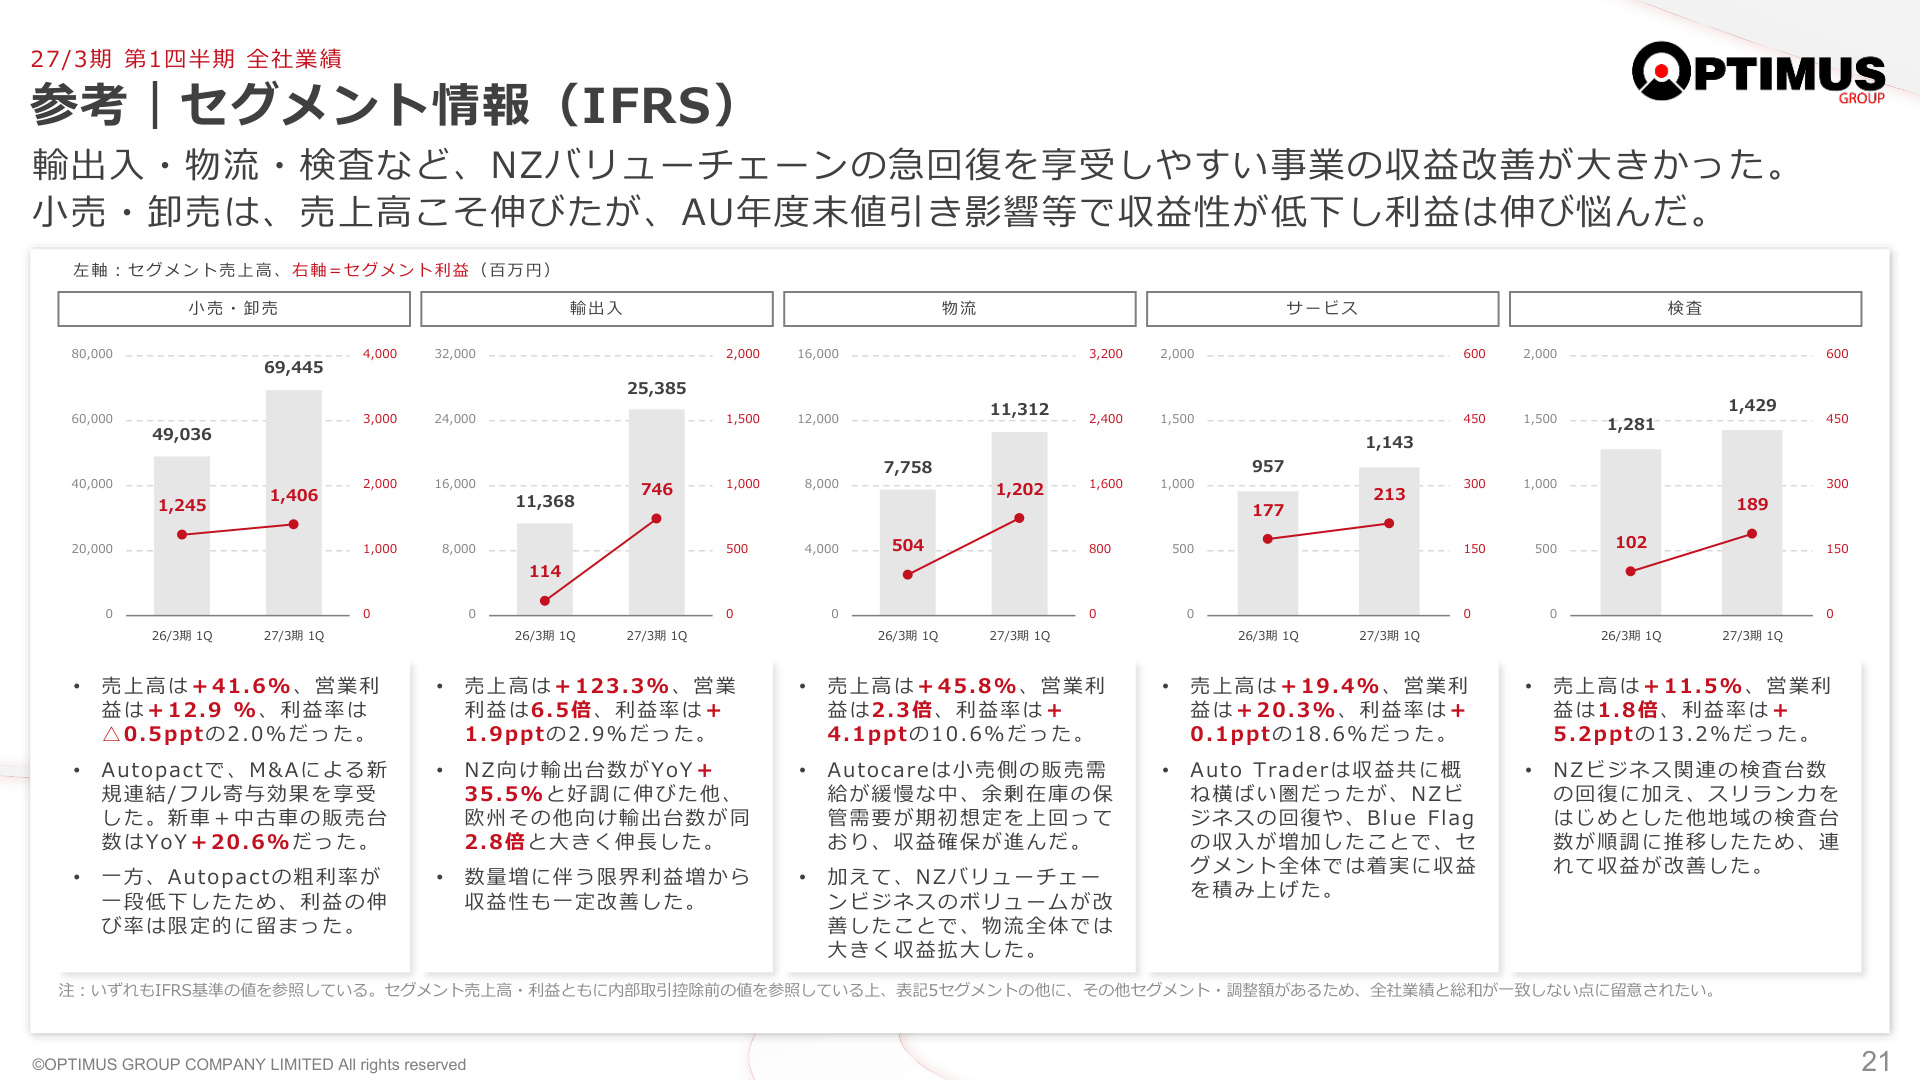
This segment information slide illustrates the structure essential for scrutinizing the strengths of the company’s complex business model and the profitability differences of each business.
- Import/Export Segment : Revenue of ¥25,385 million (YoY +123.3%), Operating Profit of ¥746 million (YoY +554.4%). Driven by the sharp recovery in NZ and a 2.8x expansion in Europe/others, marginal profit increased significantly, with the profit margin improving by 1.9ppt to 2.9%.
- Logistics Segment : Revenue of ¥11,312 million (YoY +45.8%), Operating Profit of ¥1,202 million (YoY +138.5%). Benefiting from surplus inventory storage demand at Autocare (AU automotive logistics) and increased transport volume in the NZ value chain, the profit margin reached a high level of 10.6% (YoY +4.1ppt).
- Inspection Segment : Revenue of ¥1,429 million (YoY +11.5%), Operating Profit of ¥189 million (YoY +85.3%). Profitability improved significantly due to the recovery in NZ inspection volumes and steady operations in other regions like Sri Lanka.
- Service Segment : Revenue of ¥1,143 million (YoY +19.4%), Operating Profit of ¥213 million (YoY +20.3%). The IT/data platform, centered on Auto Trader, contributed steady incremental profit.
- Retail/Wholesale Segment : Revenue of ¥69,445 million (YoY +41.6%), Operating Profit of ¥1,406 million (YoY +12.9%). While the new consolidation and full contribution of Autopact ensured revenue and profit growth, profit gains were limited due to a decline in gross margin (down approx. 0.7ppt QoQ) caused by year-end discount sales in AU and reduced maintenance needs for high-margin gasoline vehicles amid the EV shift.
In this way, the multi-layered portfolio effect is functioning perfectly, with the explosive growth of the NZ/European trade and logistics value chain compensating for the softening profitability of AU retail.
5. Regional Market Environment and Outlook
The external environment surrounding the company varies by region:
- New Zealand (NZ) Market : Used-vehicle demand is in a strong recovery phase, supported by a shift toward monetary easing and the relaxation of environmental regulations. Pent-up demand from the past two years is materializing, and the company’s overwhelming market share (39.4%) and end-to-end value chain are powerfully driving performance.
- Europe and Other Markets : Driven by high new-car prices and steady demand for Japanese and right-hand drive vehicles, the 3-year CAGR for used-vehicle export revenue remains high at +64.9%. These markets feature relatively higher-priced vehicles, contributing to an improvement in the overall product mix (higher gross margins).
- Australia (AU) Market : The macro environment is becoming increasingly uncertain due to expectations of further rate hikes amid persistent inflation, rising fuel prices linked to Middle East tensions, and changing customer structures due to the EV shift. In response, the company has adopted a more cautious stance (downward revision policy) on the future external environment for AU/NZ, but is currently leveraging the weak yen (113.12 JPY/AUD) and cost optimization through its 150-dealer network.
6. Financial Soundness, Capital Efficiency, and Shareholder Returns
Despite continuous large-scale M&A, the company maintains a sound financial position and high capital efficiency.
- Financial Soundness (Adjusted Net D/E Ratio) : Excluding "floor plan loans" (inventory financing specific to the dealer business), the effective adjusted net D/E ratio is 2.23x , remaining within a safe range.
- Capital Efficiency (Adjusted Working Capital Turnover Days) : Adjusted working capital turnover days stand at 31.1 days (11.8 turns per year) , indicating highly efficient capital circulation.
- Shareholder Returns and Mid-term Goals : The company aims to "raise the absolute amount of profit and the level of capital efficiency" and has set mid-term management targets of Operating Profit of ¥15 billion or more , Profit attributable to owners of the parent of ¥6 billion or more , and ROE of 15.0% or more . Regarding dividends, the company has introduced a DOE target of 4.5% based on adjusted shareholders' equity (excluding loans with permanent subordinated characteristics). The projected annual dividend for FY2027 is ¥18.00 (interim ¥8.00, year-end ¥10.00) .
7. Conclusion and Future Focus
Optimus Group’s Q1 FY2027 results were excellent, with the clearing of unshipped inventory and the rapid expansion of exports to NZ and Europe boosting performance and showing very high progress against the full-year plan.
Key points to watch moving forward include:
- To what extent the growth in NZ/European markets can offset or surpass the market deterioration in Australia.
- The cruising speed of growth for the NZ value chain after the shipment of unshipped inventory has normalized.
- Progress in PMI for the AU business (Autopact, Autocare) and the realization of cross-selling and cost synergies within the group.
The true value of the company’s multi-layered "Business x Region" growth portfolio, capable of responding to market fluctuations, will continue to be tested through the second half of the fiscal year.
This content is not intended as investment advice or a recommendation. Any opinions expressed are solely the personal views of each article.