


Matsuda Sangyo Q1 FY2027 Earnings Analysis: A Deep Dive into the Surge in Precious Metals and Upward Revision of Full-Year Guidance

StockClub
Published: Aug 07, 2026, 11:53 AM
Sentiment Analysis
Matsuda Sangyo Co., Ltd. achieved significant year-on-year growth in both revenue and profit for the first quarter (Q1) of the fiscal year ending March 2027 . This performance was driven by a robust recovery in the electronics industry and a sharp rise in precious metal prices, which provided a strong tailwind for the company's core Precious Metals business. Furthermore, reflecting the strong progress in Q1 and the favorable market environment, the company announced an upward revision to its full-year earnings forecast on the same day.
This report provides a comprehensive overview of the earnings results, focusing on 10 key topics derived from the financial presentation materials, including performance highlights, segment analysis, profit drivers, financial and cash flow status, and the future outlook.
1. Performance Highlights and Upward Revision of Full-Year Guidance
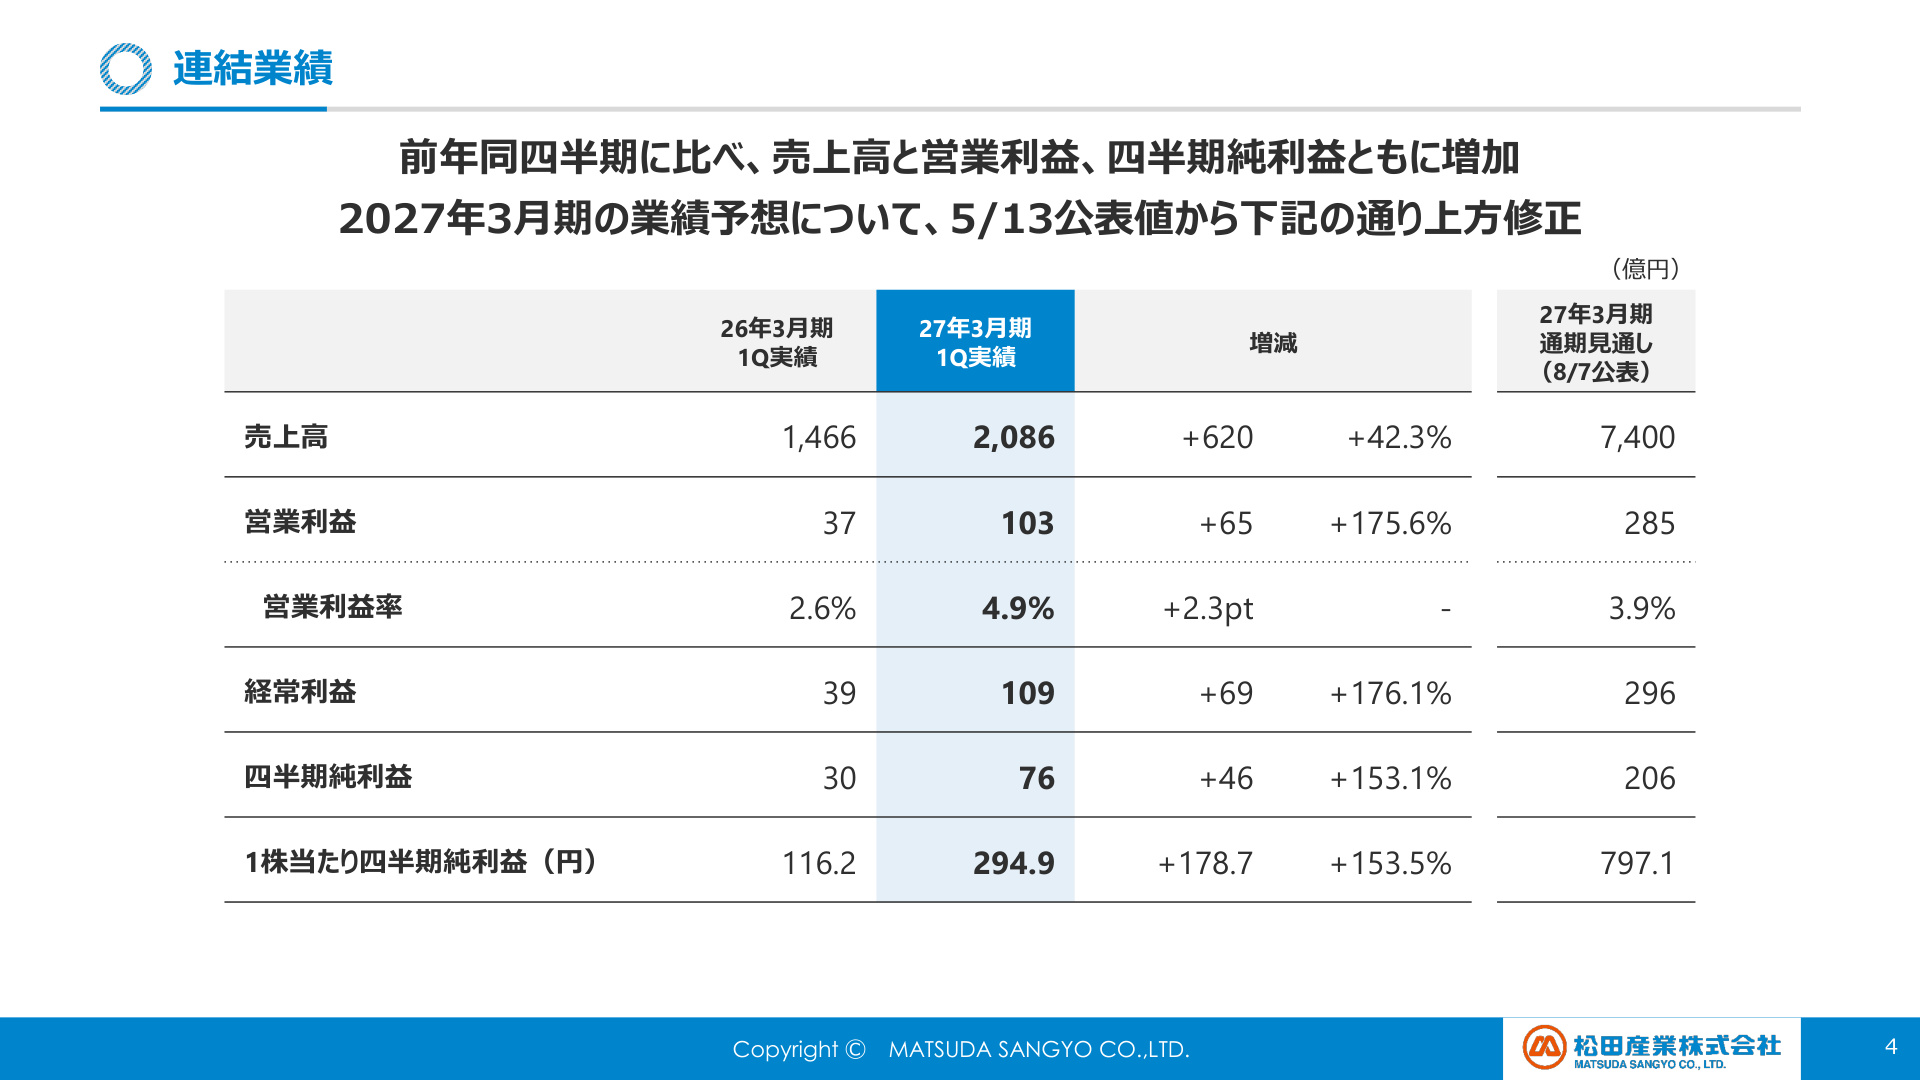
For the first quarter of the fiscal year ending March 2027, consolidated results were as follows: Net sales reached ¥208.6 billion (+42.3% YoY) , operating profit was ¥10.3 billion (+175.6% YoY) , ordinary profit was ¥10.9 billion (+176.1% YoY) , and profit attributable to owners of the parent was ¥7.6 billion (+153.1% YoY) . The company recorded rapid growth, significantly outperforming the same period last year across all top-line and profit metrics.
The slide below summarizes the consolidated financial results, illustrating the Q1 performance and the full-year outlook.
[Significance and Data Background of Slide 3]
This slide is critical because it allows for an immediate grasp of the remarkable profit growth in a single quarter and the details of the upward revision to the full-year forecast (announced on August 7) based on that performance. The operating profit margin expanded by 2.3 percentage points to 4.9% , up from 2.6% in the same period last year, demonstrating that profitability is improving at a pace that significantly exceeds the top-line growth (+42.3%). Regarding the full-year consolidated forecast, net sales have been revised upward to ¥740 billion , operating profit to ¥285 billion (3.9% operating margin), and net profit to ¥206 billion (earnings per share of ¥797.1). The Q1 operating profit of ¥10.3 billion represents a 36.1% progress rate against the new full-year plan, marking a strong start to the fiscal year.
2. Quarterly Trends in Consolidated Results: Accelerating Growth
Looking at the quarterly trends, net sales have followed an upward trajectory from Q1 of the previous fiscal year (¥146.6 billion), breaking through the ¥200 billion mark in the current Q1. Operating profit also maintained high levels in the previous Q3 (¥6.9 billion) and Q4 (¥7.5 billion), but reached ¥10.3 billion in the current Q1, achieving an exceptionally high level among recent quarterly results. This is attributed to a combination of the company's efforts to expand collection volumes in precious metal recycling, increased demand from customer industries—primarily semiconductors and electronic components—and the positive impact of rising precious metal market prices.
3. Segment Trends (1): Dramatic Growth in the Precious Metals Business
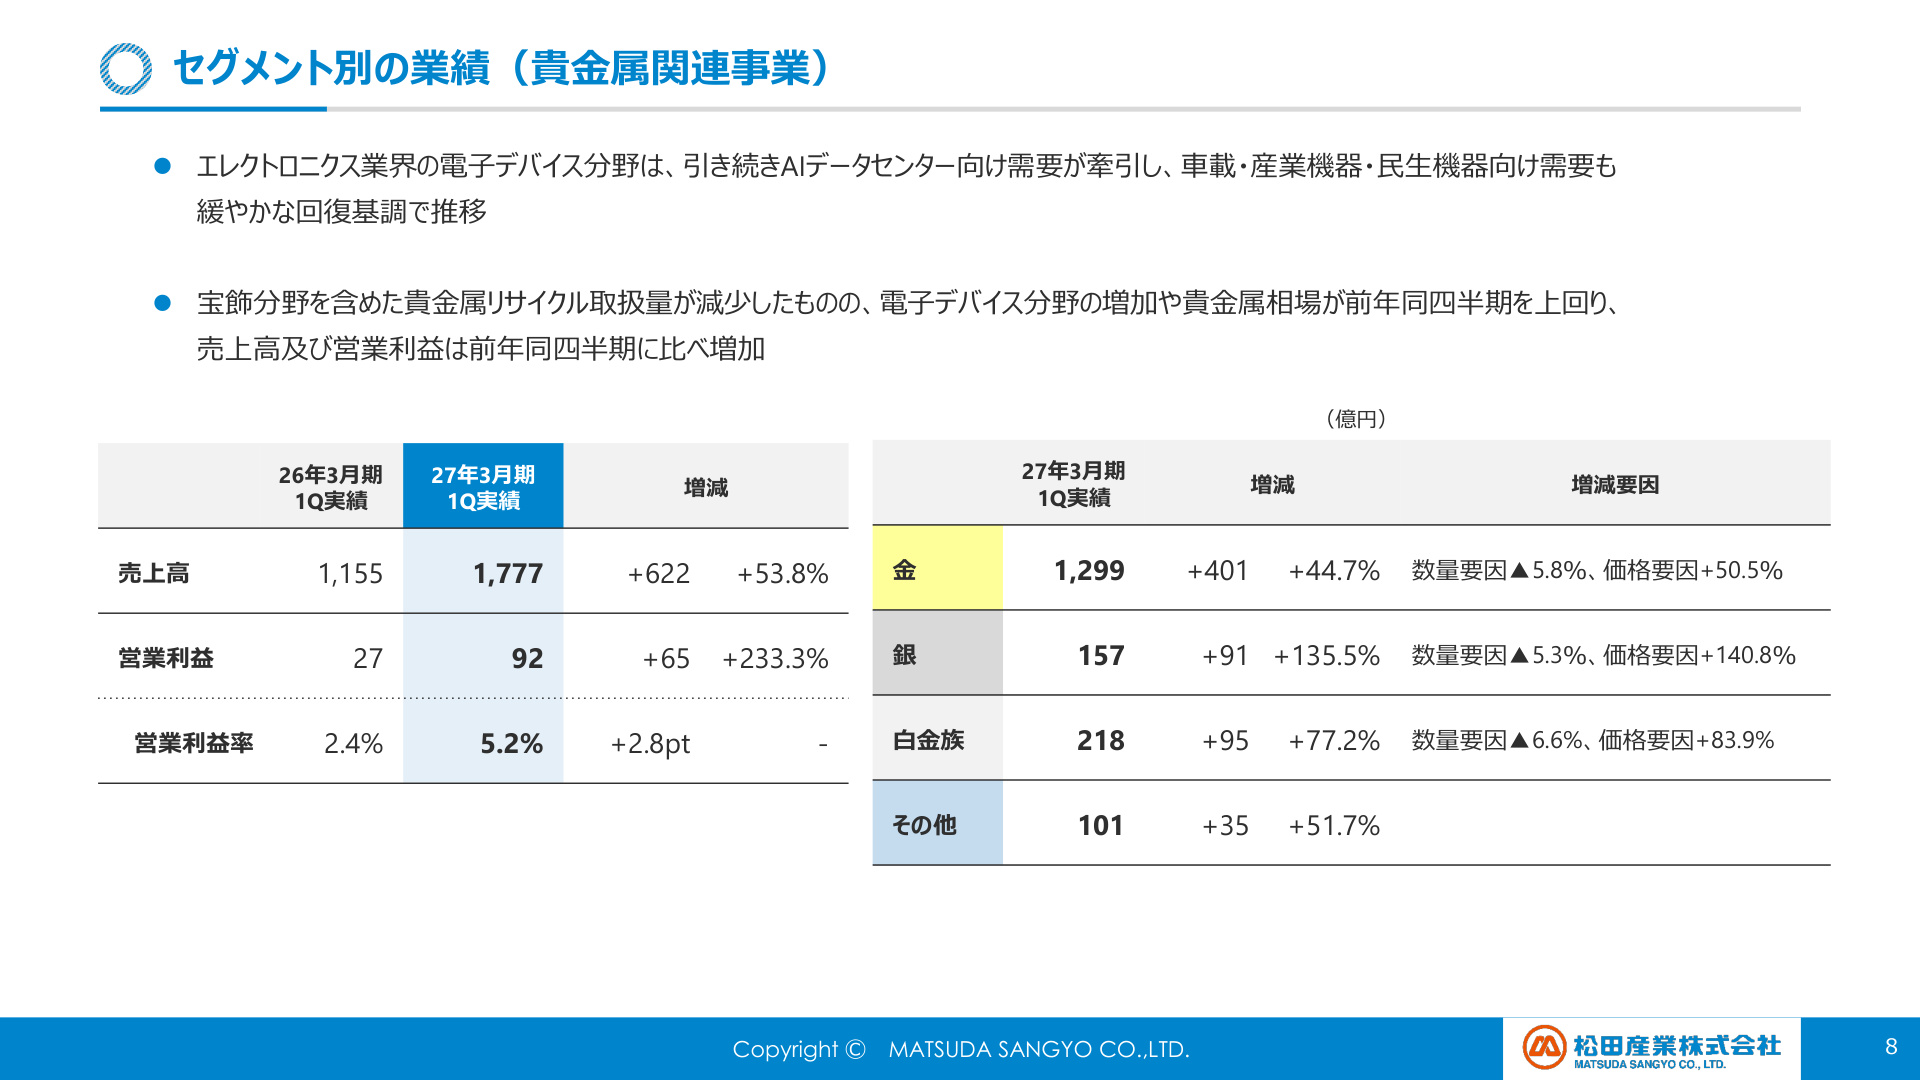
The Precious Metals business , the primary driver of Matsuda Sangyo's performance, was strongly led by robust demand for AI data centers in the electronics industry. Additionally, demand for automotive electronic devices, industrial equipment, and consumer electronics continued a gradual recovery, leading to a significant increase in the volume of precious metal recycling for electronic devices.
The slide below breaks down the sales and variance factors by item within the Precious Metals business.
[Significance and Data Background of Slide 7]
This slide is essential for accurately understanding the revenue structure of the company's growth engine. Segment sales reached ¥177.7 billion (+53.8% YoY) , operating profit was ¥9.2 billion (+233.3% YoY) , and the segment operating margin surged to 5.2% (from 2.4% in the same period last year). Furthermore, the breakdown by item (right table) shows that Gold reached ¥129.9 billion (+44.7% YoY), Silver ¥15.7 billion (+135.5% YoY), and Platinum Group Metals ¥21.8 billion (+77.2% YoY), achieving significant revenue growth across all categories. While the analysis of variance factors shows that actual handling volumes saw a slight decline due to factors such as a decrease in the jewelry sector (Gold -5.8%, Silver -5.3%, PGM -6.6%), the price factor contributed significantly, with +50.5% for Gold, +140.8% for Silver, and +83.9% for PGM . This clearly demonstrates the dual benefits of increased high-value-added recycling for electronic devices and rising market prices.
4. Segment Trends (2): Strengthening Profitability in the Food Business
In the Food business , the market environment remained challenging due to a growing trend toward frugality in domestic personal consumption amid rising prices. As a result, net sales decreased slightly to ¥30.9 billion (-0.5% YoY) . Marine products (¥11.4 billion, -5.0% YoY) and livestock products (¥12.7 billion, -4.1% YoY) were affected by a decline in sales volume (volume factor: Marine -8.4%, Livestock -11.1%). Conversely, agricultural products performed well, reaching ¥4.9 billion (+39.1% YoY) alongside a significant increase in volume (+30.6%). On the profit side, as a result of initiatives to appropriately pass on costs to sales prices and improve value-added offerings, operating profit improved to ¥1.0 billion (+8.3% YoY) , with an operating margin of 3.4% (+0.3pt) , demonstrating solid profit control.
5. Analysis of Operating Profit Variance: Decomposition of Volume and Price/Spread Effects
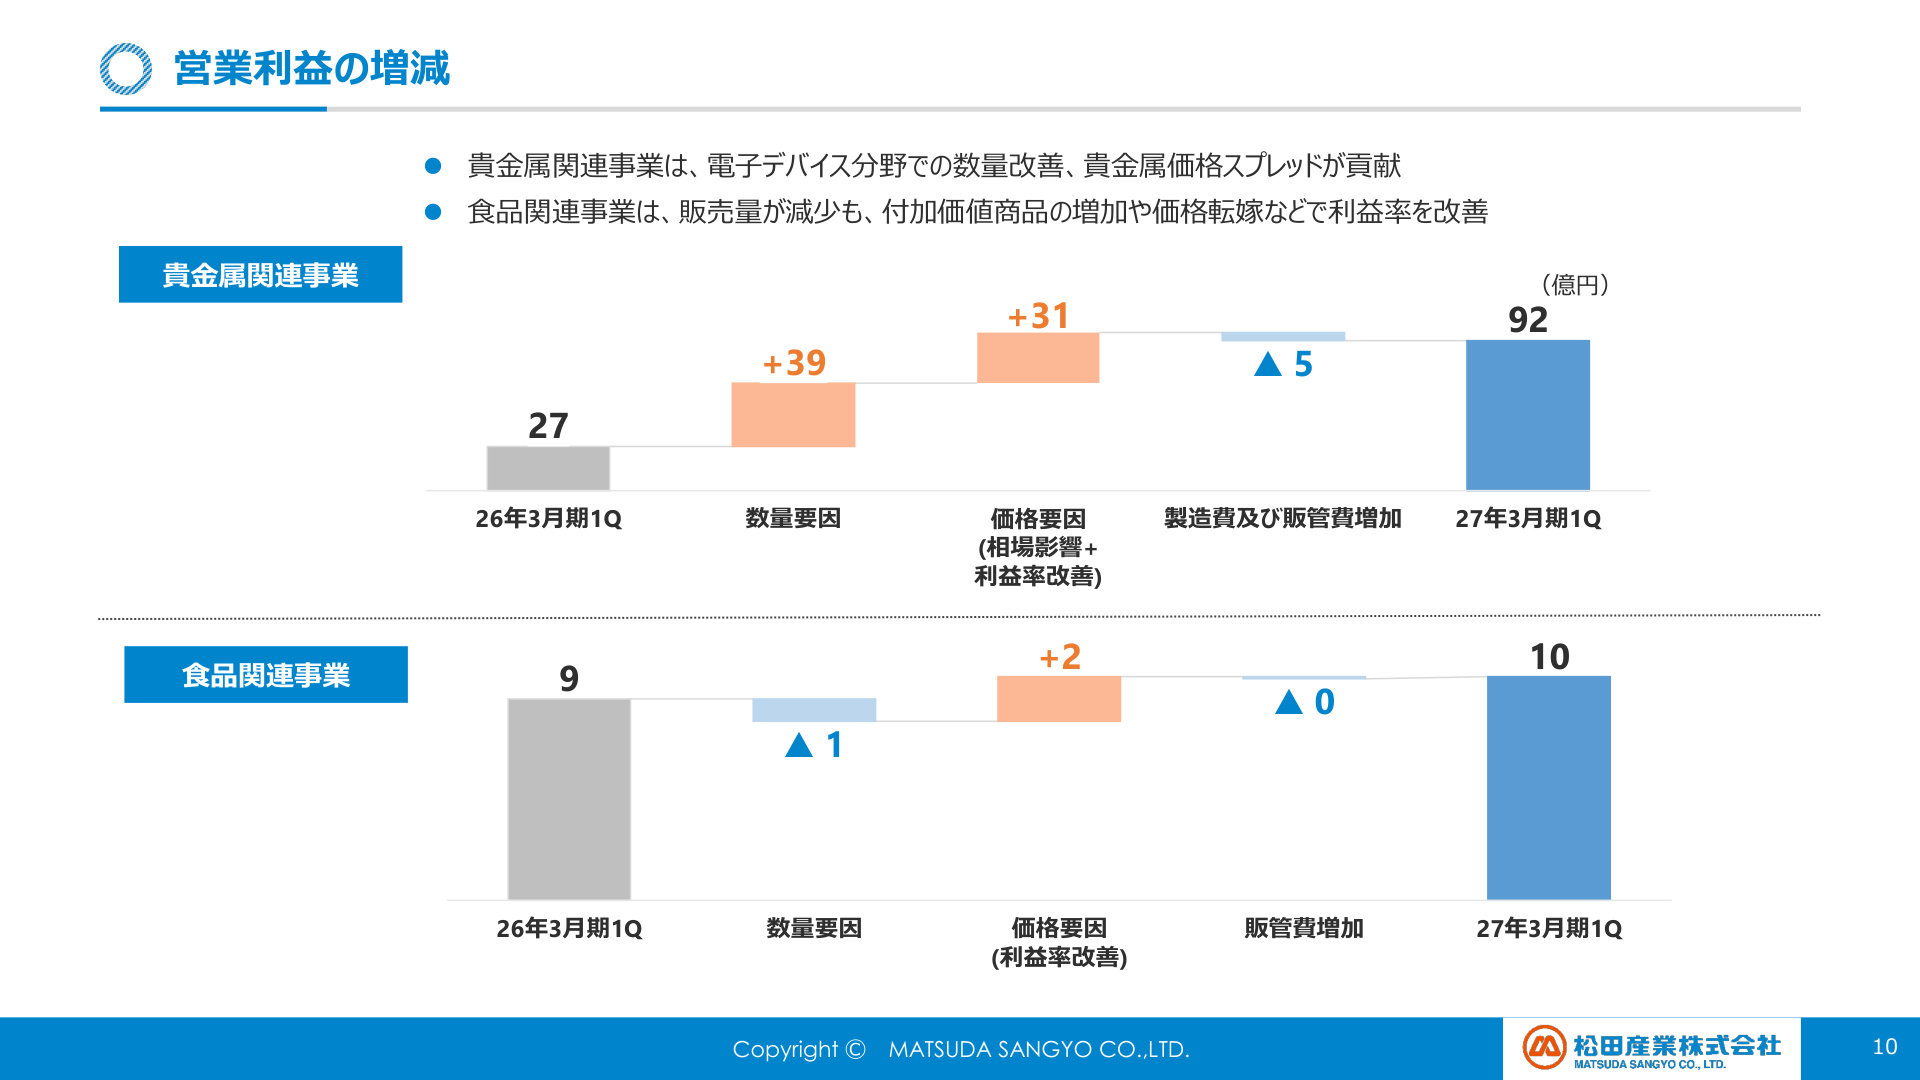
We analyze the details of the ¥6.5 billion increase in company-wide operating profit (from ¥3.7 billion to ¥10.3 billion) by business segment.
The slide below visualizes the factors behind the operating profit variance for each segment using a waterfall chart.
[Significance and Data Background of Slide 9]
This slide provides crucial data for uncovering the true quality and substance of profit growth. Looking at the breakdown for the core Precious Metals business (+¥6.5 billion profit increase) :
- Volume Factor : +¥3.9 billion (increase in handling volume in the electronic device sector, improved recovery efficiency, etc.)
- Price Factor (Market impact + margin improvement) : +¥3.1 billion (improvement in precious metal price spreads, rising market prices)
- Increase in manufacturing and SG&A expenses : -¥0.5 billion
It is clear that this was not merely a result of "high market prices." The volume factor (+¥3.9 billion) , supported by rapid demand expansion in areas like AI, was the largest positive contributor, proving that the company's business foundation is expanding robustly. Meanwhile, in the Food business, the volume decline (-¥0.1 billion) was offset by price pass-throughs and margin improvements (+¥0.2 billion), securing a profit increase of ¥0.1 billion.
6. Significant Improvement in Financial Position and Cash Flow
Along with the leap in performance, the health and efficiency of the balance sheet (B/S) and cash flow statement (C/F) have improved significantly.
[Consolidated Balance Sheet Status]
- Total Assets : ¥212.5 billion (-¥15.2 billion from the end of the previous fiscal year). Inventories decreased by ¥15.9 billion due to efficient management.
- Liabilities : ¥86.4 billion (-¥22.3 billion from the end of the previous fiscal year). In addition to a decrease in accounts payable and short-term borrowings, interest-bearing debt decreased by ¥6.8 billion to ¥45.6 billion .
- Net Assets : ¥126.0 billion (+¥7.0 billion from the end of the previous fiscal year). Retained earnings increased due to the accumulation of quarterly net profit.
- Equity Ratio : Increased significantly by 7.0 points to 59.0% from 52.0% at the end of the previous fiscal year, further enhancing the safety of the financial base.
[Consolidated Cash Flow Status]
- Operating Cash Flow : Showed strong generation capability at +¥7.4 billion (+¥7.3 billion YoY) , driven by a significant increase in quarterly net profit before taxes and the compression of inventories.
- Investing Cash Flow : Despite capital expenditures for new factory facilities, it reached +¥0.1 billion (+¥1.6 billion YoY) due to the sale of investment securities and the withdrawal of time deposits.
- Free Cash Flow : Secured a significant surplus of +¥7.5 billion (+¥8.9 billion YoY) .
- Financing Cash Flow : Recorded -¥8.0 billion as the company utilized generated cash to repay borrowings and pay dividends. As a result, the ending balance of cash and cash equivalents increased to ¥14.0 billion (+¥3.1 billion from the end of the previous fiscal year) , ensuring ample liquidity.
7. Future Outlook and Points to Watch
Matsuda Sangyo's Q1 FY2027 results were exceptionally strong, perfectly capturing both the booming electronics market centered on AI data center demand and high precious metal prices , leading to record-level profit growth.
Key points to watch moving forward include:
- Sustainability of electronics demand : The pace of recovery in electronic devices for automotive and consumer applications following the AI-driven surge.
- Precious metal market trends : Fluctuations in market prices for gold, silver, platinum, and palladium, and the resulting impact on spreads.
- Profit maintenance in the Food business : The success of ongoing price pass-throughs and value-added initiatives against rising raw material costs and consumer frugality.
Although the full-year target (operating profit of ¥285 billion) has been set higher due to the upward revision, given the high progress rate in Q1 and the solid financial foundation (59.0% equity ratio, reduction in interest-bearing debt), the company is expected to continue its steady progress in future business development.
This content is not intended as investment advice or a recommendation. Any opinions expressed are solely the personal views of each article.