

![[Q1 FY2027 Earnings] Harmonic Drive Systems Significantly Raises Full-Year Forecast Amid Sharp Demand Recovery and Surge in Orders](https://news-images.stock-club.net/market_news/images/6324/140120260807515115/slide_eyecatch_en_c743546a.webp)
[Q1 FY2027 Earnings] Harmonic Drive Systems Significantly Raises Full-Year Forecast Amid Sharp Demand Recovery and Surge in Orders

StockClub
Published: Aug 07, 2026, 11:32 AM
Sentiment Analysis
Harmonic Drive Systems Q1 FY2027 Earnings Deep Dive Report
Harmonic Drive Systems (Securities Code: 6324) reported its financial results for the first quarter of the fiscal year ending March 31, 2027 (April 1, 2026 – June 30, 2026), demonstrating a dramatic V-shaped recovery in performance driven by a resurgence in demand within the industrial robot and semiconductor manufacturing equipment markets. With quarterly orders surging both quarter-on-quarter and year-on-year, the company has already moved to significantly upwardly revise its full-year consolidated earnings forecast to reflect the speed and strength of this demand recovery.
This report provides a comprehensive deep dive into the earnings highlights, factors behind operating profit fluctuations, demand trends by application, the status of key group companies, and the revisions to the full-year earnings forecast as disclosed in the company's materials.
1. Q1 Consolidated Earnings Overview: Significant Recovery in Both Sales and Profits
The consolidated results for the first quarter of FY2027 showed strong performance, with both sales and profits at all levels significantly exceeding those of the same period last year.
- Net Sales : 16,681 million yen ( +23.6% YoY)
- Operating Profit : 1,840 million yen (compared to 122 million yen in the same period last year, a roughly 15-fold increase )
- Ordinary Profit : 1,719 million yen (compared to 131 million yen in the same period last year, a roughly 13-fold increase )
- Quarterly Net Profit Attributable to Owners of Parent : 1,274 million yen (a turnaround to profit from a loss of 38 million yen in the same period last year)
- Earnings Per Share (EPS) : 13.46 yen (compared to -0.40 yen in the same period last year)
In the same period last year (Q1 FY2026), the company faced a challenging environment where the operating profit margin fell to 0.9% due to customer inventory adjustments and a global stagnation in capital expenditure. In this quarter, however, the operating profit margin improved rapidly to 11.0% alongside the growth in sales. Furthermore, capital expenditure for the quarter was contained at 573 million yen (-77.3% YoY), with the improvement in profit margins supported by increased utilization rates of existing assets rather than excessive capital investment.
2. Analysis of Factors Behind the Year-on-Year Change in Consolidated Operating Profit
There are clear structural factors behind the 1,718 million yen increase in consolidated operating profit, which rose from 122 million yen to 1,840 million yen in the first quarter.
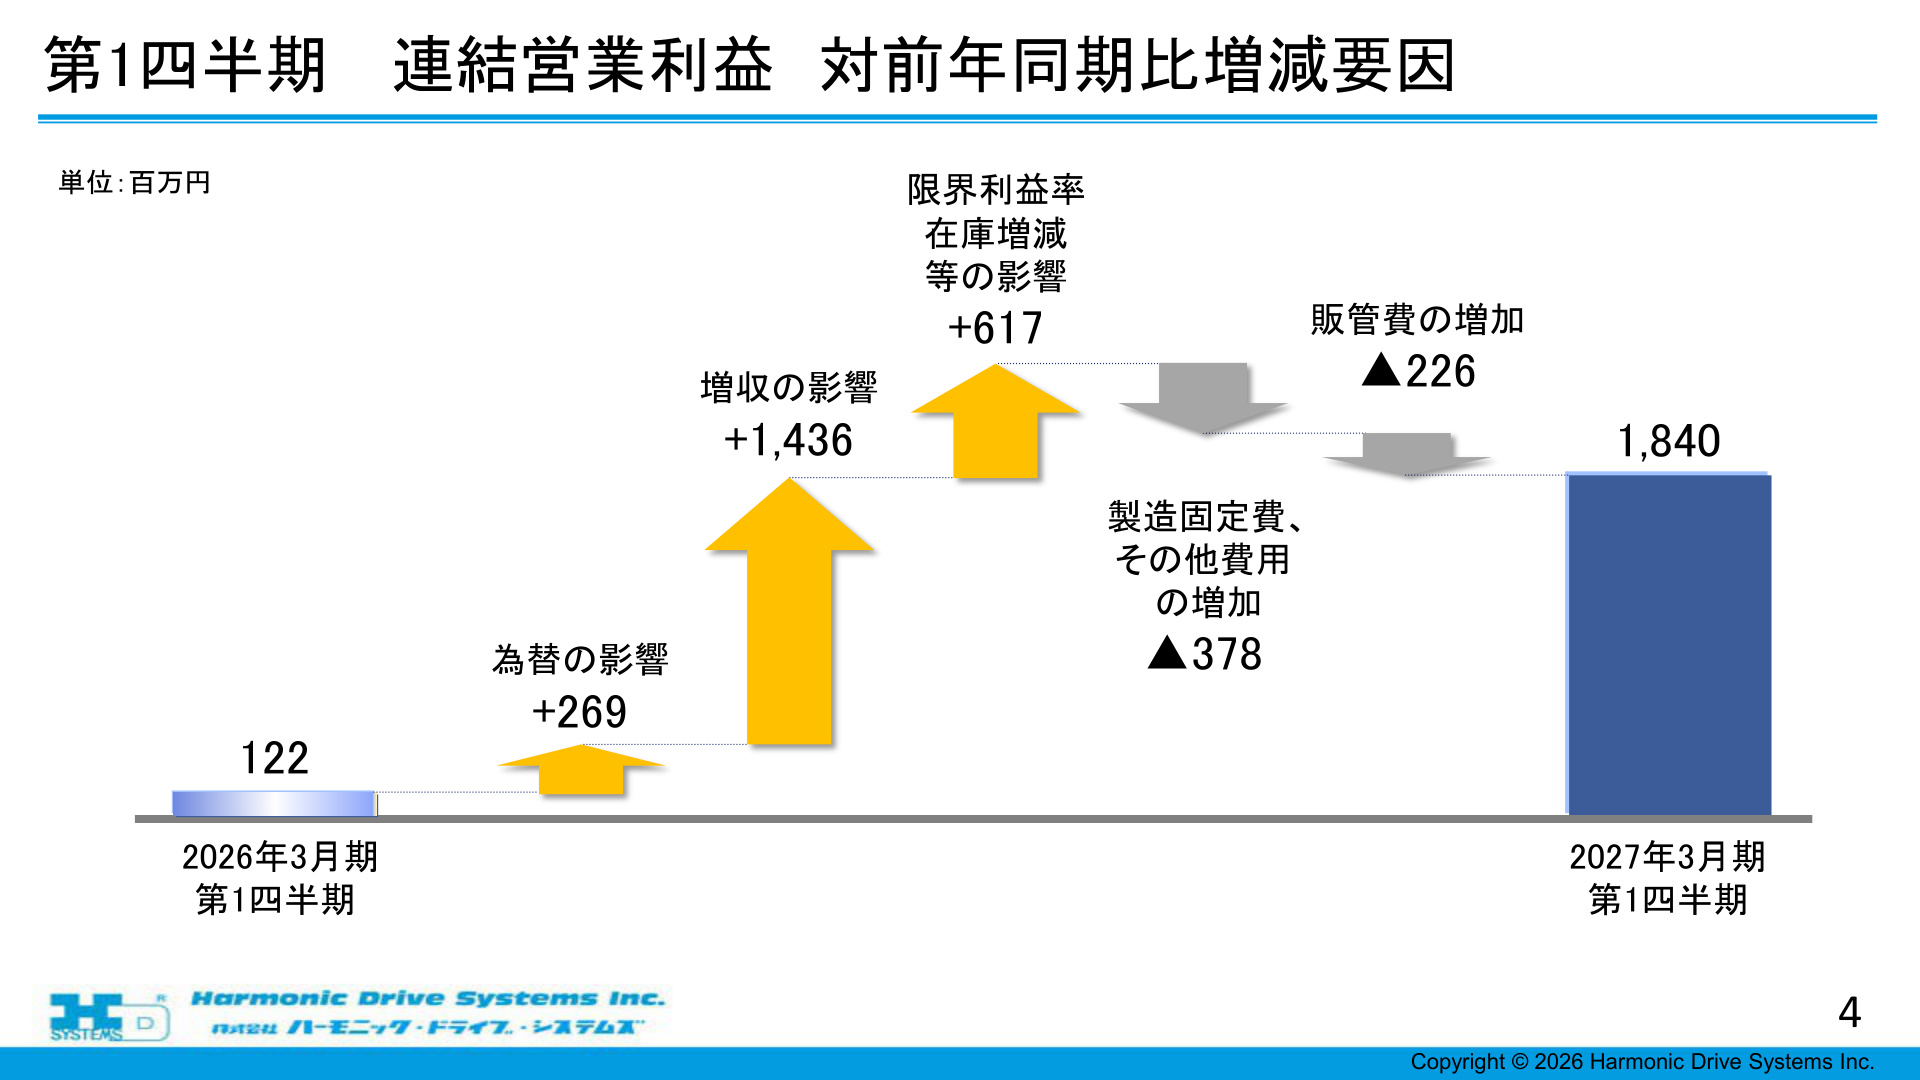
[Slide 4 Commentary: Factors Supporting the Sharp Expansion in Operating Profit]
The slide above is a waterfall chart visually breaking down the factors contributing to the change in operating profit from the same period last year. This slide is critical because it illustrates a structure where cost-push pressures, such as increases in manufacturing fixed costs and SG&A expenses, are completely absorbed and surpassed by overwhelming "sales growth effects" and "improvements in marginal profit ratios and inventory valuation."
Specifically, it is composed of the following factors:
- Foreign Exchange Impact (+269 million yen) : Positive translation effect due to the depreciation of the yen.
- Sales Growth Impact (+1,436 million yen) : Direct profit boost resulting from a 3.18 billion yen increase in net sales from 13,496 million yen to 16,681 million yen.
- Impact of Marginal Profit Ratio/Inventory Changes (+617 million yen) : Improvement in gross profit margins due to higher factory utilization, better product mix, and appropriate inventory valuation.
- Increase in Manufacturing Fixed Costs and Other Expenses (-378 million yen) : Rise in various manufacturing expenses associated with increased operations.
- Increase in SG&A Expenses (-226 million yen) : Increase in personnel costs and expenses related to the resumption of sales activities.
As a result, the increase in fixed costs and SG&A expenses (totaling -604 million yen) was significantly outweighed by the gains from sales growth, improved marginal profit ratios, and foreign exchange (totaling +2,322 million yen), proving a rapid return to a high-profitability structure .
3. Trends in Sales and Orders by Application: Orders Surge to Over 24.1 Billion Yen
Analyzing sales and orders by application clearly reveals which markets are driving the company's growth.
Sales by Application
Looking at the consolidated net sales (16,681 million yen) for Q1 FY2027 by application, the primary pillar, industrial robots, accounted for 4,920 million yen (approximately 29.5% of consolidated sales), showing a steady recovery from the same period last year (4,126 million yen). Furthermore, semiconductor manufacturing equipment expanded significantly to 3,102 million yen (+63.6% YoY), making these two sectors the primary drivers of performance. Automotive (2,020 million yen), machine tools (1,886 million yen), and AI robots (1,510 million yen) also remained solid.
Surge in Orders by Application
For investors, the trend in "orders received" serves as a much stronger leading indicator than sales.
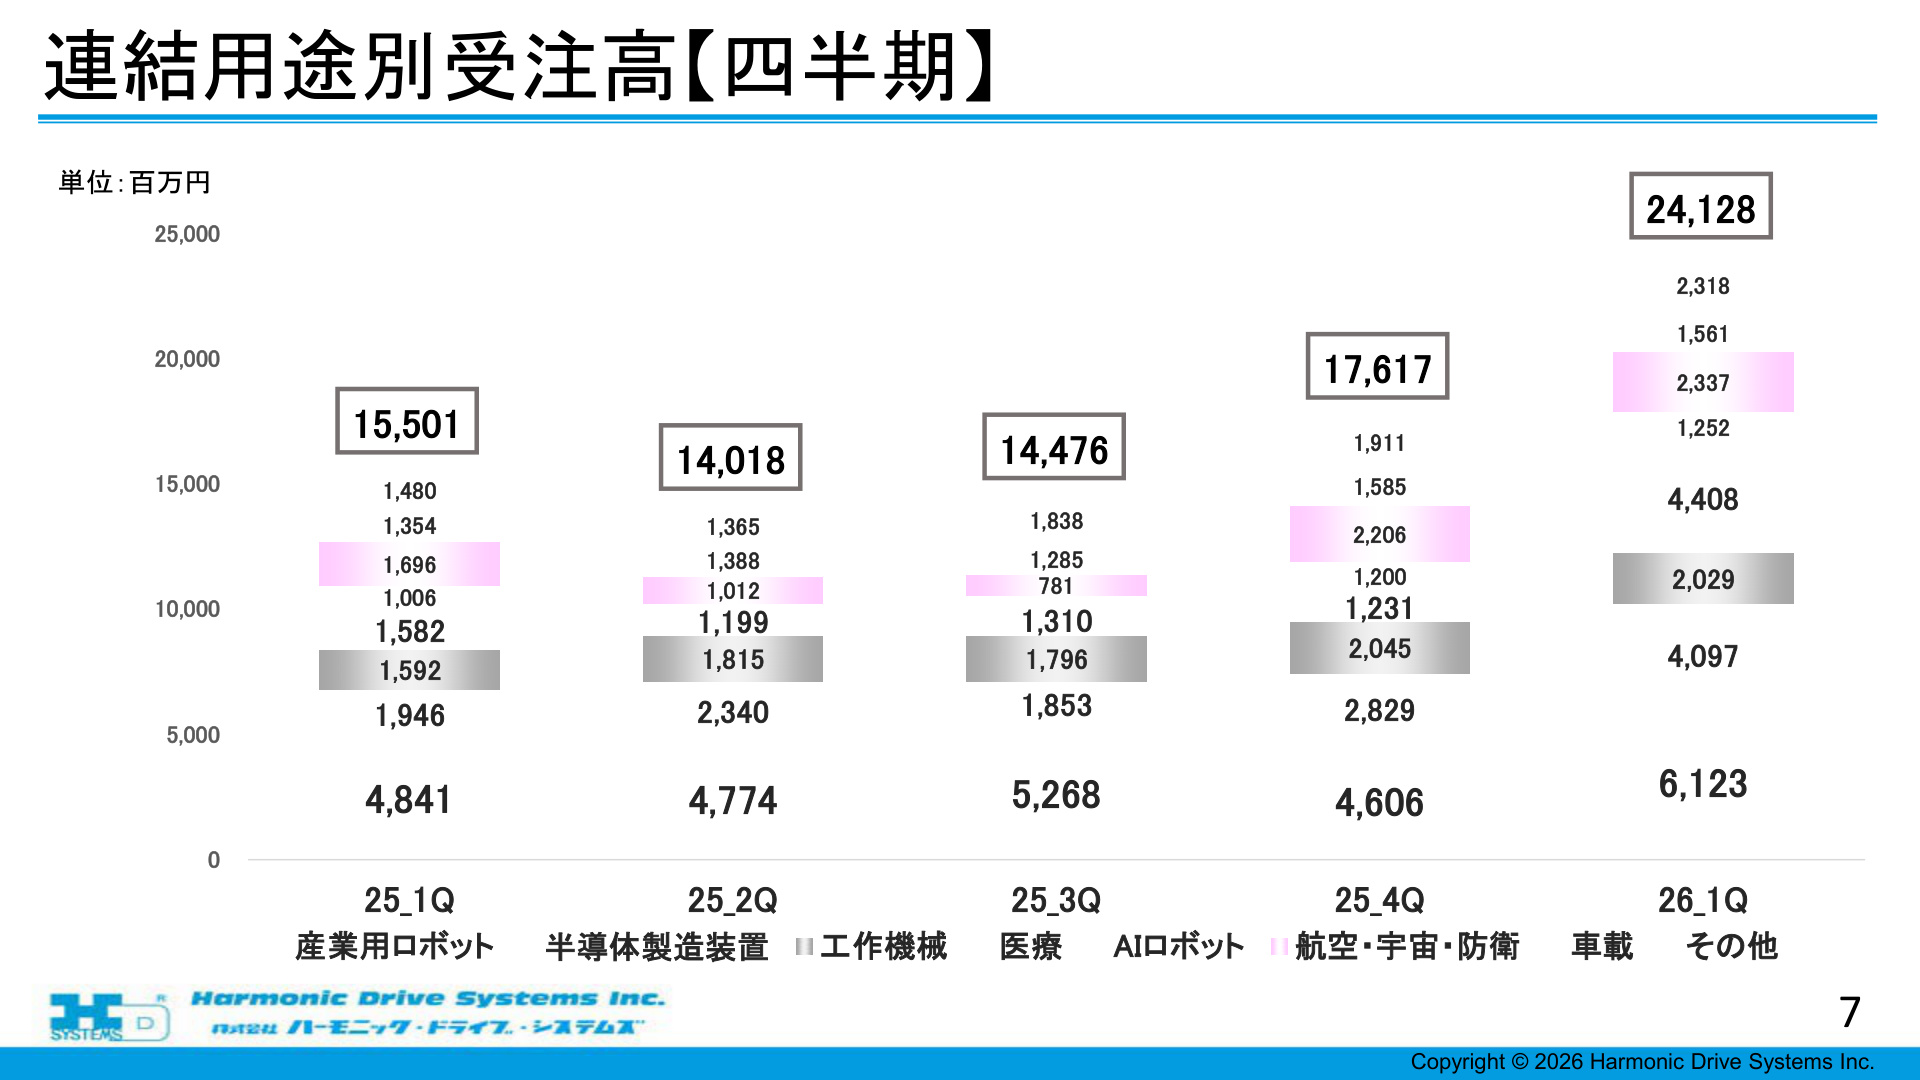
[Slide 7 Commentary: What the Order Surge Signifies for the Future Business Environment]
Slide 7 is one of the most important slides to watch, showing the trend in quarterly consolidated orders. While there was a gradual recovery trend from Q1 FY2025 (15,501 million yen) to Q4 (17,617 million yen), the company recorded an overwhelming order volume of 24,128 million yen in Q1 FY2027 (26_1Q).
This represents a remarkable growth rate of +37.0% quarter-on-quarter (vs. 25_4Q) and +55.7% year-on-year (vs. 25_1Q) . The breakdown of orders by application is as follows:
- Industrial Robots : 6,123 million yen (sharp increase from 4,606 million yen in the previous quarter)
- Medical : 4,408 million yen (a sharp jump from 1,200 million yen in the previous quarter)
- Semiconductor Manufacturing Equipment : 4,097 million yen (maintaining a high level)
- Aerospace & Defense : 2,337 million yen
- Machine Tools : 2,029 million yen
- Automotive : 1,561 million yen
- AI Robots : 1,252 million yen
In addition to the resurgence in demand for industrial robots, large-scale order acquisitions in medical and semiconductor applications have boosted the overall figures, ensuring a very solid accumulation of order backlogs for future shipments and revenue recognition.
4. Performance of Key Group Companies: European and Domestic Subsidiaries Lead the Way
A look at the Q1 performance of each group company reflects the differences in domestic and international market environments and the strengths of each subsidiary.
- Harmonic Drive SE (Germany) : Net sales of 4,594 million yen ( +26.4% YoY), operating profit of 408 million yen ( +159.8% YoY). Achieved significant growth in sales and profit following the recovery in demand for speed reducers in the European region.
- Harmonic Precision Co., Ltd. : Net sales of 1,203 million yen ( +65.3% YoY), operating profit of 212 million yen ( +487.4% YoY). Profits expanded explosively alongside the growth in demand for precision cutting and processing parts in Japan.
- US Subsidiary (HD Systems) : Net sales of 3,043 million yen ( +12.5% YoY), operating profit of 174 million yen (turnaround from a loss in the same period last year). Contributed by the recovery in the US market.
- Harmonic Aidy Co., Ltd. : Net sales of 666 million yen ( +29.3% YoY), operating profit of 59 million yen (turnaround to profit).
- Harmonic Drive (Shanghai) Trading Co., Ltd. (China) : Net sales of 1,013 million yen ( -17.9% YoY), operating profit of 108 million yen ( -33.2% YoY). The Chinese market continues to experience localized adjustments, showing a slightly softer trend compared to other regions.
Thus, the structure is one where major regions excluding China (Europe, US, and Japan) are strongly supporting the group's overall performance.
5. Significant Upward Revision of Full-Year Consolidated Earnings Forecast and Its Background
Following the sharp jump in orders and the smooth start to the fiscal year in Q1, the company announced an upward revision to its full-year consolidated and non-consolidated earnings forecasts for FY2027 on August 7, 2026.
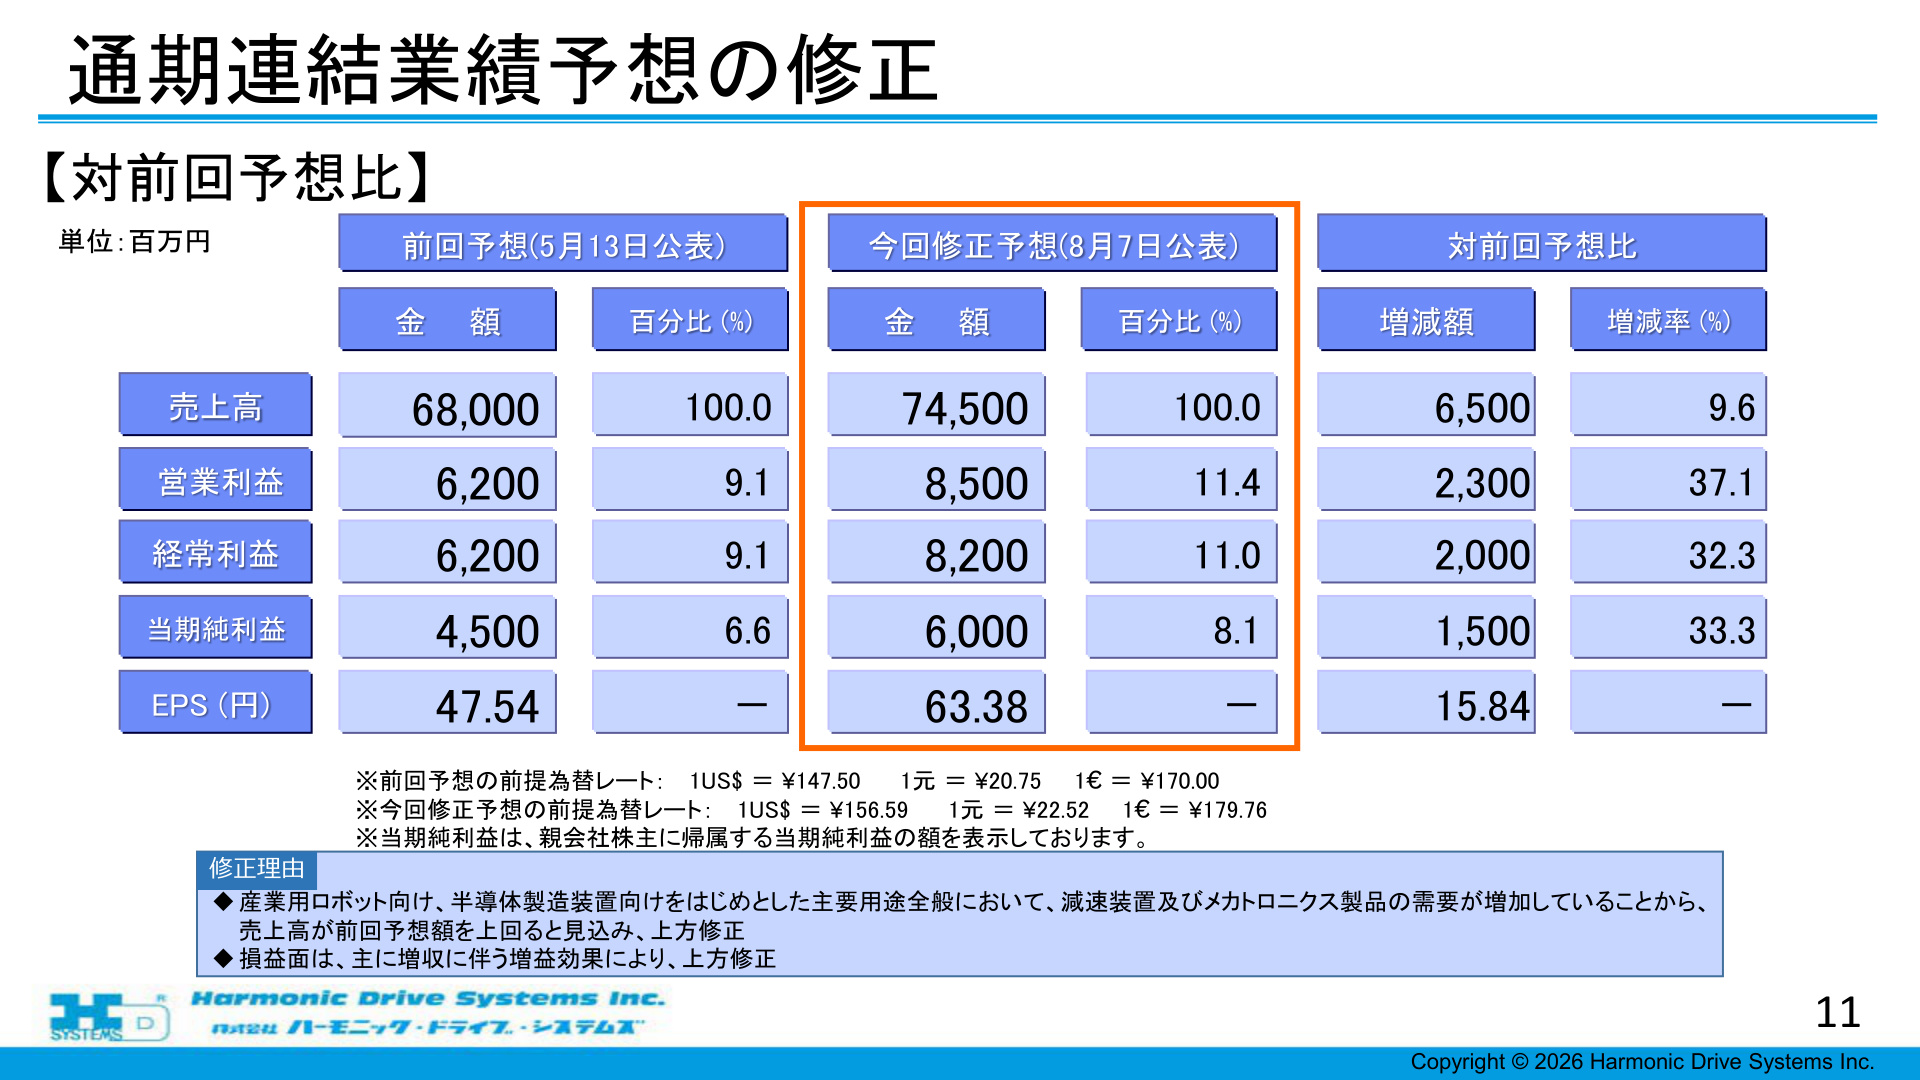
[Slide 11 Commentary: Details of Full-Year Forecast Revision and Outlook]
Slide 11 is a key slide showing the comparison between the previous forecast (announced May 13, 2026) and the revised forecast (announced August 7, 2026).
Revisions to Full-Year Consolidated Earnings Forecast (vs. Previous Forecast)
- Net Sales : 68,000 million yen ➔ 74,500 million yen ( +6,500 million yen / +9.6% )
- Operating Profit : 6,200 million yen ➔ 8,500 million yen ( +2,300 million yen / +37.1% )
- Ordinary Profit : 6,200 million yen ➔ 8,200 million yen ( +2,000 million yen / +32.3% )
- Net Profit : 4,500 million yen ➔ 6,000 million yen ( +1,500 million yen / +33.3% )
- EPS : 47.54 yen ➔ 63.38 yen
Assumed exchange rates have also been revised to reflect current market conditions: 1 USD from 147.50 yen to 156.59 yen , 1 CNY from 20.75 yen to 22.52 yen , and 1 EUR from 170.00 yen to 179.76 yen .
Reasons for Revision and Growth Scenario for the Full Year
The primary reason for the revision is that demand for strain wave gear reducers and mechatronics products is increasing at a pace exceeding expectations across all major applications, including industrial robots and semiconductor manufacturing equipment. As sales increase, the profit-boosting effect of higher operating rates will be significant, leading to a major upward revision of over 30% for both operating and final profits.
Comparing the full-year outlook with the previous fiscal year's results (FY2026: Net sales of 59,557 million yen, operating profit of 2,567 million yen), the company is planning for extremely high growth, with net sales up +25.1% YoY and operating profit up +231.0% YoY (approx. 3.3 times) .
6. Financial Position and Equity Ratio
Even as performance expands rapidly, the company maintains a high level of balance sheet stability.
- Total Assets : 113,208 million yen as of the end of June 2026 (+1,808 million yen from the end of March 2026)
- Cash and deposits/securities: 22,164 million yen
- Inventories: 13,391 million yen
- Net Assets/Equity : 81,386 million yen (+996 million yen from the end of March 2026)
- Equity Ratio : 71.9% (virtually unchanged from 72.2% at the end of March 2026)
With an equity ratio exceeding 70% and sufficient liquidity, the company has established a solid financial foundation to smoothly execute future production capacity expansion and R&D investments (full-year plan: 6,600 million yen in capital expenditure, 4,000 million yen in R&D expenses).
7. Summary and Future Points to Watch
Harmonic Drive Systems' Q1 FY2027 earnings report demonstrates a vivid demand recovery and V-shaped performance rebound that completely wipes away the stagnation of the past few quarters.
- Simultaneous Jump in Performance and Orders : Not only did the company achieve significant profit growth in Q1, but the order volume exceeding 24.1 billion yen has increased the certainty of achieving this fiscal year's targets.
- Resumption of Demand in Key Markets : The company is benefiting from multiple tailwinds, including the resumption of automation investment in industrial robots, the recovery of the semiconductor manufacturing equipment market, and increased demand in medical and defense applications.
- Rapid Improvement in Profitability : Due to the expansion of marginal profit accompanying sales growth, the operating profit margin has returned to the 11% range, with a high level of profitability (11.4% forecast) expected for the full year.
While it is necessary to continue monitoring changes in the market environment and foreign exchange trends, this earnings report confirms that demand for the company's world-class precision speed reducer technology is strongly re-expanding globally, and that the company is progressing in line with its mid-to-long-term growth story.
This content is not intended as investment advice or a recommendation. Any opinions expressed are solely the personal views of each article.