

SMC (6273) Q1 FY2027 Earnings Deep Dive: Semiconductor Demand Surge and Global Strategy Overview

Sentiment Analysis
SMC Q1 FY2027 Earnings Deep Dive Report
1. Earnings Highlights and Overview
SMC’s performance for the first quarter of the fiscal year ending March 2027 (Q1 FY26) showed significant growth in both revenue and profit. Net sales reached ¥270.9 billion (+35.4% YoY), operating profit hit ¥73.9 billion (+66.4% YoY), ordinary profit was ¥91.7 billion (+86.9% YoY), and net income attributable to owners of the parent company stood at ¥67.8 billion (+95.9% YoY).
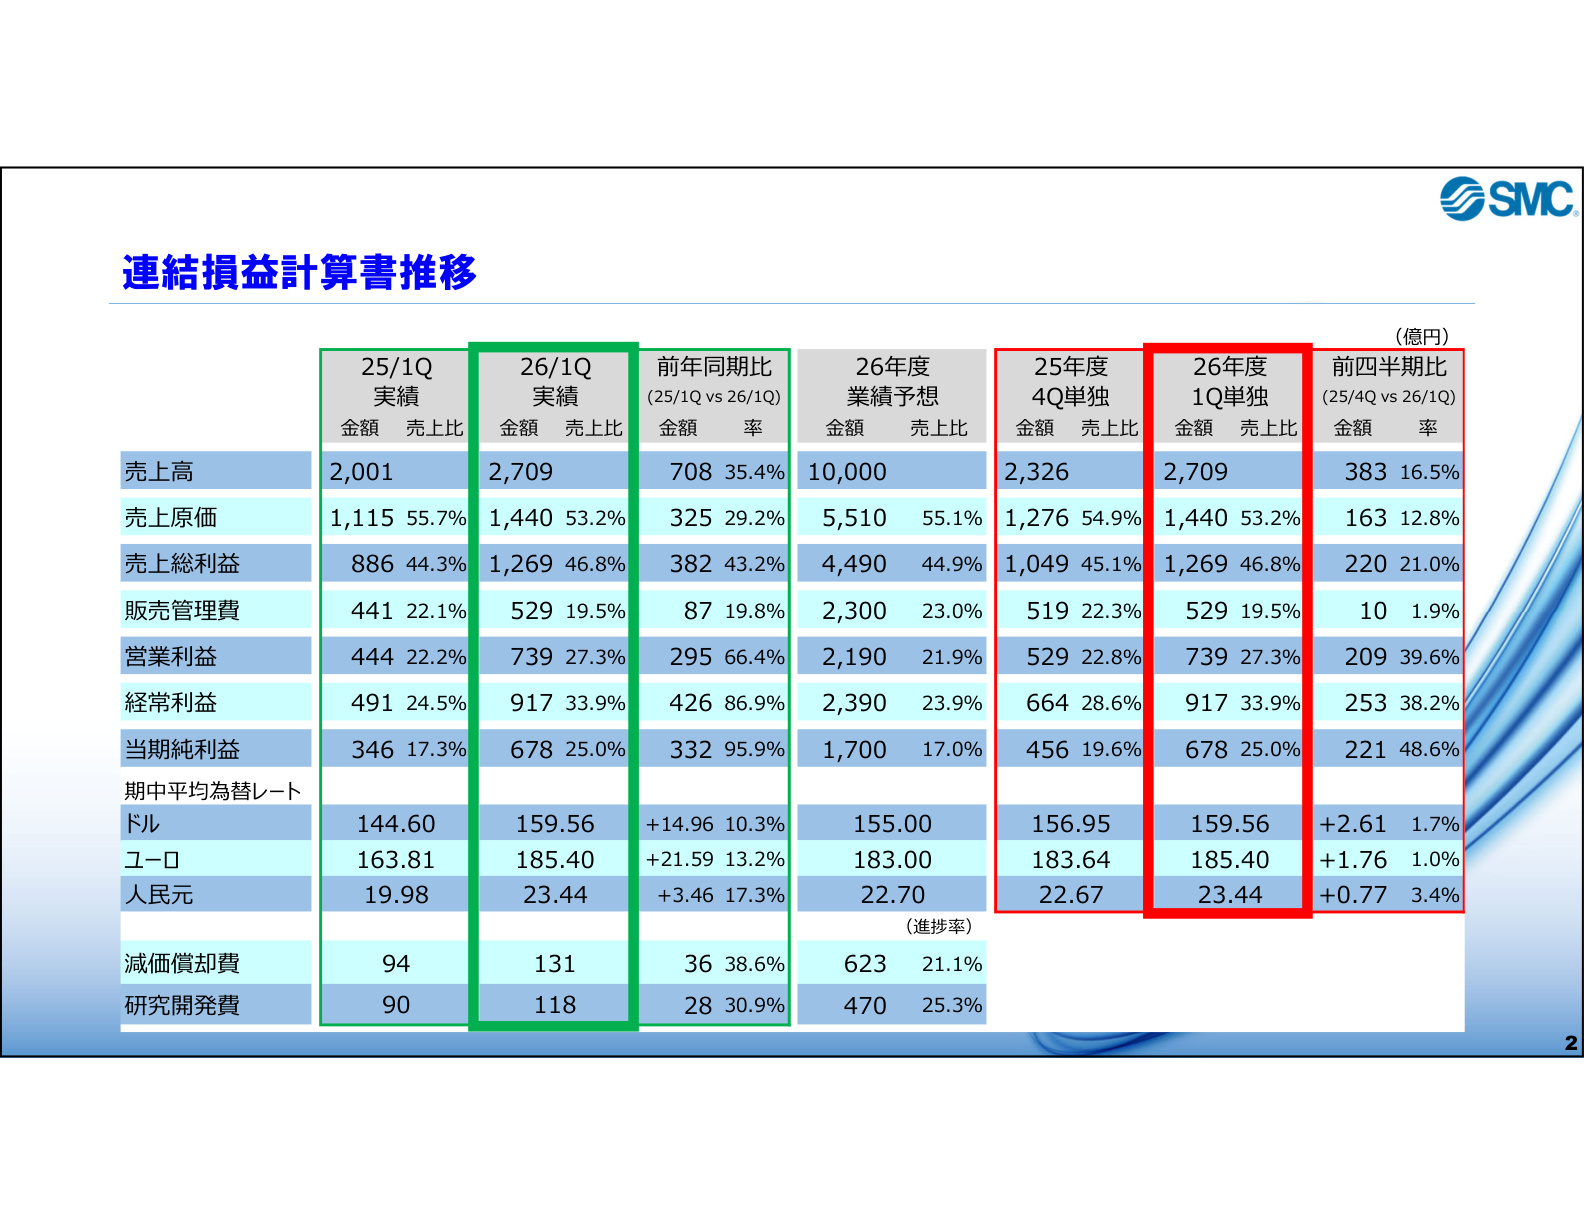
Significance and Context of Slide 1
The slide above (Consolidated Statement of Income Trends) is the most critical data for understanding these results, as it comprehensively illustrates the company's recent rapid expansion in profitability and structural financial changes. Of particular note is the operating profit margin, which improved significantly by 5.1 percentage points , rising from 22.2% in the same period last year to 27.3% . This demonstrates a strong operating leverage effect, where the growth in operating profit (+66.4%) significantly outpaced the growth in net sales (+35.4%). Furthermore, the average exchange rates shifted toward a weaker yen: the US dollar rose from 144.60 to 159.56 (+10.3%), the Euro from 163.81 to 185.40 (+13.2%), and the Chinese Yuan from 19.98 to 23.44 (+17.3%). Both the tailwind from currency fluctuations and a substantial increase in actual sales volume have powerfully driven performance. Depreciation (¥13.1 billion) and R&D expenses (¥11.8 billion) also increased compared to the previous year, highlighting the company's ability to maintain high profitability while continuing to invest in future growth.
2. Analysis of Revenue and Operating Profit Drivers
A detailed analysis of the revenue increase of +¥70.8 billion reveals that the sales volume effect was the primary driver, contributing +¥44.8 billion (+22.3% YoY). By region, the volume increases were: Greater China (+¥22.6 billion, +37%), Other Asia (+¥10.8 billion, +35%), Japan (+¥7.2 billion, +19%), Europe (+¥2.3 billion, +7%), and North America (+¥1.3 billion, +5%). The surge in automation demand across Asia is particularly notable. The positive impact of exchange rate fluctuations on revenue was +¥25.7 billion .
Regarding the +¥29.5 billion increase in operating profit, the breakdown is as follows: sales volume growth contributed +¥19.8 billion , and exchange rate fluctuations contributed +¥11.9 billion (¥7.9 billion from transaction factors and ¥4.0 billion from overseas subsidiary P/L translation). Additionally, a reduction in inventory valuation losses provided a +¥2.6 billion boost, and cost reductions in processing and materials—partially due to US tariff refunds—also contributed. Selling, General, and Administrative (SG&A) expenses increased by a total of -¥4.3 billion due to higher personnel costs (-¥1.0 billion), logistics costs (-¥1.0 billion), and R&D expenses (-¥0.7 billion), but these were easily absorbed by the revenue growth.
3. Analysis of Revenue Structure by Region and Industry
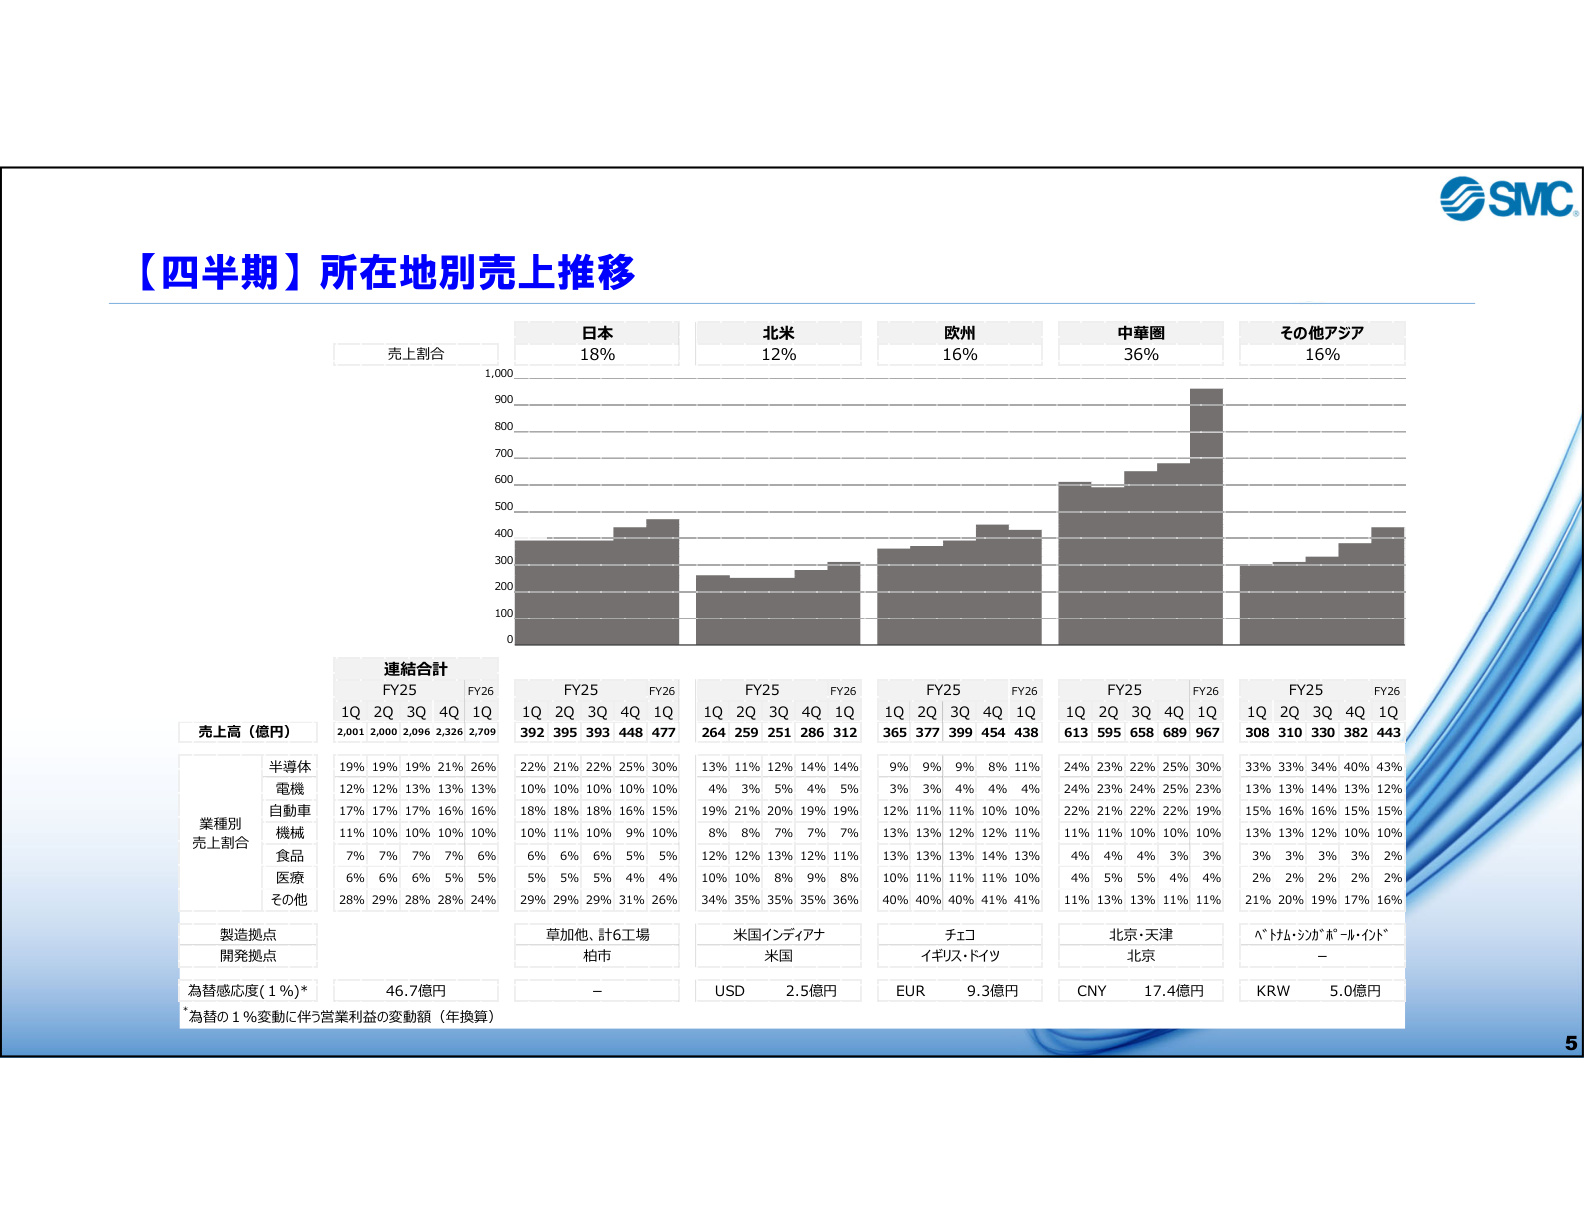
Significance and Context of Slide 4
This slide (Quarterly Sales by Location) is decisive as it visualizes the company's global business portfolio and the trends in target markets that serve as the engine for growth. In terms of regional sales composition, Greater China is the largest market, accounting for 36% of total sales, followed by Japan (18%) , Europe (16%) , North America (12%) , and Other Asia (16%) . Even more critical is the trend in sales composition by industry shown in the lower section. The company's sales ratio to the semiconductor industry has surged from 19% in the same period last year to 26% . Notably, the industry composition varies by region: in Greater China, the semiconductor-related ratio has reached 30% , and in Other Asia, it has hit 43% . As global AI demand expands and investment in advanced semiconductors accelerates, it is clear that SMC—the leading company in pneumatic and automation equipment—is being widely adopted by Asian manufacturers, packaging and testing facilities, and equipment makers.
4. Order Trends and Leading Indicators
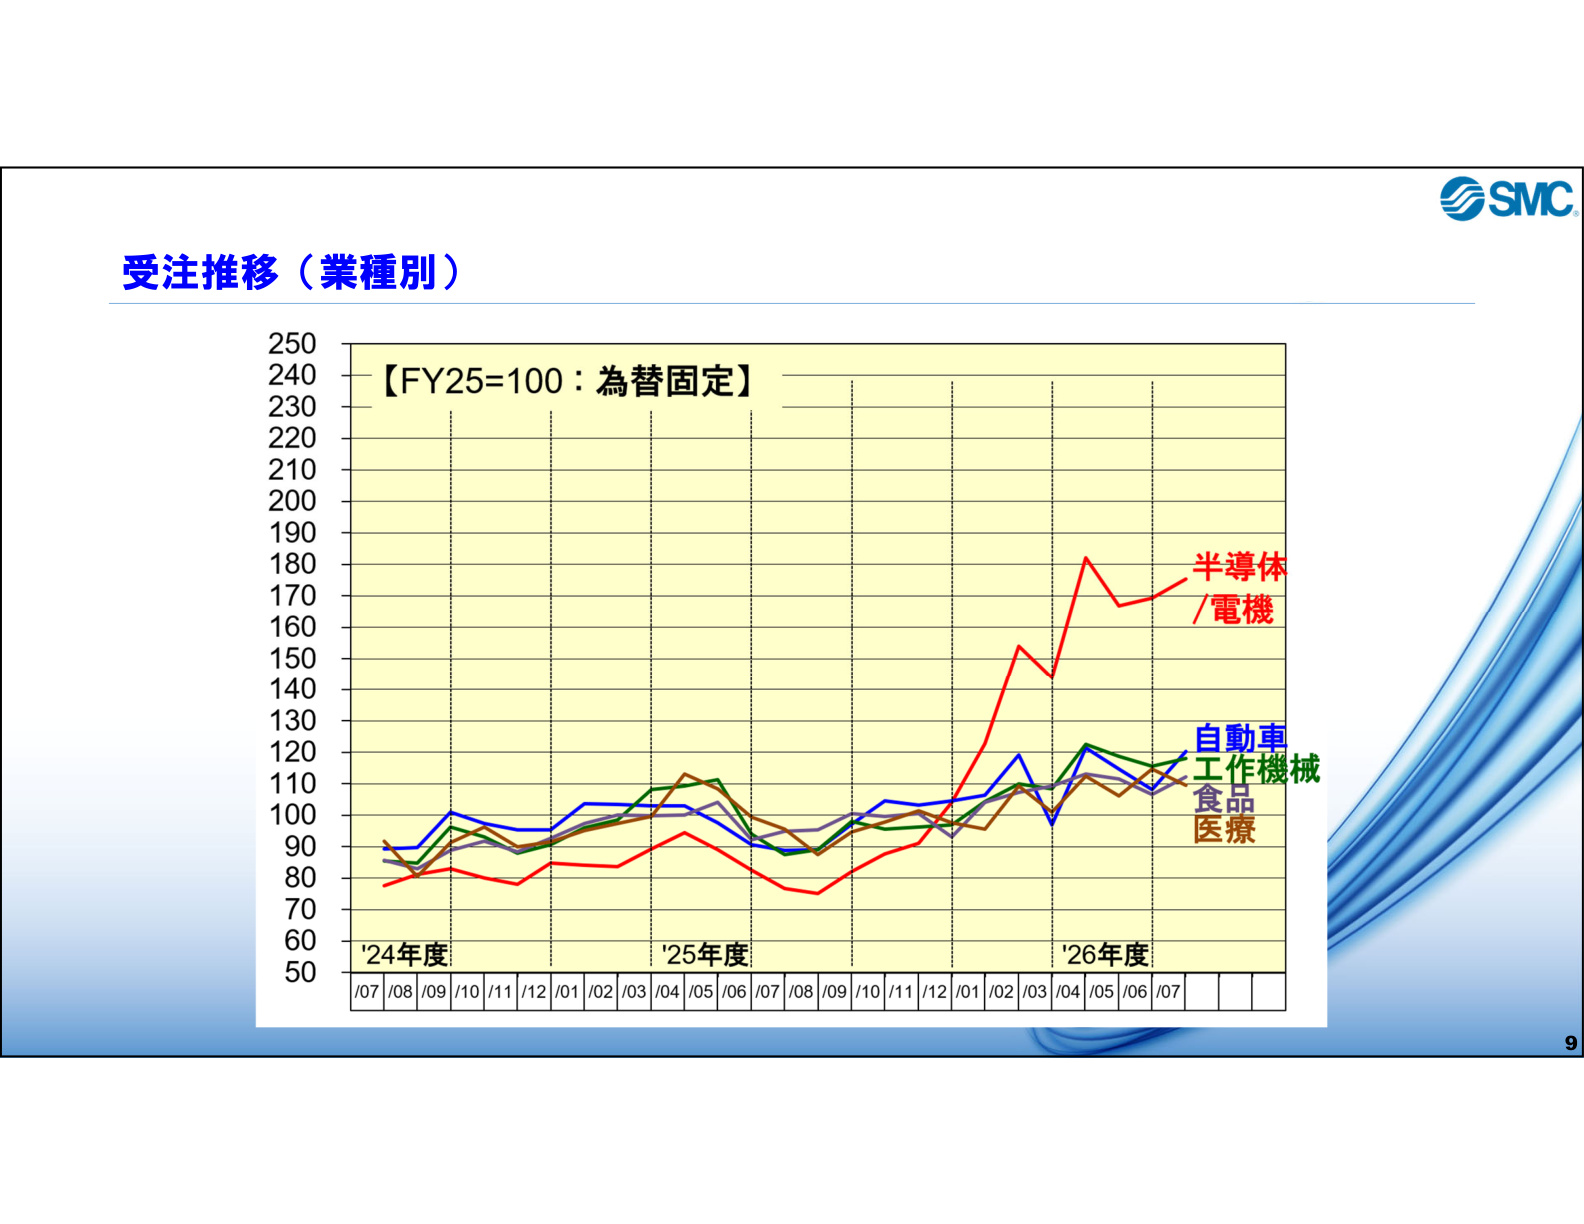
Significance and Context of Slide 8
This slide (Order Trends by Industry) graphs the order trends that serve as a leading indicator for actual performance, making it highly valuable for forecasting future results. As the graph shows, the order index for the Semiconductor/Electronics sector (calculated with fixed exchange rates, FY25=100) surged from the 80–90 level in FY2024 to a vertical climb, reaching an exceptionally high level of over 170–180 recently. While other sectors such as automotive, machine tools, food, and medical remain in the 110–120 range, the breakout in the semiconductor/electronics sector is striking, clearly proving that semiconductor-related capital investment is the primary driver of the company's demand recovery. In the most recent monthly data (July 2026), the consolidated order index remains strong at 138 . By region, the North American order index rose to 144 in July, with semiconductor-related demand remaining high. Greater China also continues to perform exceptionally well with an order index of 159 , indicating robust company-wide order momentum.
5. Financial Foundation and Balance Sheet Health
SMC boasts industry-leading financial health and liquidity. Total assets at the end of the first quarter reached ¥2.3685 trillion (+¥56.7 billion from the end of the previous fiscal year). On the asset side, cash and deposits are abundant at ¥711.0 billion (+¥47.2 billion), ensuring robust liquidity alongside inventories (¥513.2 billion). Highly liquid assets, including securities and investment securities, total ¥832.6 billion . Meanwhile, total liabilities remain at ¥213.7 billion , with interest-bearing debt at a very low level of approximately ¥5.0 billion . As a result, the company maintains an ultra-solid financial structure with an equity ratio of 91.0% . Book value per share (BPS) has steadily increased to ¥34,271 .
6. Capital Expenditure Plan and Strengthening Global Supply
To meet robust global demand, the company plans a large-scale capital expenditure (Capex) of ¥100 billion for the full fiscal year 2026 (ending March 2027) (¥41.3 billion in Japan, ¥58.7 billion overseas). Progress in the first quarter stands at ¥18.8 billion . In Japan, the company is investing in production capacity expansion and BCP (Business Continuity Plan) measures at its mother plants, including Soka, Shimotsuma, Tsukuba, and Tono/Tono SP . Overseas, to optimize the global supply chain and address the rapidly expanding Asian market, the company is enhancing manufacturing bases in Vietnam, China (Tianjin/Beijing), and Singapore , while actively developing logistics and R&D facilities in North America (e.g., Indiana, USA) and Europe (Czech Republic, Germany, Romania, etc.) and Australia.
7. Expansion Strategy in Europe: M&A and Direct Sales
A key growth strategy this quarter was the M&A activity aimed at strengthening the sales network in the Benelux region of Europe. The company successfully converted Dutch distributor SMC Nederland B.V. (increasing stake from 11.4% to 94.3%, acquisition cost approx. ¥9.2 billion) and Belgium’s SMC Belgium B.V. (increasing stake from 0% to 100%, acquisition cost approx. ¥2.1 billion) into consolidated subsidiaries. While the company's market share in the Benelux region currently stands at around 20%, the shift to direct sales and subsidiary integration will allow it to cover areas and customer bases previously unreachable through distributors. The goal is to capture sales growth from semiconductor manufacturing equipment makers with strong footprints in the Netherlands and Belgium, as well as new markets such as cutting-edge hydroponic agriculture.
8. Summary and Outlook
SMC’s Q1 FY2027 results demonstrate spectacular growth across revenue, operating profit, and net income, driven by a dramatic recovery in demand centered on the semiconductor and electronics sectors and the tailwind of a weaker yen . In particular, the increase in sales volume (+22.3%), the improvement in profit margins (27.3% operating margin), and the high ratio of semiconductor-related sales in Greater China and Other Asia underscore the company's indispensable global position. With an ultra-sound financial foundation (91.0% equity ratio) as a backbone, the company is clearly structured to capture further automation and labor-saving needs by pushing forward with ¥100 billion in annual capital investment and strategic M&A in Europe.
Correction (September 29, 2026): Corrected the specified amounts, rates or reporting periods against the original company disclosure; the verified changes are recorded in the correction ledger. Source
This content is not intended as investment advice or a recommendation. Any opinions expressed are solely the personal views of each article.