


Shibaura Machine (6104) Q1 FY2027 Earnings Deep Dive Report

StockClub
Published: Aug 07, 2026, 11:14 AM
Sentiment Analysis

Shibaura Machine (6104) Q1 FY2027 Earnings Deep Dive Report
This is a comprehensive analysis report on the Q1 FY2027 (April–June 2026) financial results of Shibaura Machine Co., Ltd. While the quarter saw a decline in revenue and profit due to the slowdown in EV separator film (BSF) manufacturing equipment , primarily in the Chinese market, the company demonstrated clear leading indicators for a future earnings recovery, including a sharp rebound in the machine tool and ultra-precision machining sectors and a significant increase in new orders .
Below, we provide a detailed breakdown of the overall performance, segment-specific trends, factors affecting ordinary profit, and the progress of strategic M&A aimed at mid-to-long-term growth.
1. Earnings Summary: Revenue/Profit Adjustment and Sharp Rebound in Orders
Although the consolidated results for the first quarter fell into a temporary operating loss due to a contraction in sales volume, the leading indicator of new orders showed a remarkable expansion compared to the same period last year.
Significance of the Slide and Background
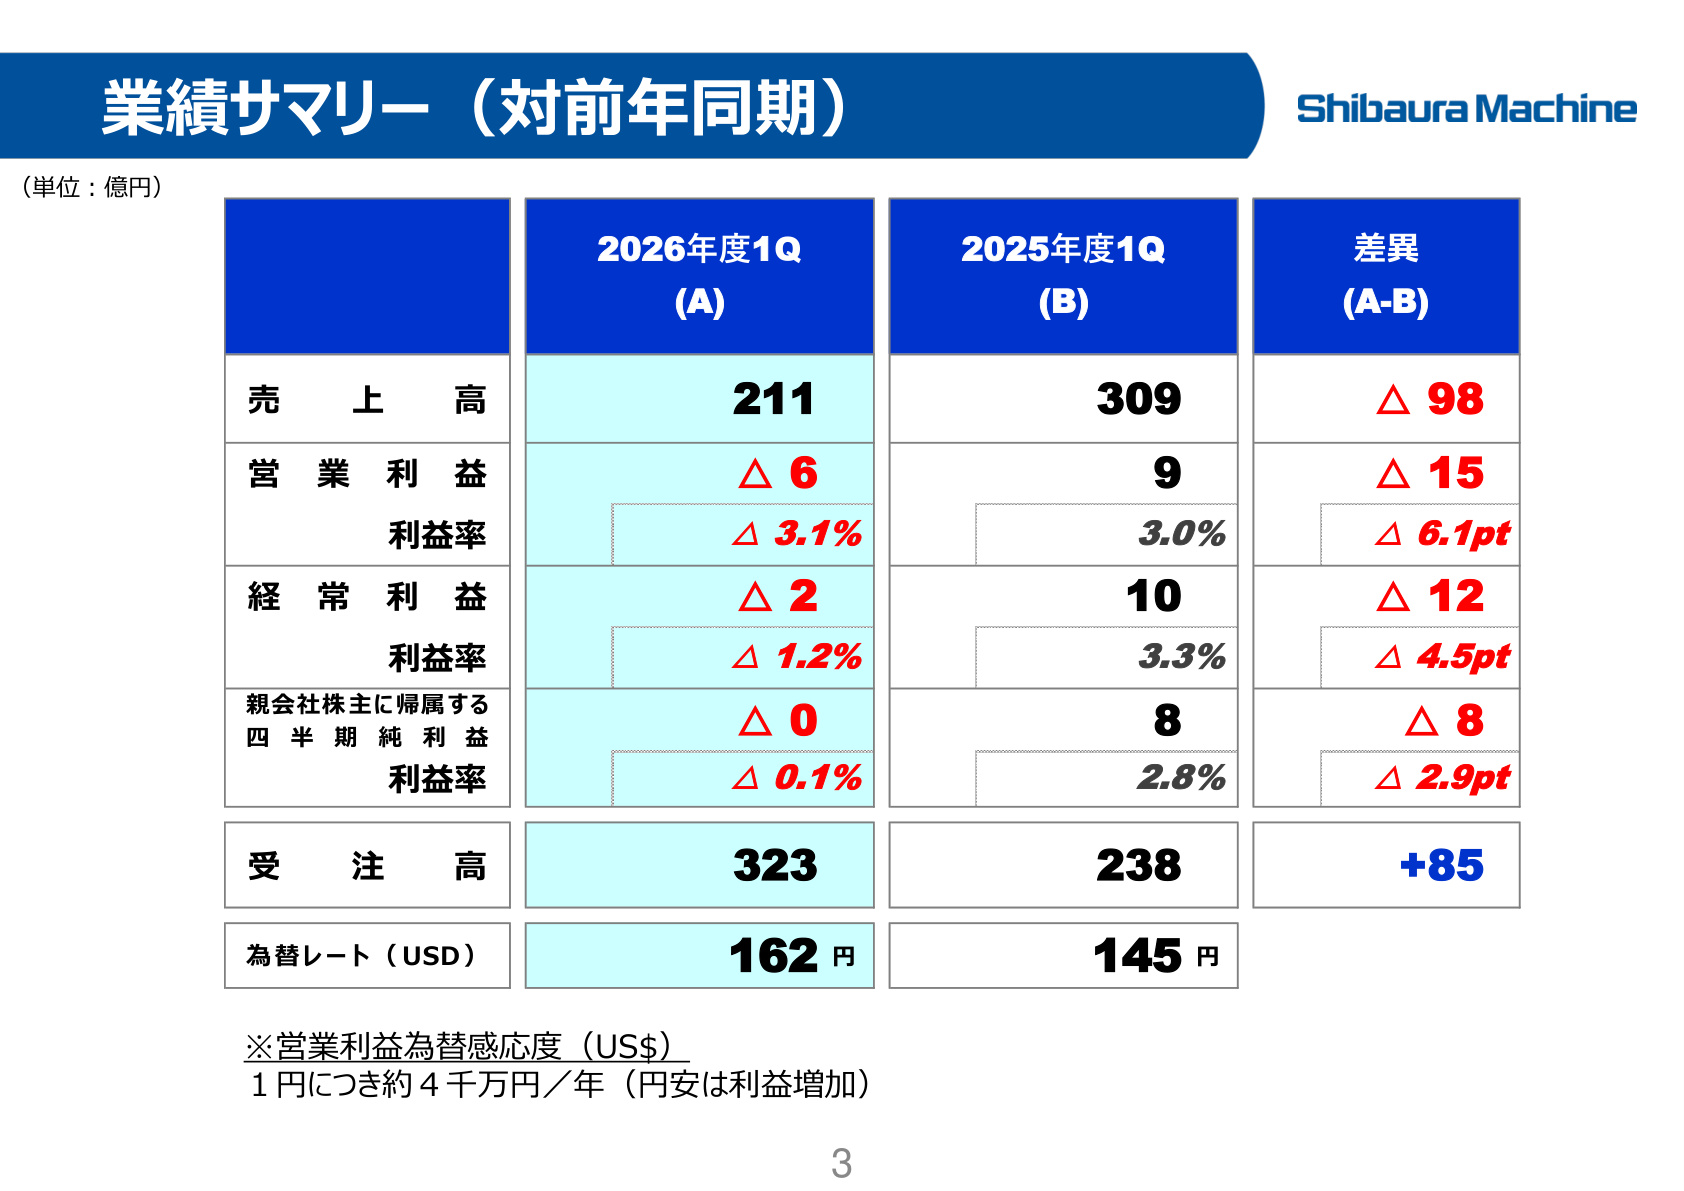
The slide above (Earnings Summary) covers the most critical factual data that characterizes Shibaura Machine's situation this quarter.
- Net Sales : Decreased from 30.9 billion yen in the same period last year to 21.1 billion yen (down 31.8% YoY, a decrease of 9.8 billion yen) . This is primarily due to the completion of the delivery cycle for extrusion molding machines (BSF) for China, which had been at a very high level until the previous fiscal year.
- Operating Profit, Ordinary Profit, and Net Profit : The decline in sales directly impacted the bottom line. Operating profit shifted from a profit of 0.9 billion yen in the same period last year to a loss of 0.6 billion yen (a decrease of 1.5 billion yen YoY) . Ordinary profit landed at a loss of 0.2 billion yen (down 1.2 billion yen YoY) , and net profit attributable to owners of the parent was 0.0 billion yen (down 0.8 billion yen YoY) .
- New Orders : New orders, a leading indicator of performance, achieved a significant V-shaped recovery, rising from 23.8 billion yen in the same period last year to 32.3 billion yen (up 35.6% YoY, an increase of 8.5 billion yen) . This growth in orders serves as a strong backlog for future revenue recovery.
- Exchange Rate : The yen weakened significantly to 1 USD = 162 JPY (compared to 145 JPY in the same period last year). Since the company’s operating profit sensitivity to exchange rates is approximately 40 million yen in annual profit for every 1 yen of depreciation , the currency environment acted as a support factor for performance.
2. Waterfall Analysis of Profit Decline (Ordinary Profit)
The background to the shift from an ordinary profit of 1.0 billion yen in the same period last year to a loss of 0.2 billion yen this period (a total decline of 1.2 billion yen) involves a complex interplay of positive and negative factors resulting from changes in the business environment.
- Impact of Scale Reduction (Δ3.1 billion yen) The significant decrease in net sales compressed the absolute amount of gross profit, serving as the largest negative factor (Δ3.1 billion yen).
- Improvement in Gross Margin (+1.0 billion yen) While the scale of sales shrank, the gross profit margin improved significantly due to a higher proportion of high-profit projects, the effect of product price revisions, and cost-reduction activities, contributing a 1.0 billion yen boost to profit.
- Control of SG&A Expenses (+0.5 billion yen) SG&A expenses were reduced by 0.5 billion yen due to lower logistics costs associated with lower sales and thorough efficiency measures.
- Exchange Rate Impact (+0.5 billion yen) The significant depreciation of the yen during the period generated a positive effect of 0.5 billion yen through foreign currency transactions and the translation of overseas subsidiaries.
As shown, despite the impact of large-scale revenue decline, the structure successfully minimized the expansion of losses through improved gross margins, cost controls, and currency tailwinds .
3. Segment Performance and Qualitative Factors
Looking at the situation by segment, the composition of the machine tool business acting as a strong tailwind to compensate for the adjustments in the molding machine business is clear.
Significance of the Slide and Background
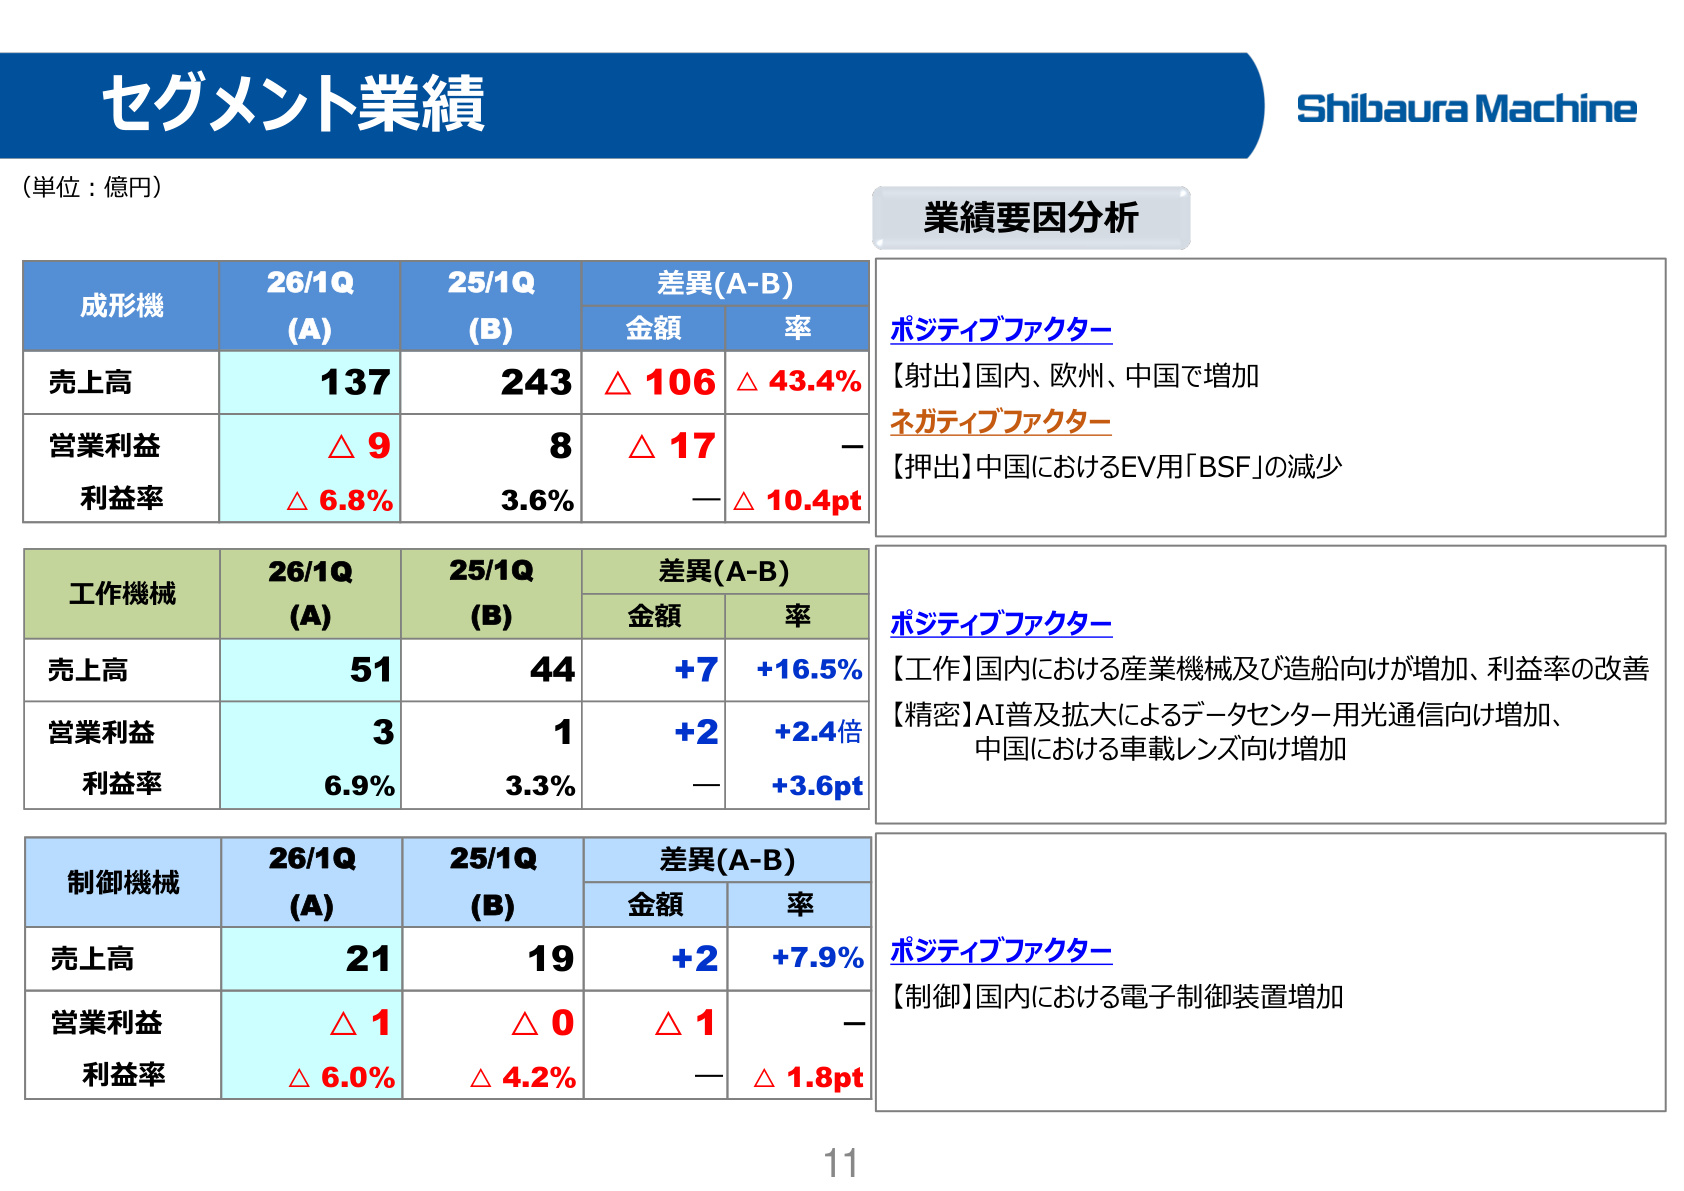
The slide above (Segment Performance) concisely organizes the profitability of each business segment and the underlying "positive" and "negative" factors. It provides a concrete understanding of the current status and challenges of each business.
① Molding Machine Segment (Injection, Die-casting, Extrusion)
- Performance : Net sales were 13.7 billion yen (down 43.4% YoY) , and operating profit was a loss of 0.9 billion yen (compared to a profit of 0.8 billion yen in the same period last year) .
- Analysis :
- Negative Factors : The sharp decline in "BSF (separator film manufacturing equipment)" for EVs in China cast a serious shadow over the extrusion molding business. The main reasons are the slowdown in EV demand growth and the review of capital investment by local battery manufacturers.
- Positive Factors : On the other hand, injection molding machines are showing signs of recovery from the bottom in the Japanese, European, and Chinese markets, steadily capturing demand.
② Machine Tool Segment (Large Machine Tools, Ultra-Precision Machining)
- Performance : Net sales were 5.1 billion yen (up 16.5% YoY) , and operating profit was 0.3 billion yen (2.4 times the same period last year, with the profit margin improving to 6.9%) , achieving significant growth in both revenue and profit.
- Analysis :
- Large Machine Tools : Profit margins improved as projects for general industrial machinery and shipbuilding in Japan increased, and the delivery of high-margin projects progressed.
- Ultra-Precision Machining : Demand for optical communication components for data centers, driven by the rapid expansion of AI , is surging, and this special demand continues. Furthermore, demand for automotive lenses in China remains solid.
③ Control Machine Segment
- Performance : Net sales increased to 2.1 billion yen (up 7.9% YoY) , but operating profit was a loss of 0.1 billion yen .
- Analysis : Although the number of electronic control device deliveries in Japan increased, the segment recorded a small operating loss due to upfront investment costs and product mix effects.
4. Trends in Orders and Backlog: Reigniting the Growth Story
The biggest highlight of this quarter is the strong growth in new orders and order backlog .
- Breakdown of New Orders (32.3 billion yen, +35.6% YoY) :
- Machine Tools : Explosively increased from 5.3 billion yen in the same period last year to 14.0 billion yen (approx. 2.6 times) . In addition to energy, aerospace, and defense-related sectors, demand for AI-related optical communications and shipbuilding is driving growth.
- Molding Machines : Although it reached 15.4 billion yen (down 5.8% YoY), demand for ESS (Energy Storage Systems: for renewable energy and data centers) , excluding EV applications, is expanding in the extrusion molding machine sector. While injection and die-casting remain in a "wait-and-see" mode due to the stagnation in the automotive market, diversification is progressing.
- Control Machines : Performed well at 2.2 billion yen (up 47.1% YoY) due to a focus on system engineering.
- Order Backlog (107.8 billion yen, +5.4% YoY) :
- The order backlog expanded from 102.3 billion yen in the same period last year to 107.8 billion yen . Within this, machine tools jumped to 40.1 billion yen (up 77.8% YoY) , fully establishing the base for mid-to-long-term operations and revenue recognition.
5. Regional Sales Trends: Breaking Away from China Dependency and Resilience in Japan and Other Regions
The regional sales composition reveals a shift in the company's portfolio in the global market .
- Domestic Sales : Expanded from 7.3 billion yen in the same period last year to 8.4 billion yen (up 15.1% YoY) . The domestic sales ratio rose from 24% to 40% .
- Overseas Sales : Shrank from 23.5 billion yen to 12.6 billion yen (down 46.4% YoY) , with the overseas ratio at 60%.
- Regional Details :
- China : Decreased significantly from 12.5 billion yen in the same period last year to 3.1 billion yen . The reaction to the BSF special demand up to the previous quarter is clearly visible.
- North America : 3.9 billion yen (compared to 4.9 billion yen last year), a decline due to the wait-and-see approach to automotive-related capital investment.
- India/Europe : India maintained a high level at 2.5 billion yen (2.9 billion yen last year), and Europe expanded to 0.9 billion yen (0.2 billion yen last year), indicating progress in regional diversification.
6. Full-Year Forecast, Capital Investment, and Shareholder Return Policy
Shibaura Machine has decided to maintain its full-year earnings forecast and dividend plan as originally announced , despite the progress in the first quarter.
FY2026 Full-Year Forecast (No changes from the May 25, 2026 announcement)
- Net Sales : 137.0 billion yen (+3.1% YoY)
- Operating Profit : 4.2 billion yen (Δ0.1 billion yen YoY)
- Ordinary Profit : 3.1 billion yen (Δ1.9 billion yen YoY)
- Net Profit Attributable to Owners of the Parent : 2.0 billion yen (+100.0% YoY)
- Assumed Exchange Rate : 1 USD = 150 JPY (The current rate of 162 JPY is a tailwind factor)
While the progress rate in Q1 is low for both sales and profit, the company aims to achieve its full-year targets through a substantial order backlog (107.8 billion yen) and a delivery schedule weighted toward the second half.
Capital Investment and R&D Plans
- Capital Investment : Planned at 4.3 billion yen for the full year (0.8 billion yen achieved in Q1). Growth investments are in full swing, such as the construction of a new plant in India to expand global production capacity.
- R&D Expenses : Planned at 2.7 billion yen for the full year (0.5 billion yen in Q1), with depreciation planned at 2.9 billion yen (0.7 billion yen in Q1).
Dividend Policy (Shareholder Returns)
- Annual Dividend Forecast : Maintained at 140.0 yen per share (70.0 yen at the end of Q2, 70.0 yen at year-end).
- Dividend Payout Ratio : The consolidated payout ratio is expected to be 165.5% , demonstrating a strong commitment to stable dividends even during temporary profit adjustment phases.
7. Mid-to-Long-Term Growth Strategy: Global Expansion and Business Growth through M&A
In addition to organic growth in existing businesses, the company is aggressively pursuing strategic M&A to achieve non-linear growth in areas where it holds a competitive advantage.
Significance of the Slide and Background
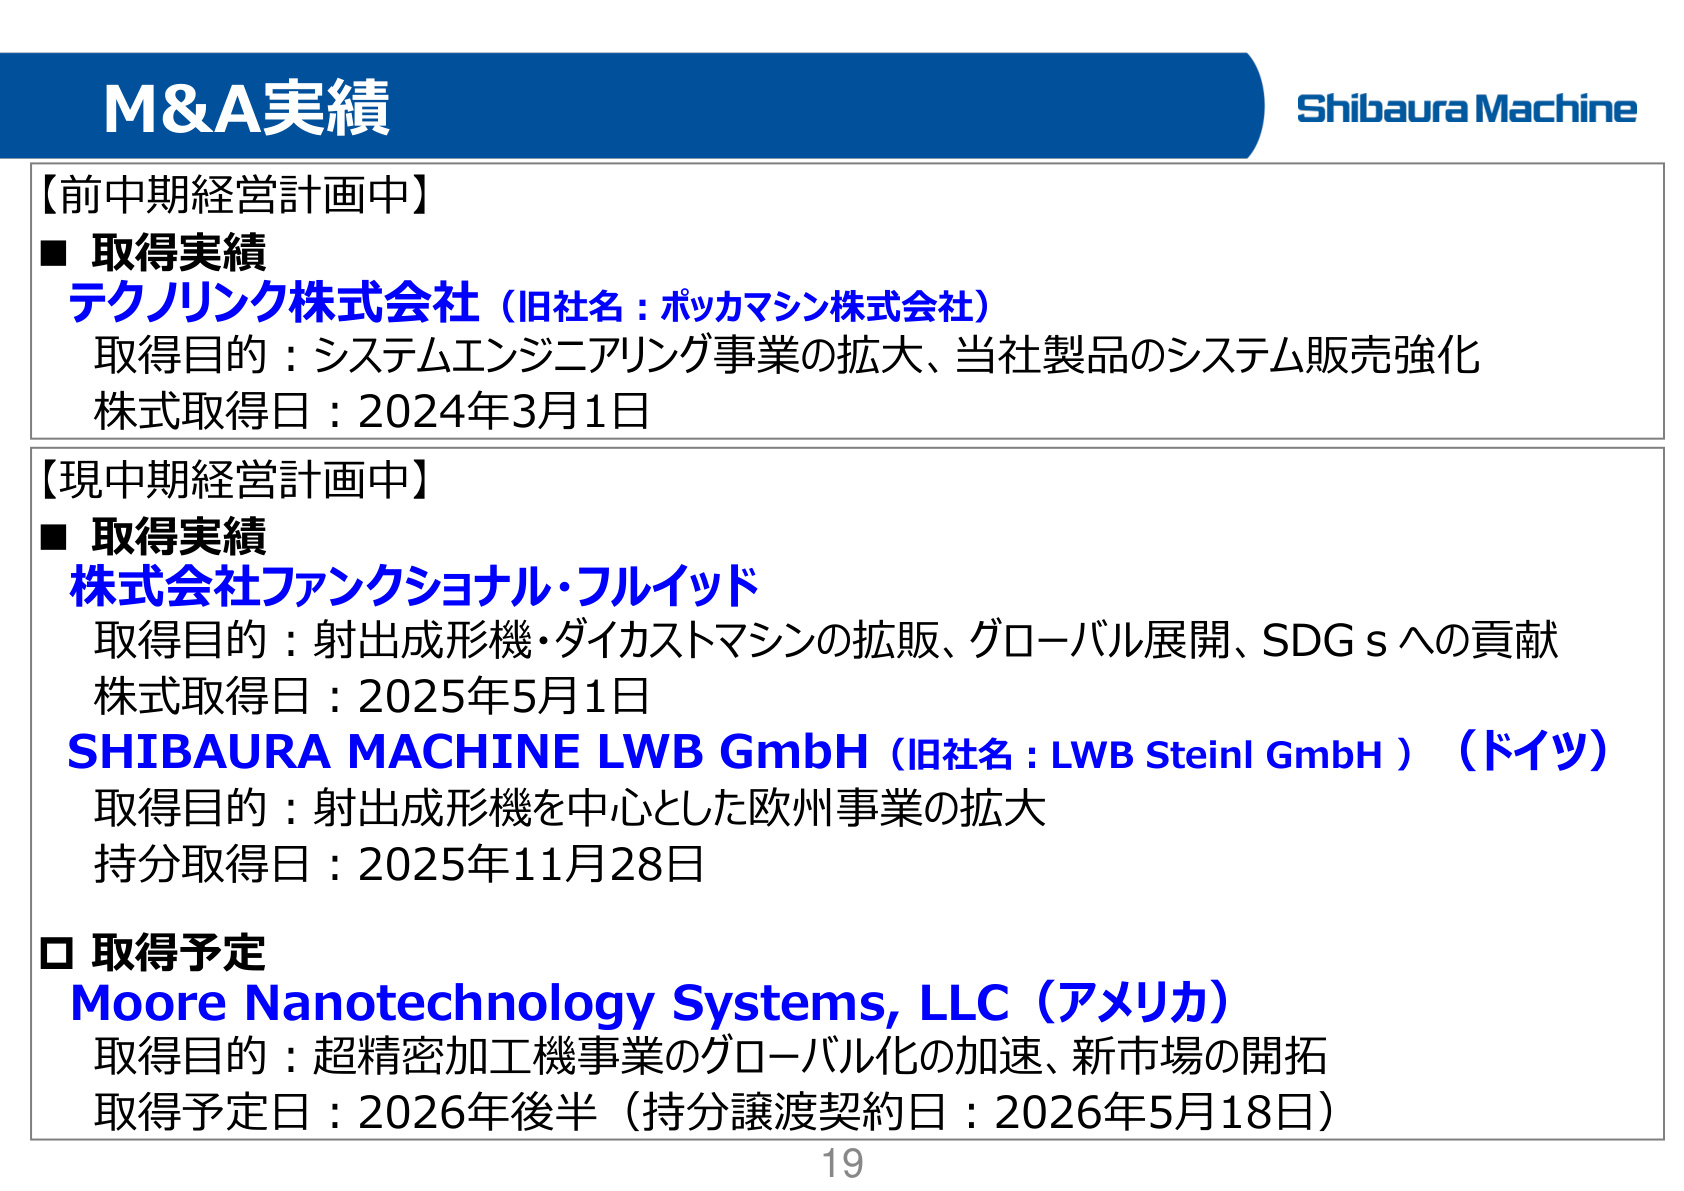
The slide above (M&A Track Record) shows the overall picture of the mid-to-long-term business portfolio transformation promoted by Shibaura Machine. Each acquisition is designed not merely for scale expansion, but with clear objectives of technology acquisition, sales network expansion, and diversification of target markets .
- Technolink Co., Ltd. (formerly Pokka Machine)
- Acquisition Date : March 1, 2024 (Completed)
- Purpose : Expansion of the system engineering business and strengthening of system sales for company products. It enhances the ability to propose automation and systemization for entire lines, rather than just selling individual equipment.
- Functional Fluid Co., Ltd.
- Acquisition Date : May 1, 2025 (Completed)
- Purpose : Global expansion of injection molding and die-casting machines, and strengthening of environmentally friendly products in line with SDGs.
- SHIBAURA MACHINE LWB GmbH (formerly LWB Steinl GmbH)
- Acquisition Date : November 28, 2025 (Completed)
- Purpose : Establishment of business bases centered on injection molding machines in the European market and dramatic expansion of sales and service networks.
- Moore Nanotechnology Systems, LLC (USA)
- Planned Acquisition : Late 2026 (Equity transfer agreement signed: May 18, 2026)
- Purpose : Accelerating the global expansion of the highly profitable ultra-precision machining business and developing new markets, including North America.
8. Conclusion: Summary of Earnings and Future Focus
Shibaura Machine's Q1 FY2027 earnings resulted in a decline in revenue and an operating loss due to the "reaction to the BSF special demand." However, by unraveling the internal structure, it is clear that extremely positive changes are underway.
- Positive Factors : Rapid expansion of the machine tool business (orders up 2.6x, backlog of 40.1 billion yen), spillover of demand for AI-related optical communications, defense, and shipbuilding , horizontal expansion of extrusion molding machines into ESS applications , and proactive M&A measures .
- Key Points to Watch : Whether profitability will recover rapidly as the surged machine tool backlog is recognized as revenue toward the second half, and the timing of the full-scale recovery of injection molding machines in the Chinese and European markets will be the keys to future performance trends.
This content is not intended as investment advice or a recommendation. Any opinions expressed are solely the personal views of each article.