


Bridgestone H1 2026 Earnings Deep Dive: Record-Breaking Performance and the Evolution of 'Quality Growth'

StockClub
Published: Aug 07, 2026, 11:04 AM
Sentiment Analysis

Bridgestone’s consolidated financial results for the first half of 2026 demonstrate exceptional strength. Despite persistent global macroeconomic uncertainty, the company’s focus on strengthening its business foundation and transitioning toward 'Quality Growth' has resulted in record-highs for both revenue and adjusted operating profit .
This report provides a multi-faceted analysis of the earnings, focusing on key topics extracted from the financial materials, including an overview of performance, the structure of profit fluctuations, regional and segment-specific details, and future growth strategies and risk factors.
1. H1 2026 Earnings Highlights and Overview
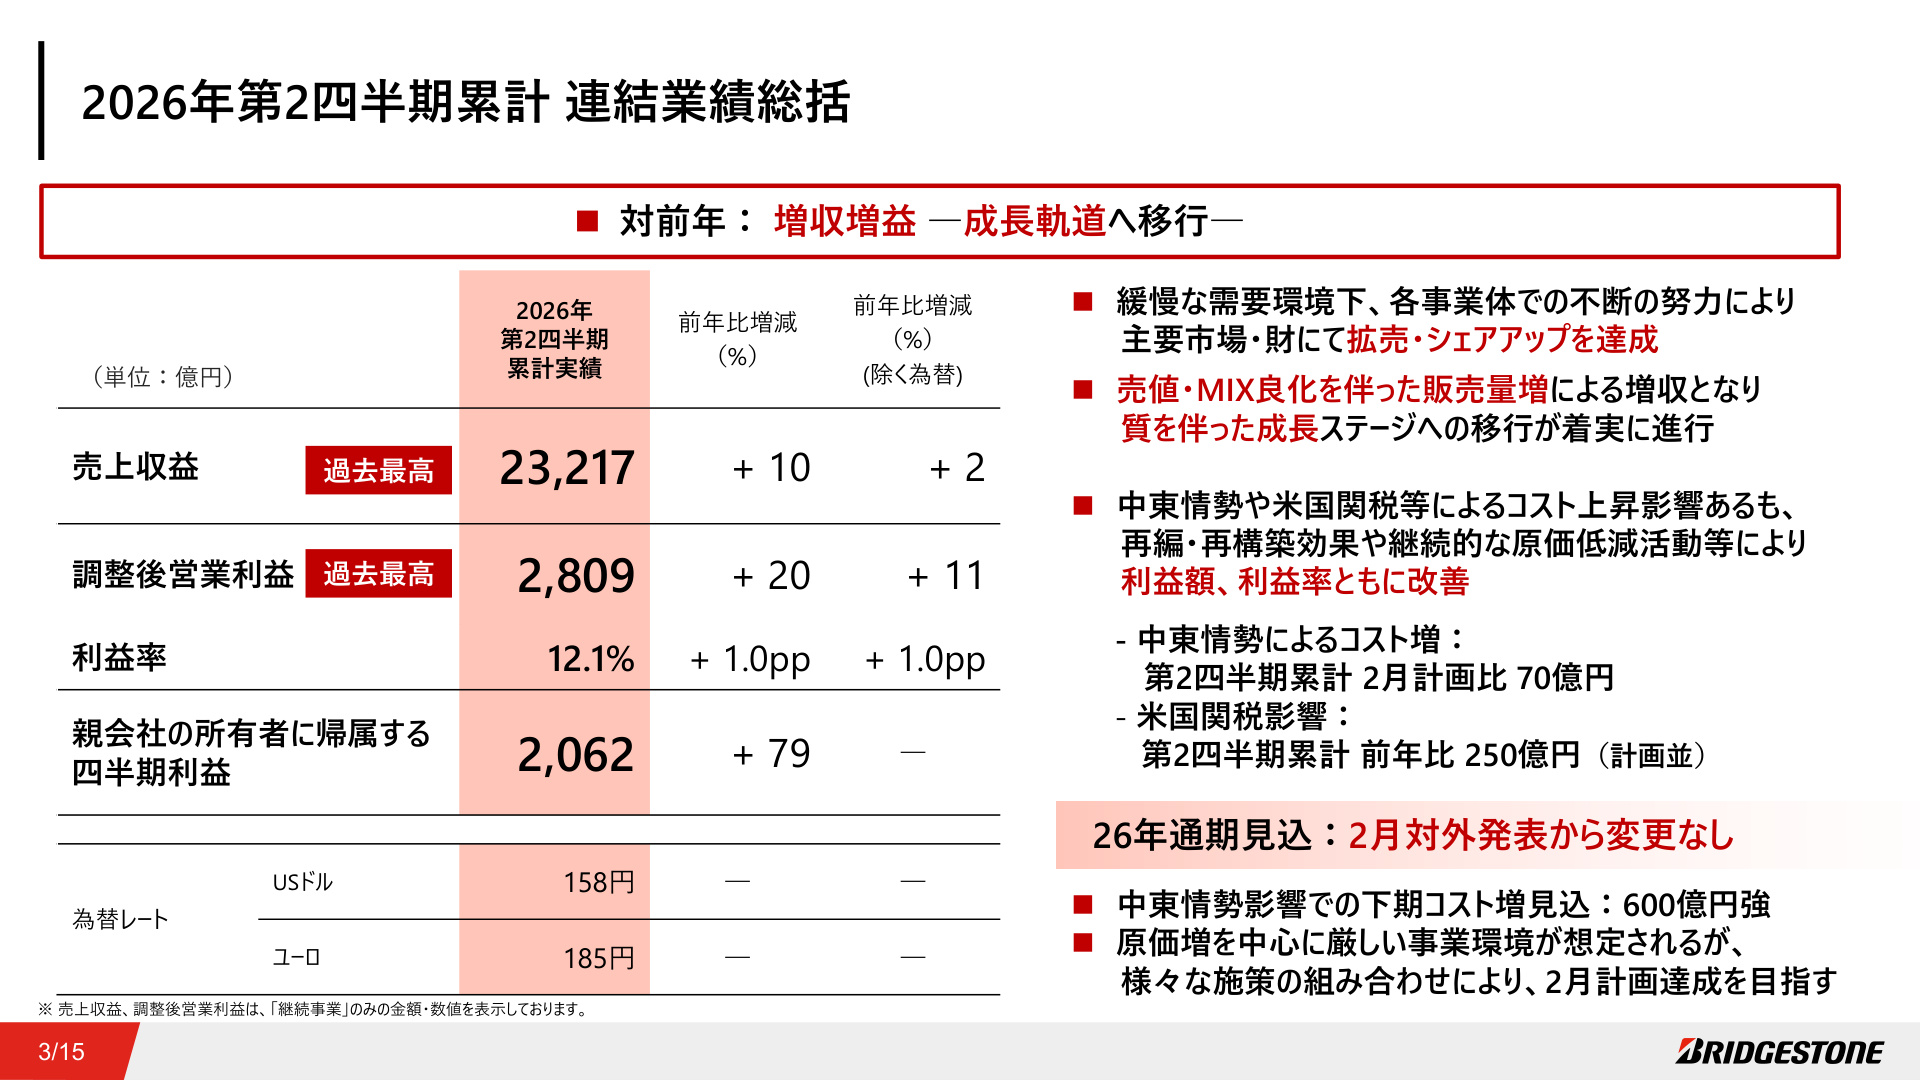
For the first half of 2026, Bridgestone reported consolidated revenue of ¥2.3217 trillion (up 10% YoY) and an adjusted operating profit of ¥280.9 billion (up 20% YoY). The operating margin reached 12.1% (+1.0pp YoY), and profit attributable to owners of the parent rose by ¥7.9 billion to ¥206.2 billion , marking a significant increase in both revenue and profit.
[Slide Commentary: Consolidated Financial Summary (Index 2)]
The slide above summarizes the key KPIs and the overall picture of these earnings. As indicated by the 'record-high' badges for both revenue and adjusted operating profit, the company has demonstrated high profitability in a global tire market characterized by volatile demand. Notably, even excluding foreign exchange impacts, the company achieved 2% growth in revenue and 11% growth in adjusted operating profit. The structure clearly shows that external cost pressures—such as increased transportation and raw material costs due to Middle Eastern tensions (¥7.0 billion impact in H1) and U.S. tariffs (¥25.0 billion impact in H1)—were successfully absorbed through improved selling prices/MIX , structural reform (reorganization/restructuring) effects , and cost-reduction activities .
2. Analysis of Adjusted Operating Profit Fluctuations: What Drove Performance?
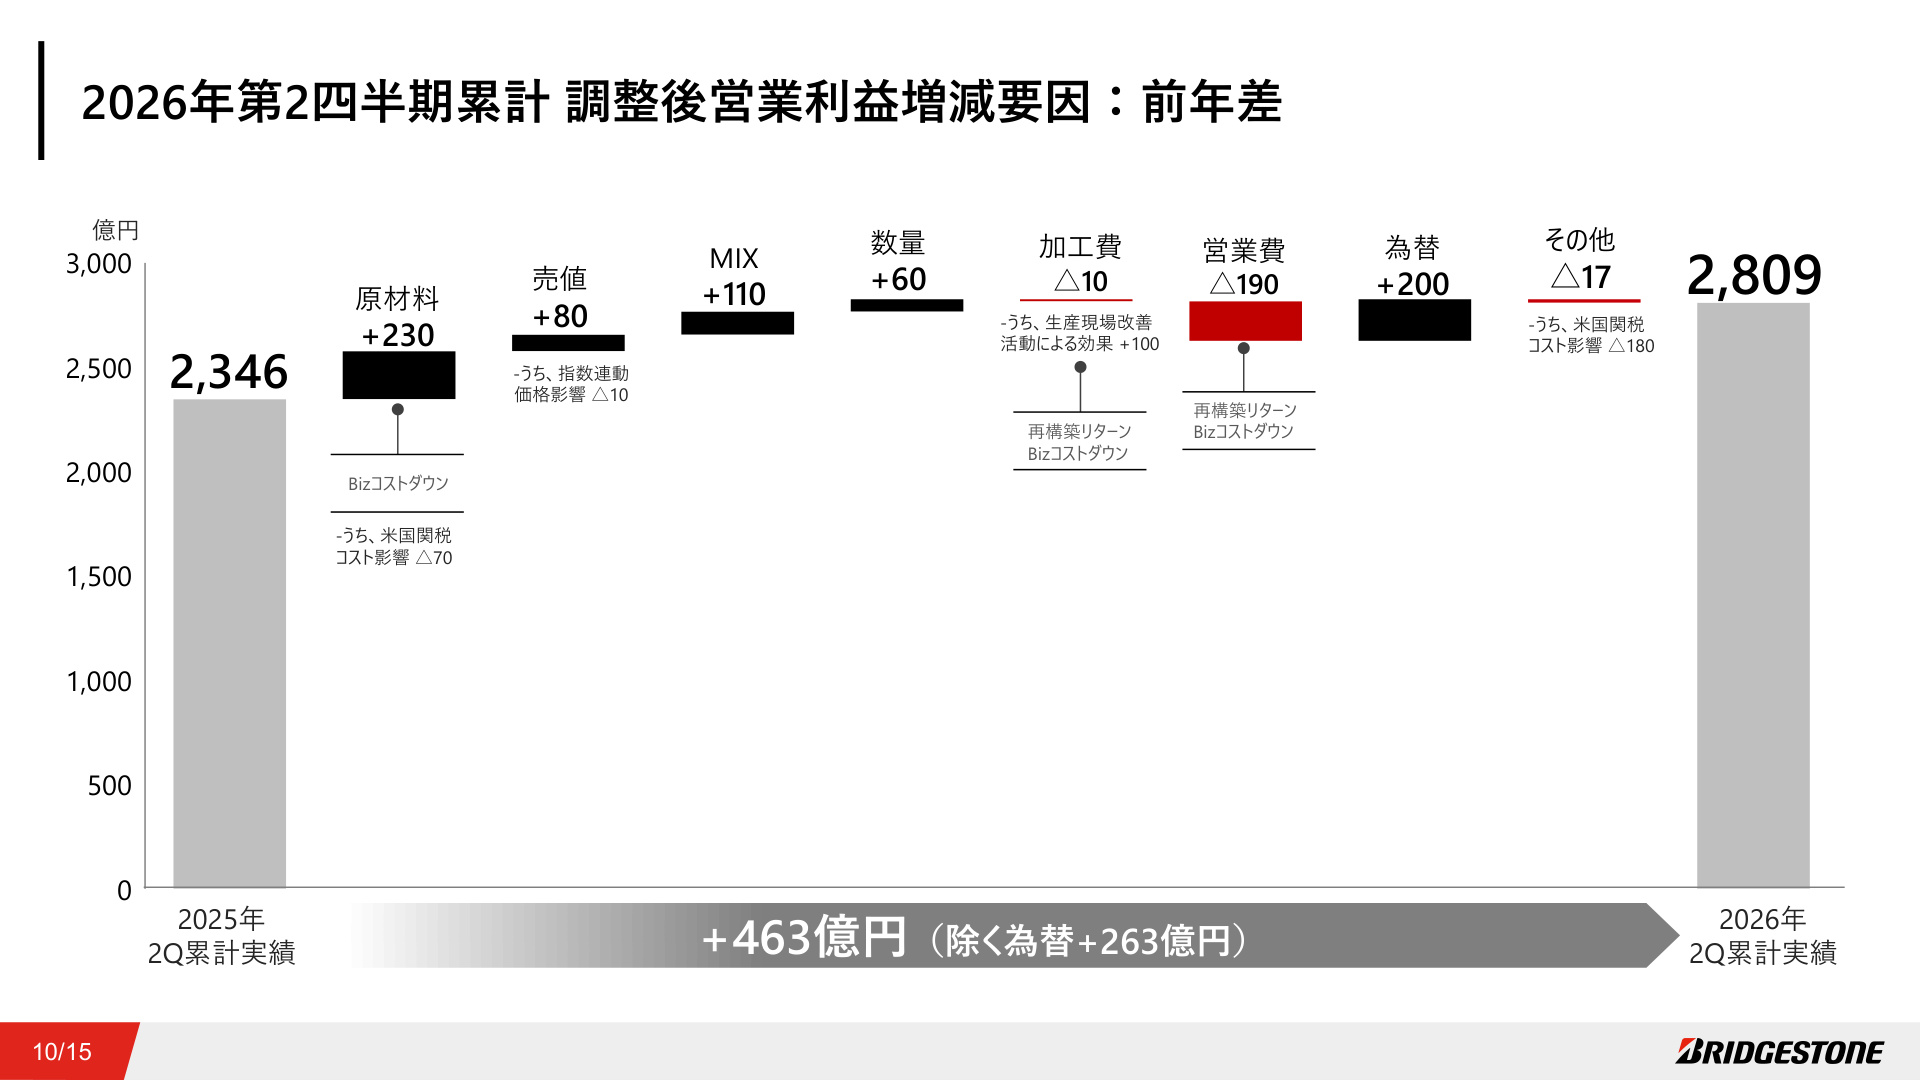
There are clear structural factors behind the ¥46.3 billion increase in adjusted operating profit compared to the same period last year (or a ¥26.3 billion increase excluding the ¥20.0 billion positive FX impact).
[Slide Commentary: Adjusted Operating Profit Variance (Index 9)]
This waterfall chart illustrates the progression from ¥234.6 billion in the previous year to ¥280.9 billion. The primary drivers of profit growth were as follows:
- Raw Material Cost Improvement (+¥23.0 billion) : Favorable raw material prices and cost-reduction measures contributed significantly (though this includes a ¥7.0 billion negative impact from U.S. tariffs).
- Selling Price/MIX Improvement (+¥19.0 billion) : Price revisions contributed +¥8.0 billion , while the increased ratio of high-inch tires and high-value-added products (MIX improvement) generated +¥11.0 billion . This reflects a steady execution of value-based pricing and premiumization, even in a market with slowing demand.
- Sales Volume Increase (+¥6.0 billion) : Driven by global market share gains and the impact of new products.
- Production Site Improvements (+¥10.0 billion) : Operational efficiency and cost reductions in processing expenses boosted profits.
Conversely, deductions included operating expenses (-¥19.0 billion) , which cover investments for future growth and restructuring returns, as well as tariff and other cost increases (-¥1.7 billion, including -¥18.0 billion from U.S. tariffs). The company has achieved an ideal profit expansion structure where core earning power (substantial cost reduction and MIX effects) outweighs cost increases.
3. Regional and Segment Performance
An analysis of market environments and performance by region reveals the progress of strategies tailored to local characteristics:
- Japan : Revenue of ¥634.4 billion (+5% YoY), adjusted operating profit of ¥113.9 billion ( +38% YoY , 17.9% margin). Profitability improved significantly due to the weak yen, increased replacement tire sales, the success of the new 'FINESSA' product line, and the expansion of high-margin ultra-large off-road (OR) tires for mining.
- Americas : Revenue of ¥1.1353 trillion (+11% YoY), adjusted operating profit of ¥103.0 billion ( +12% YoY ). Despite a challenging North American market where overall demand fell below the previous year, the company achieved market share gains in the replacement sector through a multi-brand strategy for passenger tires (PS) and steady performance in the truck and bus (TB) tire solutions business. South American operations also remained profitable, strengthening the business foundation.
- EMEA (Europe, Middle East, Africa) : Revenue of ¥458.5 billion (+11% YoY), adjusted operating profit of ¥34.1 billion ( +85% YoY , 7.4% margin). The results of structural reforms and reorganization in the TB business were evident, and combined with the expansion of premium tire sales, profitability improved dramatically.
- Asia, Oceania, India, and China : Revenue of ¥278.0 billion (+13% YoY), adjusted operating profit of ¥31.0 billion ( +6% YoY ). Growth was supported by increased replacement tire sales in India and expanded original equipment (OE) sales in China.
4. Evolution of Business Portfolio and Product/Solution Strategy
Bridgestone has redefined its business into 'Core Business (Tires),' 'Growth Business (Solutions),' and 'Strategic Business,' and is working to enhance the profitability of each.
[Slide Commentary: Performance by Business Portfolio (Index 12)]
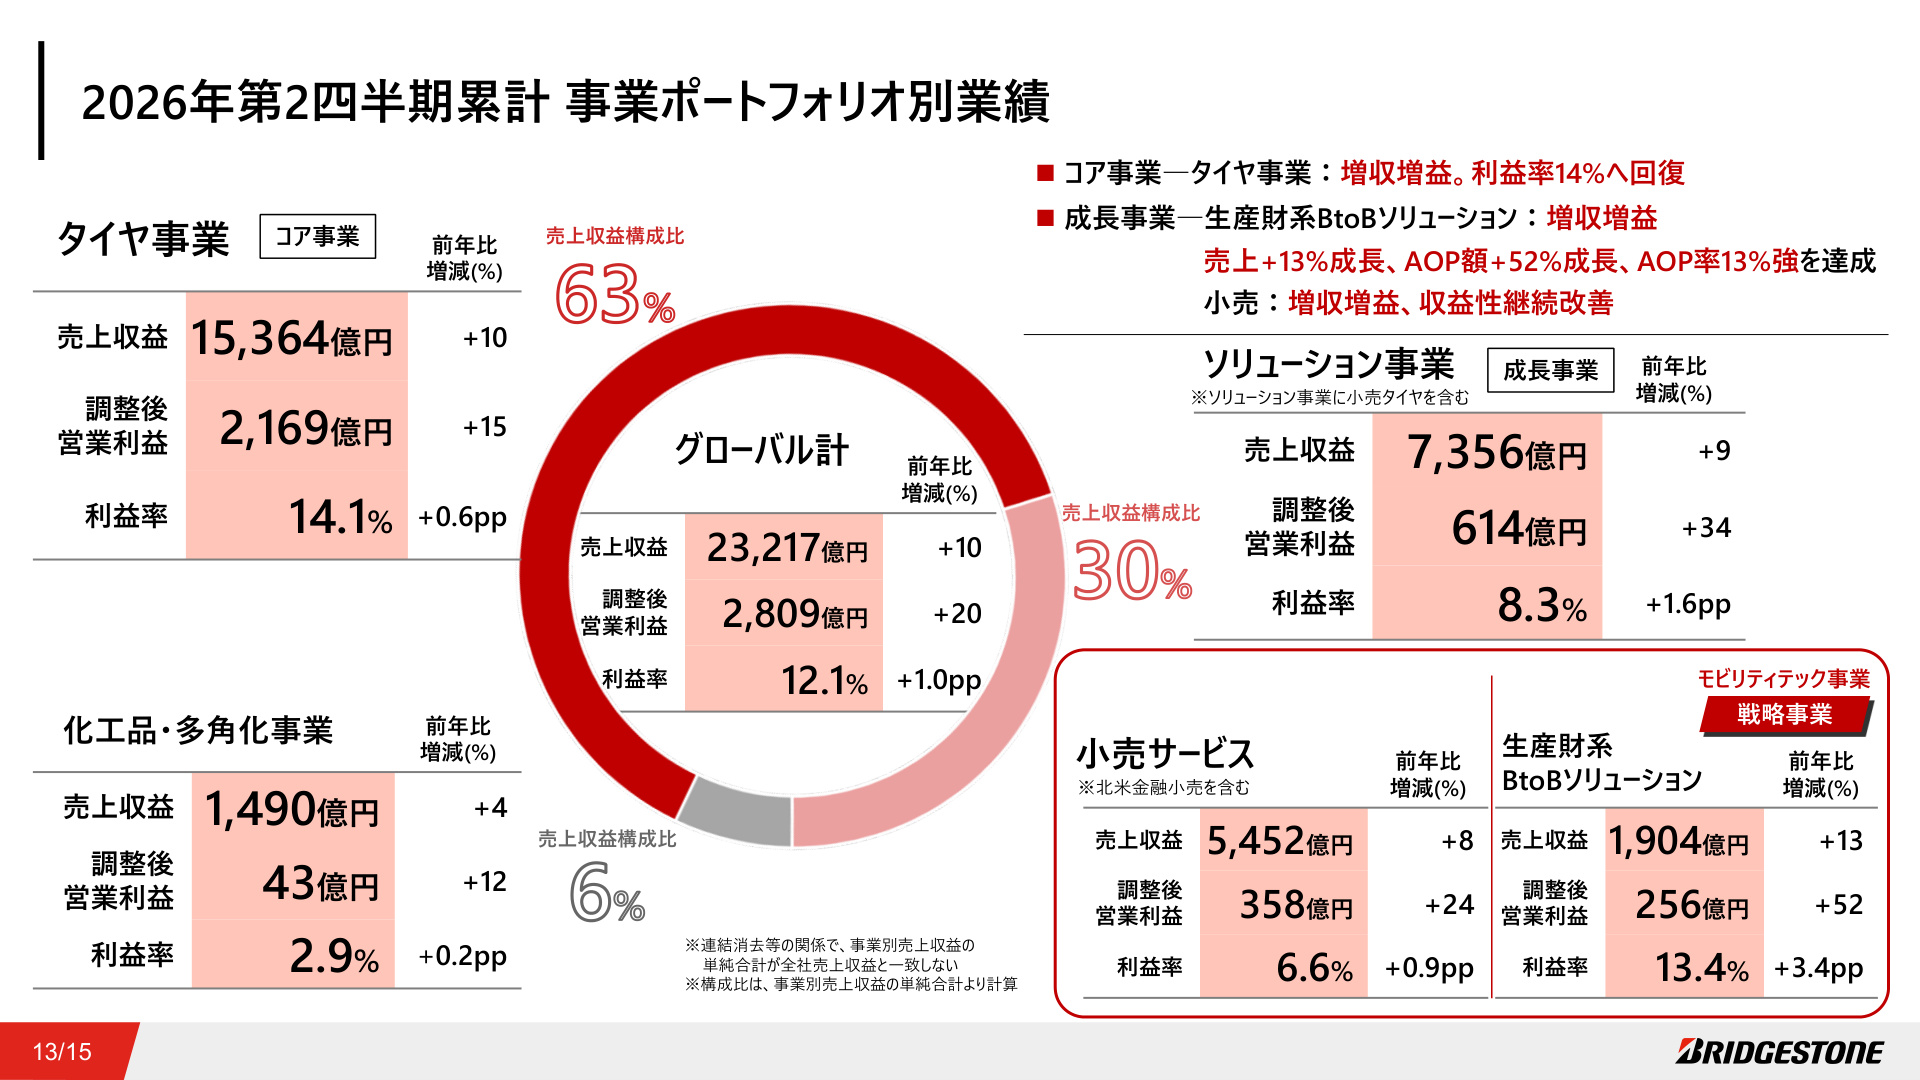
This slide clearly illustrates the results of the company's structural reforms and the balance of its profit structure .
- Core Business (Tire Business) : Accounting for 63% of revenue, it achieved ¥1.5364 trillion in revenue (+10% YoY) and ¥216.9 billion in adjusted operating profit (+15% YoY), with a 14.1% margin (+0.6pp). The expansion of high-inch premium tires has fully restored the core's earning power.
- Growth Business (Solutions Business) : Accounting for 30% of revenue, it is growing rapidly with ¥735.6 billion in revenue (+9% YoY) and ¥614 billion in adjusted operating profit ( +34% YoY ). Notably, 'B2B Solutions for Commercial Tires' saw operating profit surge +52% YoY (¥25.6 billion) with a 13.4% margin (+3.4pp), marking a steady transition from a standalone product seller to a solutions company.
- Specialties (Mining, Construction, Agriculture, Aircraft, etc.) : Maintained its position as a high-profit business with ¥343.6 billion in revenue (+11% YoY), ¥78.9 billion in adjusted operating profit (+20% YoY), and a 22.9% margin .
Strengthening Product and Brand Power
In the first half of 2026, the company launched 18 new products globally (with over 25 planned for the full year). High-value-added products tailored to customer needs, such as the 'ULTRAWEATHER' all-season tire in North America, the new standard 'FINESSA HB01' in Japan, and the 'W909' studless tire for trucks and buses, are being introduced to the market. Furthermore, the company is actively promoting its brand globally through motorsports (19 consecutive wins at the Suzuka 8 Hours, exclusive supply to the Indy 500, etc.) and the 125th-anniversary activities of the 'Firestone' brand.
5. Financial Soundness and Capital Policy
Earnings growth is directly linked to improvements in cash flow and asset efficiency.
- Cash Flow : Cash flow from operating activities increased by ¥62.7 billion YoY to ¥341.8 billion , and free cash flow increased by ¥63.3 billion YoY to ¥221.5 billion , demonstrating extremely robust cash generation.
- Capital Policy Progress : The share buyback program of up to ¥150 billion announced in February 2026 reached an execution rate of approximately 87% by the end of July, proving the company's commitment to shareholder returns and capital efficiency (expansion of the ROIC-WACC spread). Additionally, the company has completed ¥150 billion in financing through corporate bonds to reduce its WACC (Weighted Average Cost of Capital).
6. Full-Year Outlook and Future Risks
Bridgestone has maintained its initial full-year 2026 consolidated earnings forecast announced in February.
- Revenue : ¥4.5 trillion (+2% YoY)
- Adjusted Operating Profit : ¥515 billion (+4% YoY)
- Operating Profit Margin : 11.4% (+0.3pp YoY)
- Profit for the Year : ¥340 billion (+4% YoY)
- Annual Dividend per Share : ¥125 (planned increase of ¥10 YoY)
H2 Risks and Countermeasures
Although H1 performance exceeded the plan, there are concerns regarding rising crude oil and raw material prices and soaring maritime logistics costs due to escalating tensions in the Middle East for the second half. The company estimates the cost impact of Middle Eastern tensions to be over ¥60 billion in H2 (approximately ¥70 billion for the full year) and remains cautious about achieving its H2 targets.
However, by maintaining the momentum of price/MIX improvements cultivated in H1, the effects of fixed-cost reductions through structural reforms, and the continued introduction of new products, the company aims to achieve its initial plan through strict cost management.
Summary
In the first half of 2026, Bridgestone demonstrated a resilient business structure capable of overcoming external headwinds through the expansion of premium tire sales, the growth of its solutions business, and the fruits of business reorganization. While maintaining vigilance against short-term cost increase risks, these earnings confirm that the company is steadily on the path of 'Quality Growth' toward its 100th anniversary in 2031.
This content is not intended as investment advice or a recommendation. Any opinions expressed are solely the personal views of each article.