


Mitsubishi Gas Chemical Q1 FY2026 Earnings Deep Dive: Strong Market Conditions and Electronic Materials Recovery Drive Significant Full-Year Guidance Upgrade

StockClub
Published: Aug 07, 2026, 10:42 AM
Sentiment Analysis
Mitsubishi Gas Chemical Company, Inc. (MGC) achieved substantial year-on-year growth in both revenue and profit for the first quarter of fiscal year 2026. This performance was driven by a confluence of factors, including rising market prices for methanol due to heightened tensions in the Middle East, robust sales of electronic materials, and the positive impact of a weaker yen. Reflecting the strong Q1 results, the company has significantly upwardly revised its full-year revenue and profit forecasts.
This report provides a detailed analysis of the company's current performance, key drivers, segment-specific results, and future growth strategies, centered on 10 key topics derived from the earnings presentation materials.
1. Q1 FY2026 Earnings Highlights: Profit Surges to 2.5x Year-on-Year
The consolidated results for the first quarter (April–June 2026) showed strong growth across all major indicators compared to the same period last year:
- Net Sales : ¥223.7 billion (+¥45.7 billion / +25.7% YoY)
- Operating Profit : ¥27.8 billion (+¥16.8 billion / +153.5% YoY)
- Ordinary Profit : ¥29.1 billion (+¥15.3 billion / +111.0% YoY)
- Profit Attributable to Owners of Parent : ¥18.3 billion (+¥9.9 billion / +118.1% YoY)
Growth was primarily fueled by a surge in methanol market prices within the core Green Energy & Chemicals (GEC) segment, alongside a strong recovery in demand for semiconductor and electronic materials in the Functional Chemicals segment.
2. Operating Profit Variance Analysis: Price Pass-through and Inventory Valuation Effects as Primary Drivers
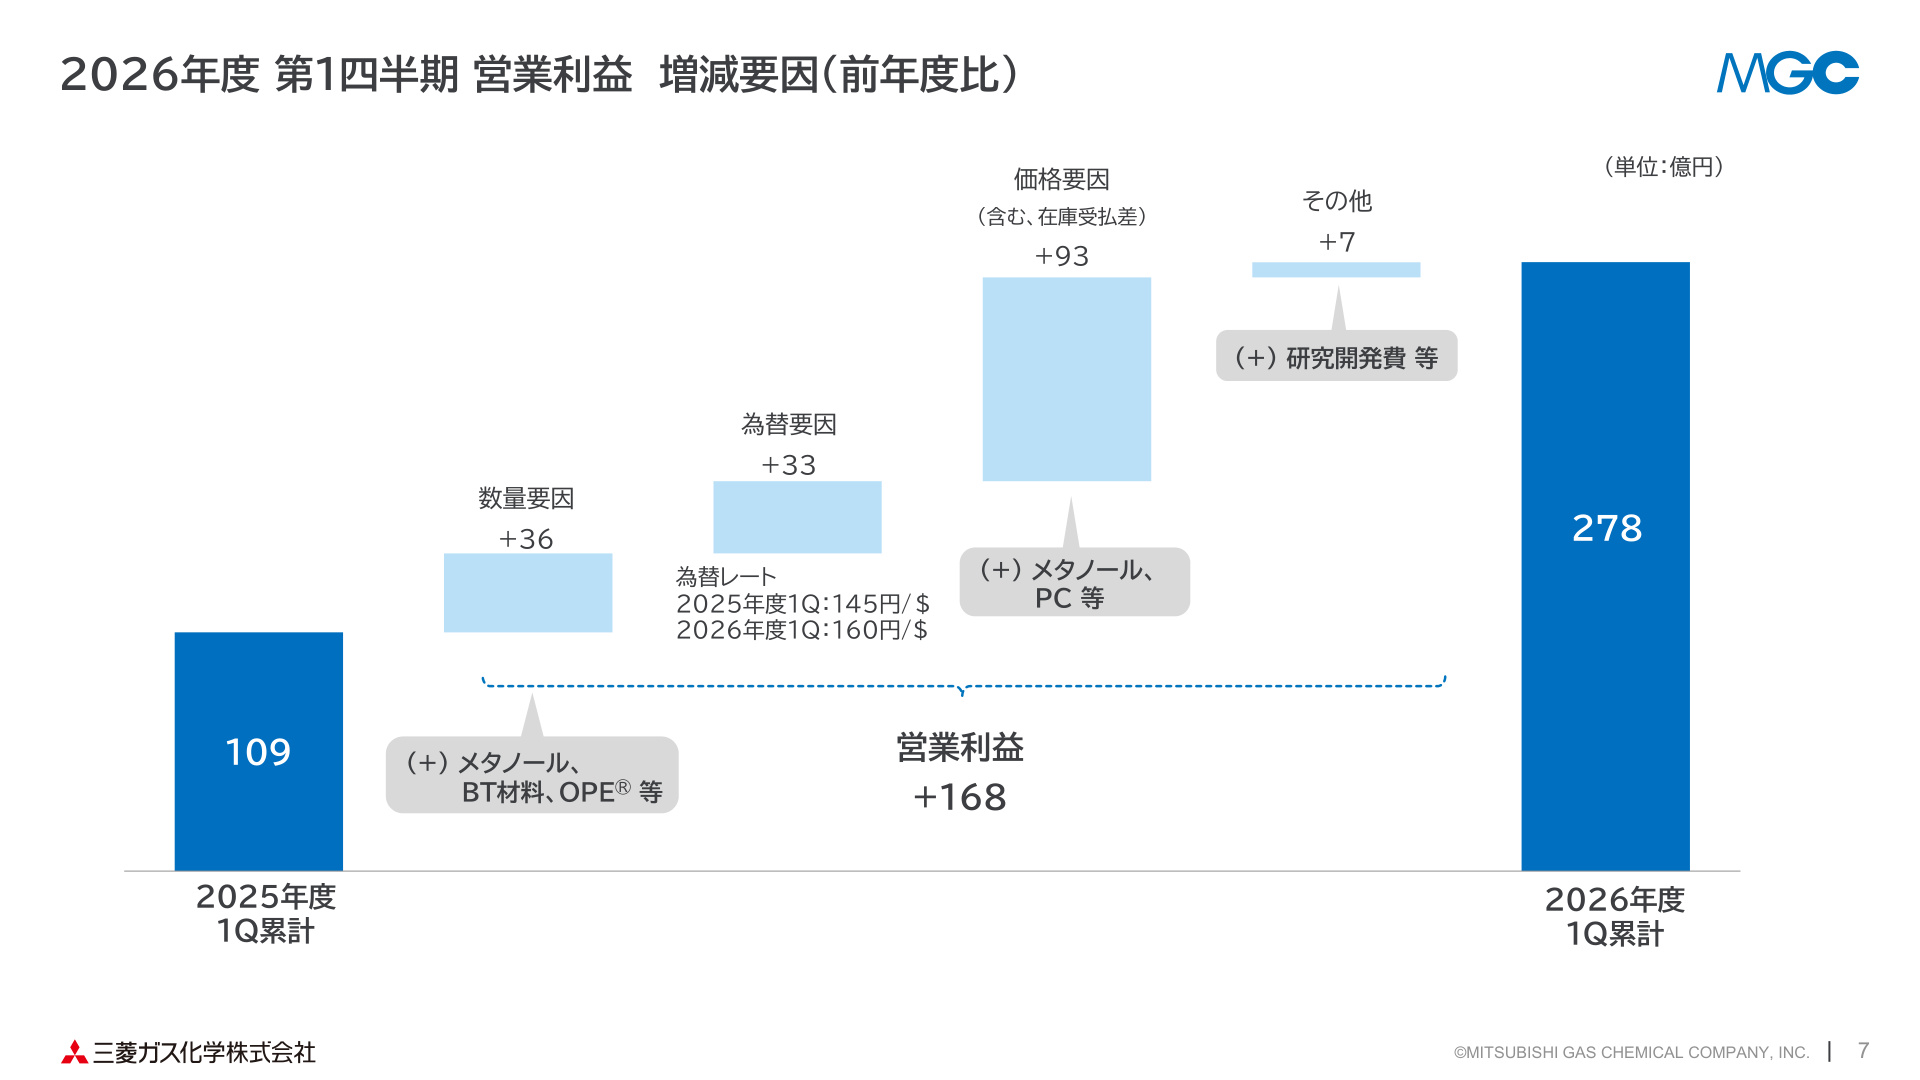
The increase in operating profit from ¥10.9 billion in the same period last year to ¥27.8 billion—a rise of ¥16.8 billion (+153.5%) —is structurally supported by positive contributions from price, volume, and foreign exchange factors.
Rationale for Slide Selection and Data Analysis
The slide above illustrates the waterfall chart of operating profit variance from Q1 FY2025 to Q1 FY2026, serving as the most critical analytical tool for understanding the root causes of this earnings expansion.
The breakdown is as follows:
- Price Factors (including inventory valuation differences) : +¥9.3 billion Rising market prices for methanol and polycarbonate (PC), combined with successful and rapid pass-through of increased raw material costs, were key. Additionally, the positive impact of inventory valuation differences during the market uptrend contributed significantly.
- Volume Factors : +¥3.6 billion Sales volumes increased for methanol, BT materials for semiconductor packaging, and OPE® substrate materials for AI servers.
- Foreign Exchange Factors : +¥3.3 billion The depreciation of the yen against the US dollar, moving from ¥145/USD in the same period last year to ¥160/USD , boosted profits.
3. Impact of Middle East Tensions: Risk Management and Net Positive Effects from Market Price Hikes
While the heightened tensions in the Middle East significantly impacted the company's business environment, the net effect on Q1 earnings was positive.
- Supply and Production Impact : Although there were minor constraints on methanol shipments from Saudi Arabia, alternative sourcing from other locations ensured that the direct negative impact on overall production and sales remained limited.
- Manufacturing Costs and Price Pass-through : While manufacturing costs for basic chemicals and engineering plastics rose due to higher raw material and fuel prices, the company successfully implemented timely price adjustments for customers.
- Benefit from Market Spikes : Supply concerns stemming from the Middle East crisis caused Asian methanol spot prices to surge (from $314/MT in the previous period to $530/MT in the current period), leading to higher sales prices and significant gains from inventory valuation effects.
4. Segment Performance ①: Significant Profit Growth in Green Energy & Chemicals (GEC)
The GEC segment encompasses natural gas chemicals and aromatic chemicals, which are highly sensitive to market fluctuations.
- Net Sales : ¥99.8 billion (+¥31.5 billion YoY)
- Operating Profit : ¥11.9 billion (+¥9.9 billion / +521.1% YoY)
- Ordinary Profit : ¥11.6 billion (+¥7.7 billion YoY)
In the natural gas chemicals business, operating profit jumped from ¥1.2 billion to ¥10.2 billion due to the rise in methanol market prices and inventory valuation effects. Despite a ¥1.8 billion decline in equity-method investment gains due to lower utilization at the Saudi Arabian facility, the strong growth in core operating profit more than offset this, resulting in a substantial increase in ordinary profit.
5. Segment Performance ②: Expansion in Functional Chemicals and Semiconductor/AI Materials
The Functional Chemicals segment, which includes many high-value-added products, also performed well, capturing the recovery in the electronics market.
-
Net Sales : ¥122.8 billion (+¥13.9 billion YoY)
-
Operating Profit : ¥17.1 billion (+¥7.5 billion / +78.1% YoY)
-
Inorganic Chemicals (EL Chemicals, etc.) : Sales volume increased in line with the recovery in demand for ultra-pure hydrogen peroxide (EL chemicals) for semiconductors. Reduced depreciation expenses following impairment losses recorded at the end of the previous fiscal year also contributed to profit.
-
Specialty Functional Materials (Electronic Materials, etc.) : Strong demand continued across a wide range of fields for BT materials used in semiconductor packaging, and sales volume for OPE® substrate materials for AI servers increased significantly.
-
Engineering Plastics : Profit increased due to successful price pass-through against rising raw material costs, the securing of a timely supply chain, and inventory valuation effects.
6. Steady Growth of Mid-Term Management Plan Pillars: "U&P" and "ICT3" Businesses
Under the mid-term management plan "Grow UP 2026," the company is prioritizing the allocation of management resources to its U&P (Uniqueness & Presence) businesses , which boast high profitability, growth potential, and competitive differentiation.
Rationale for Slide Selection and Data Analysis
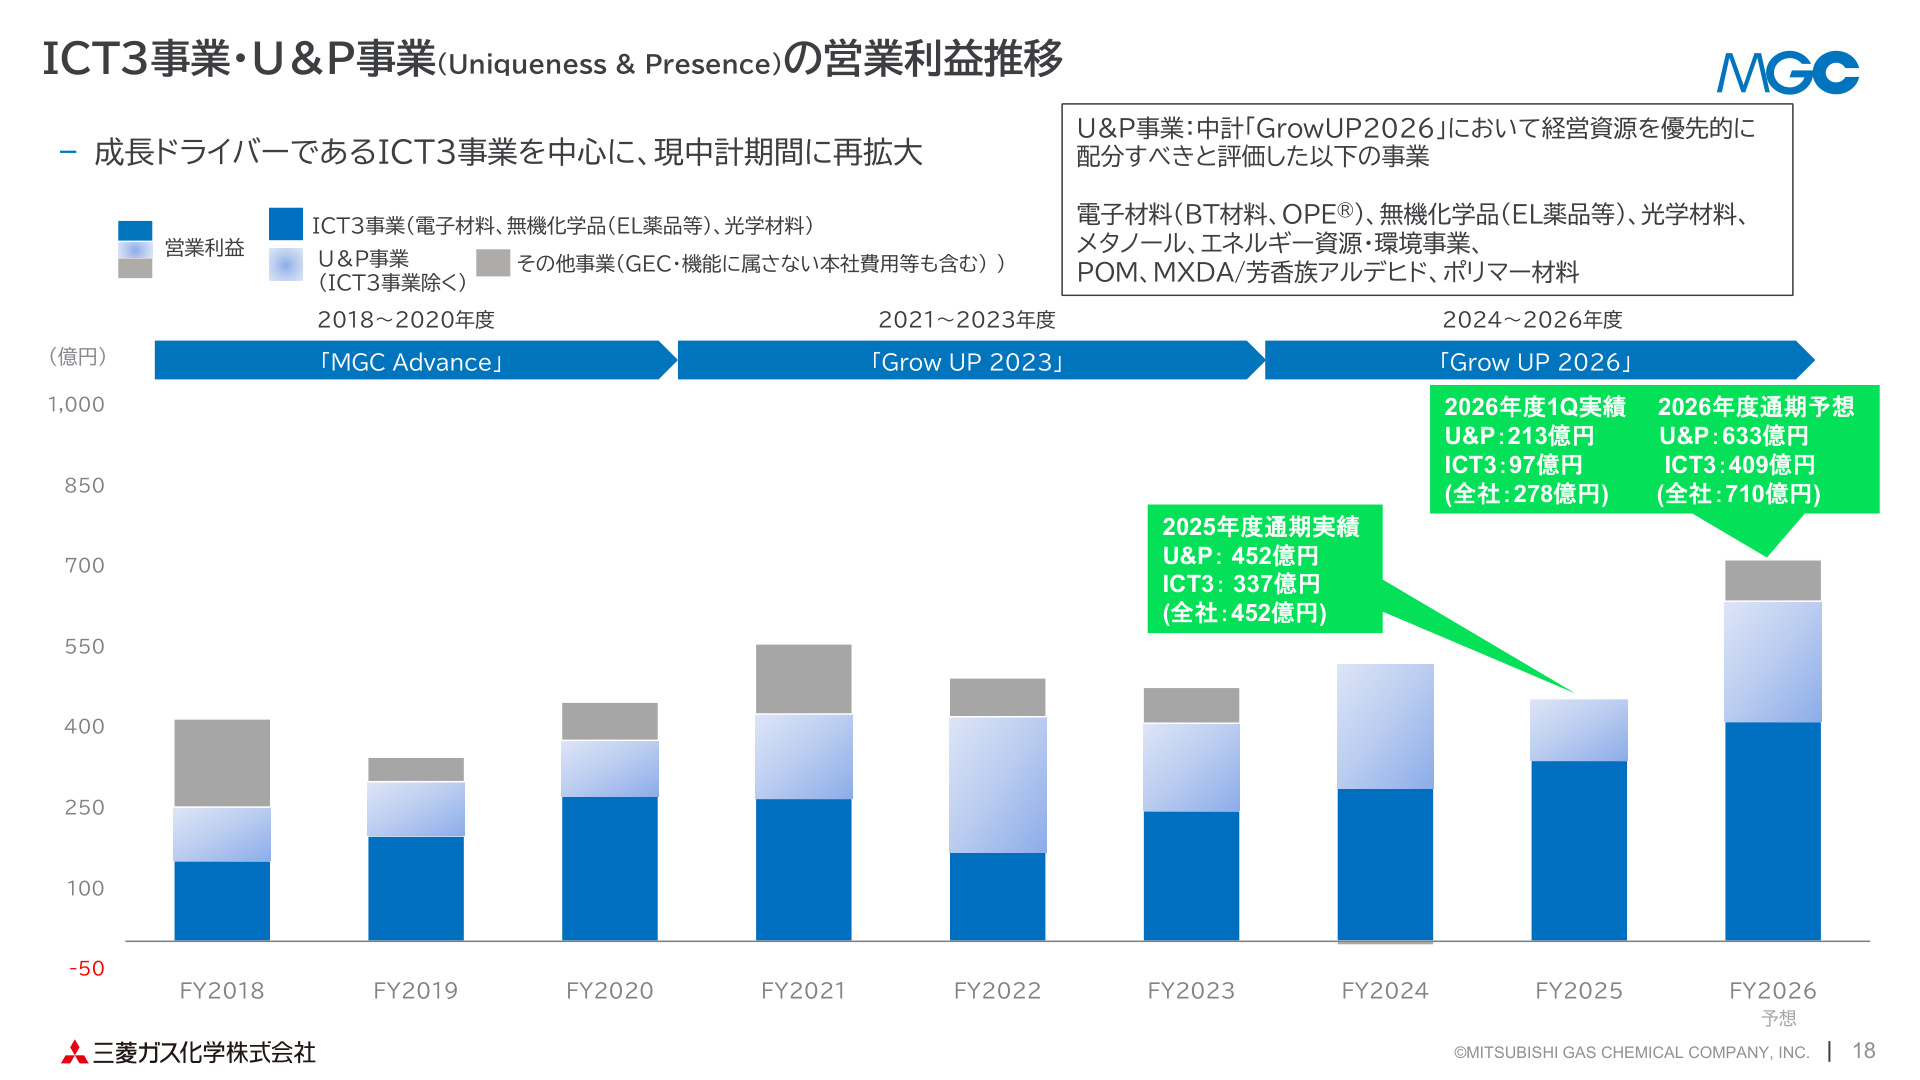
The slide above shows the operating profit trends for the company's long-term growth drivers, the "ICT3" and "U&P" businesses. This is a key indicator of the progress made in shifting from cyclical general-purpose chemicals to a high-value-added business structure.
- U&P Business Achievements : Out of the total company operating profit of ¥27.8 billion in Q1 FY2026, the U&P business generated ¥21.3 billion . It is projected to account for ¥63.3 billion (approximately 89% of the total) out of the full-year forecast of ¥71.0 billion.
- ICT3 Business (Growth Driver) : Within the U&P segment, the "ICT3 business" (electronic materials, EL chemicals, and optical materials) for semiconductors and smartphones is a primary growth driver. It recorded an operating profit of ¥9.7 billion in Q1 and is planned to reach ¥40.9 billion for the full year, reflecting the company's strengths in global market-leading products like BT materials and ultra-pure hydrogen peroxide.
7. Full-Year FY2026 Guidance Upgrade and H1/H2 Earnings Imbalance
Due to the Q1 progress significantly exceeding expectations, the company has upwardly revised its full-year FY2026 earnings forecast.
Rationale for Slide Selection and Data Analysis
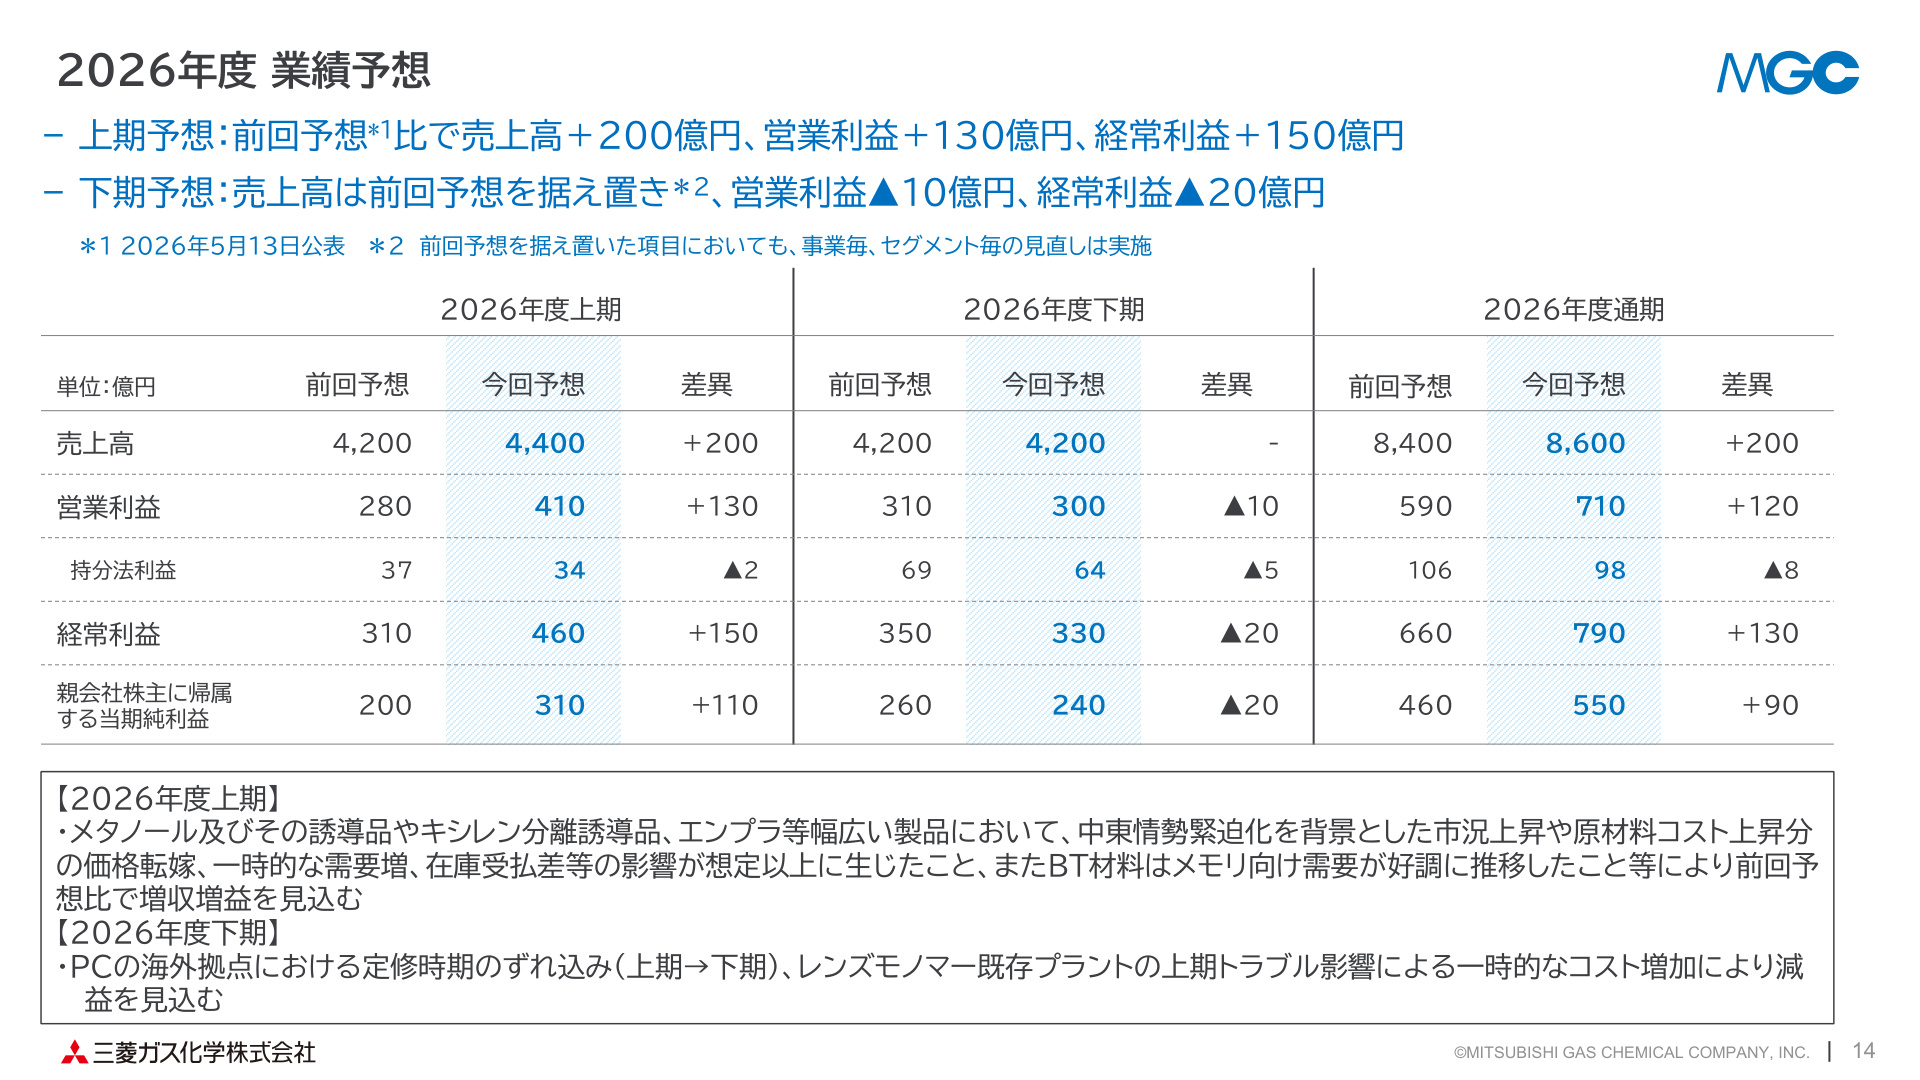
This slide presents the overall picture of the revised full-year forecast and the detailed breakdown of revisions for the first and second halves (compared to previous forecasts and prior-year results), which is essential for understanding future performance and potential risks.
Full-Year Forecast Revisions (vs. Previous Forecast)
- Net Sales : ¥860.0 billion (+¥20.0 billion)
- Operating Profit : ¥71.0 billion (+¥12.0 billion)
- Ordinary Profit : ¥79.0 billion (+¥13.0 billion)
- Profit Attributable to Owners of Parent : ¥55.0 billion (+¥9.0 billion)
Structure of H1-Weighted Performance
Almost the entire upward revision is due to the outperformance of H1 (Q1–Q2) results and forecasts .
- H1 Operating Profit : ¥41.0 billion (+¥13.0 billion vs. previous forecast)
- H2 Operating Profit : ¥30.0 billion (-¥1.0 billion vs. previous forecast)
The cautious outlook for H2 is based on the following factors:
- Methanol Market Adjustment : Anticipating a decline in market prices from $450/MT in H1 to $345/MT in H2.
- Increased Costs from Periodic Maintenance : Large-scale periodic maintenance (turnarounds) scheduled for facilities such as the Mizushima Plant in H2.
- Risks of Maintenance Delays and Production Issues : Potential cost increases due to shifts in the timing of overseas polycarbonate plant maintenance and temporary issues at existing optical lens monomer plants in H1.
8. Q2 Outlook: Anticipated Temporary Profit Decline Due to Market Rebound and Maintenance
While Q1 achieved a very high operating profit of ¥27.8 billion, the operating profit forecast for the second quarter (Q2) is ¥13.1 billion (-52.8% QoQ) .
This decline is primarily due to the following factors:
- Rebound from Market Spikes : The positive impact of inventory valuation effects from the methanol price surge in Q1 will dissipate in Q2.
- Deteriorating Spreads in Energy & Resources : Narrowing spreads in the power generation business and a decrease in iodine production volume.
- Impact of Periodic Maintenance : Increased fixed costs associated with turnarounds in engineering plastics and other areas.
However, demand for core businesses such as BT materials , semiconductor EL chemicals , and optical resin polymers for smartphones is expected to remain robust.
9. Capital Policy and Shareholder Returns: Progressive Dividend Policy and Planned Increase to ¥110
The company is steadfastly executing the shareholder return policy outlined in the "Grow UP 2026" mid-term management plan.
- Return Policy : Based on a progressive dividend policy , with a target of 50% total return ratio and 3% DOE (Dividend on Equity) .
- FY2026 Dividend Plan : The annual dividend is planned at ¥110 per share (¥55 interim, ¥55 year-end), an increase of ¥10 from the previous fiscal year (¥100).
- Stable Return Track Record : The company has a history of not cutting dividends and consistently raising payout levels regardless of performance fluctuations, demonstrating a shareholder-centric approach.
10. Conclusion and Mid-to-Long-Term Growth Story
Mitsubishi Gas Chemical's Q1 FY2026 results demonstrate not only the ability to capture short-term tailwinds from methanol market spikes due to geopolitical risks but also prove that the structural reforms toward high-value-added businesses (expansion of U&P and ICT3 businesses) are yielding tangible results.
While a cautious outlook is maintained for H2 due to market normalization and maintenance costs, the company's unique strengths—such as BT materials, OPE®, and ultra-pure hydrogen peroxide, which grow alongside the AI server and advanced semiconductor packaging markets—provide a solid foundation. The company is successfully navigating short-term market volatility while steadily advancing its story of transitioning into a high-profitability entity over the mid-to-long term.
This content is not intended as investment advice or a recommendation. Any opinions expressed are solely the personal views of each article.