

![[Earnings Analysis] Mugen Estate (3299) H1 FY2026: Strategic Shift Toward Regional Expansion Amid Slowdown in High-End and Overseas Demand](https://news-images.stock-club.net/market_news/images/3299/140120260804507701/slide_eyecatch_en_fd1c727f.webp)
[Earnings Analysis] Mugen Estate (3299) H1 FY2026: Strategic Shift Toward Regional Expansion Amid Slowdown in High-End and Overseas Demand

StockClub
Published: Aug 07, 2026, 10:23 AM
Sentiment Analysis

1. Earnings Highlights and Overview
Mugen Estate Co., Ltd. reported consolidated financial results for the first half of the fiscal year ending December 2026, with net sales of 26,743 million yen (down 18.8% YoY), operating profit of 2,773 million yen (down 49.4% YoY), ordinary profit of 2,142 million yen (down 56.6% YoY), and interim net profit attributable to owners of the parent of 1,320 million yen (down 60.2% YoY). The company experienced a significant decline in both revenue and profit compared to the same period last year.
The primary factor behind these results is the continued cautious purchasing stance among domestic and international investors due to shifts in the real estate market environment. Specifically, the slowdown in sales progress for high-end and large-scale properties , coupled with waning demand from overseas investors , weighed heavily on performance. Conversely, positive structural changes were observed, such as expanded sales in regional areas and steady growth in the leasing and other businesses. Taking these factors into account, the company has announced a downward revision to its full-year consolidated earnings forecast and year-end dividend forecast.
2. Detailed Analysis of Consolidated Results and Profit Pressures
We examine the trends in profit and loss indicators for 2Q and the underlying financial factors contributing to the changes.
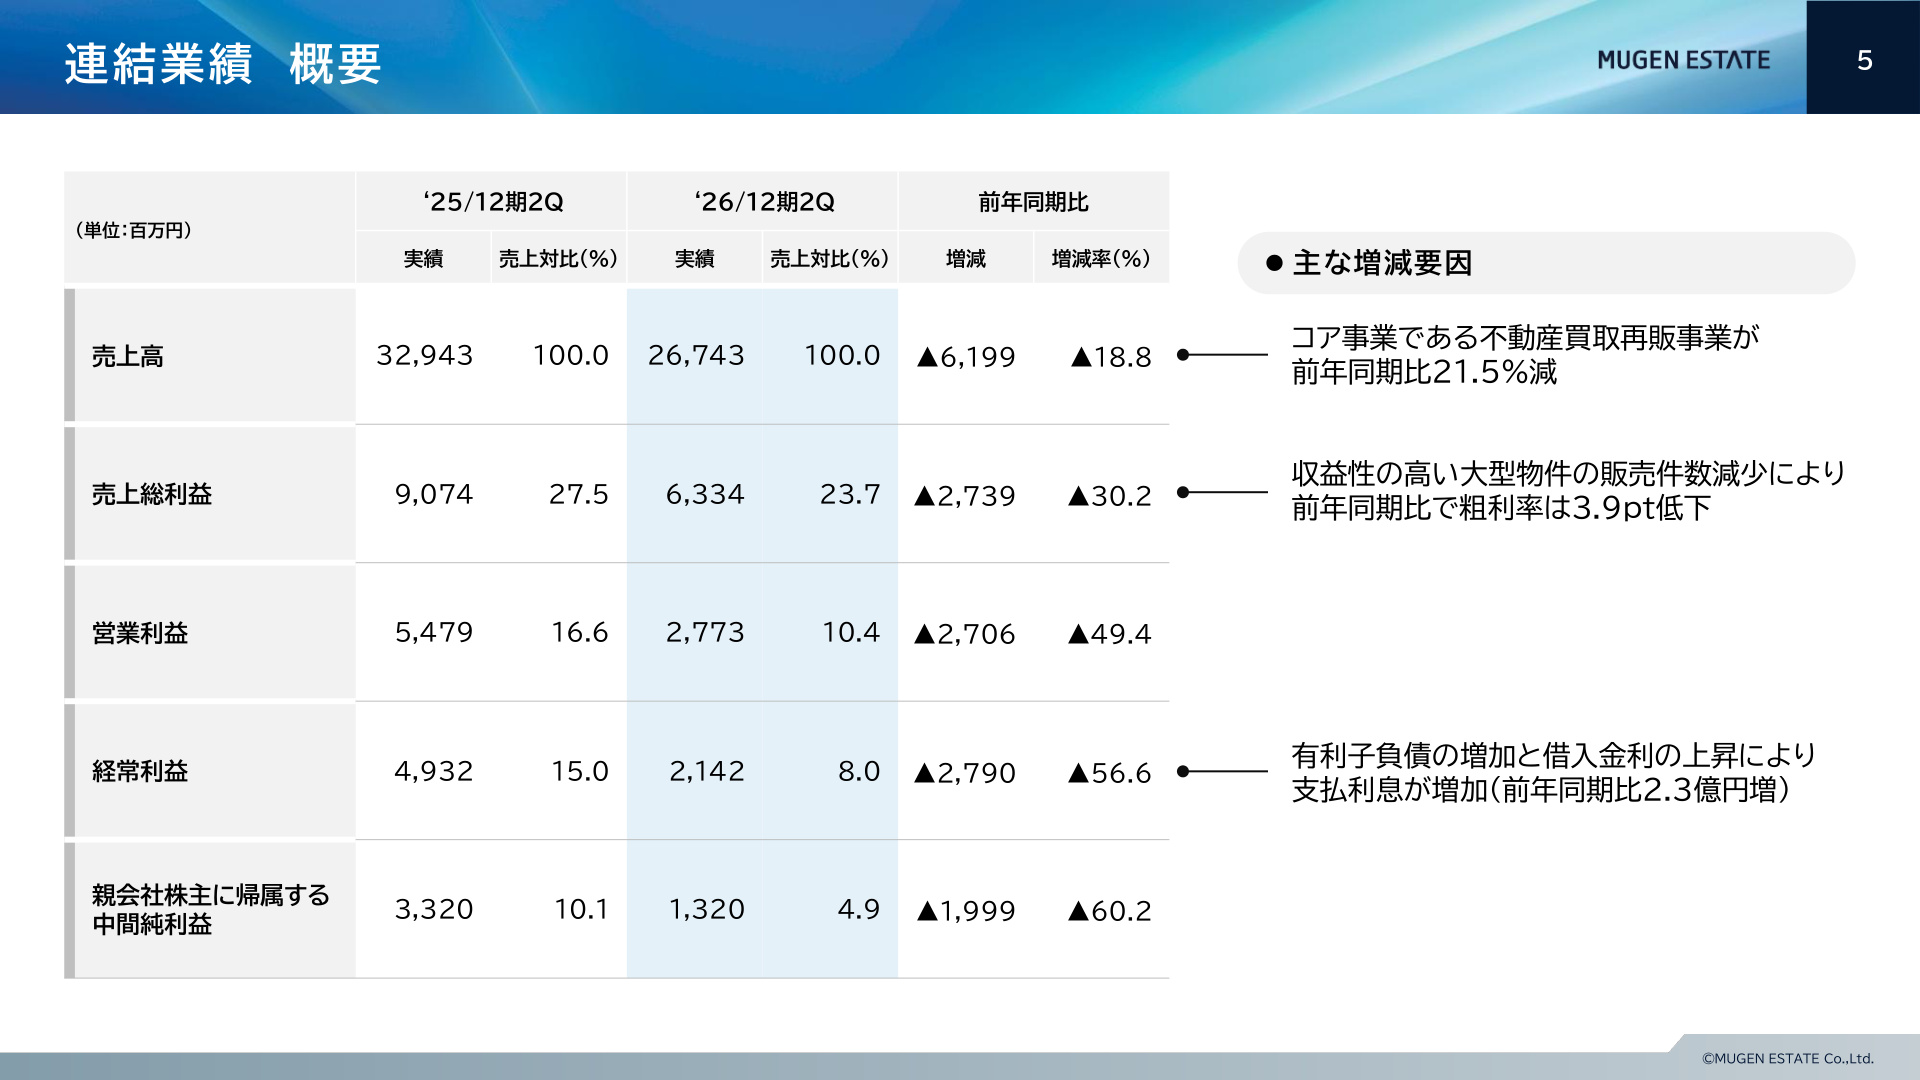
The slide above (PAGE 4) summarizes the consolidated income statement for 2Q FY2026 and highlights the primary drivers of change. This slide is critical as it visually illustrates the structure where the decline in net sales directly translates into a contraction of gross profit, while interest expenses associated with interest-bearing debt further suppress ordinary profit.
Specifically, gross profit fell by 30.2% YoY (down 2,739 million yen) to 6,334 million yen. This was primarily due to a decrease in sales in the core real estate purchase and resale business, as well as a decline in the number of high-margin, large-scale property sales, which caused the gross profit margin to drop by 3.9 percentage points from 27.5% in the same period last year to 23.7%.
At the operating profit level, although SG&A expenses were contained at 3,561 million yen (down 33 million yen YoY), they were insufficient to offset the decline in gross profit, leaving operating profit at 2,773 million yen (down 49.4% YoY). Furthermore, regarding ordinary profit, interest expenses increased by 230 million yen YoY due to an increase in interest-bearing debt and rising borrowing rates , acting as an additional pressure factor and resulting in a severe decline in ordinary profit to 2,142 million yen (down 56.6% YoY).
3. Sales Trends by Segment and Business
Total sales for the core real estate trading business reached 24,965 million yen (down 20.9% YoY). A detailed breakdown reveals clear disparities based on target customers and asset types.
- Purchase and Resale Business (Investment): Sales remained nearly flat at 12,531 million yen (up 1.8% YoY). While the contribution to 2Q performance was limited, sales strategies targeting domestic investors proved successful, with sales of single-building income properties in the core price range outperforming the same period last year. The average selling price remained stable at 126.5 million yen (down 1.3% YoY).
- Purchase and Resale Business (Residential): Sales dropped significantly to 12,068 million yen (down 36.5% YoY). Although the number of units sold increased steadily to 215 (up 2.4% YoY), the primary cause of the revenue decline was that high-end properties, which performed well in the previous year, failed to move, causing the average selling price to fall by 38.0% from 90.5 million yen in the same period last year to 56.1 million yen.
- Sales to Overseas Investors: Demand from overseas investors remained limited, with sales falling to 6,080 million yen (down 57.1% YoY) and the number of units sold dropping to 64 (down 22.9% YoY). Consequently, the proportion of sales to overseas investors in total revenue has declined to approximately 25%.
- Leasing and Other Businesses: Sales grew steadily to 1,777 million yen (up 30.1% YoY), and segment profit reached 456 million yen (up 21.9% YoY). Rental income during the holding period of real estate for sale and an increase in fixed assets contributed to earnings.
4. Strategic Shift by Region: Rapid Sales Expansion in Regional Areas
In response to the stagnation of large-scale, high-end properties in central Tokyo, the company is strategically accelerating its expansion into regional areas.
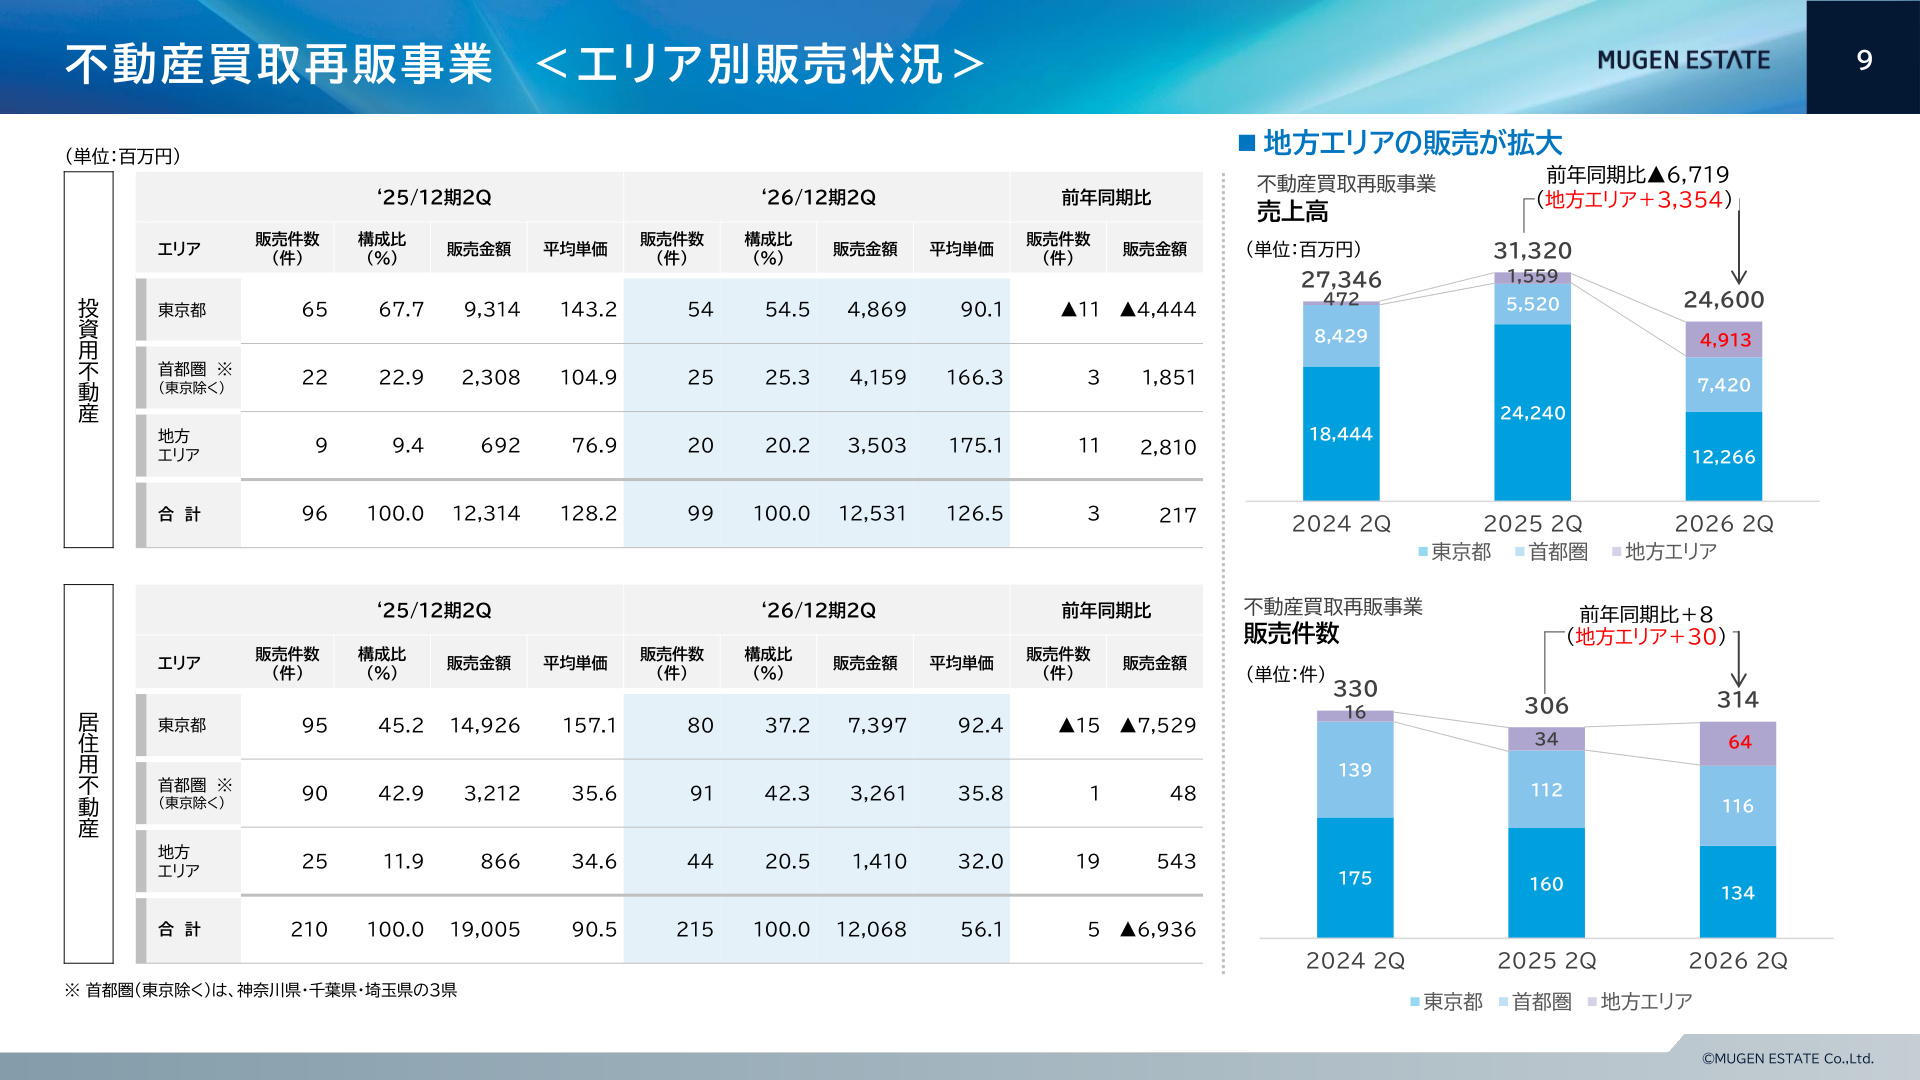
The slide above (PAGE 8) clearly shows the sales performance and changes in the composition of the real estate purchase and resale business by area. The key takeaway from this data is the fact that while reliance on central Tokyo sales is decreasing, regional areas and the Tokyo metropolitan area (excluding Tokyo) are beginning to function as clear growth drivers.
In the investment real estate sector, while sales in Tokyo fell to 4,869 million yen (down 4,444 million yen YoY), sales in regional areas expanded rapidly to 3,503 million yen (up 2,810 million yen YoY, 20 units sold). The Tokyo metropolitan area (excluding Tokyo) also showed steady growth, with sales of 4,159 million yen (up 1,851 million yen YoY).
A similar trend was observed in residential real estate, where sales in regional areas increased to 1,410 million yen (up 543 million yen YoY) with 44 units sold (compared to 25 units in the same period last year). Total sales in regional areas across the entire purchase and resale business reached 4,913 million yen (up 215.1% YoY, +3,354 million yen), with 64 units sold (an increase of 30 units YoY) , indicating that risk hedging through regional diversification and demand cultivation is progressing rapidly.
5. Analysis of Assets, Procurement Trends, and Financial Base
We verify the status of procurement and inventory, which are the sources of growth for a real estate company, as well as the safety of the balance sheet.
-
Procurement and Inventory Trends by Business: Procurement in 2Q totaled 22,256 million yen (down 4.5% YoY). While curbing residential procurement (7,447 million yen, down 36.4% YoY), the company has expanded investment property procurement to 14,103 million yen (up 16.3% YoY) , where demand remains strong. As a result, the inventory balance of real estate for sale has steadily accumulated to 80,982 million yen (up from 75,600 million yen at the end of 4Q 2025), indicating that a rich pipeline for future sales has been secured.
-
Financial Base and Interest-Bearing Debt Structure: Total assets reached 110,277 million yen (up 3.4% from the end of the previous fiscal year). Long-term borrowings increased due to the acquisition of investment properties, bringing non-current liabilities to 46,201 million yen (up 12.9% from the end of the previous fiscal year). As key KPIs for financial soundness, the equity ratio is 32.3% (target KPI range: 30.0%–35.0%) and the net D/E ratio is 1.36x (target KPI range: 1.2x–1.5x), both maintained within target ranges. Furthermore, by extending the average borrowing period for investment properties from 3 years and 2 months to 3 years and 8 months , the company is enhancing its resilience against interest rate fluctuations and market liquidity risks.
6. Downward Revision of Full-Year Earnings Forecast and Second-Half Strategy
Based on the progress in the first half and the outlook for the market, the company has revised its full-year consolidated earnings forecast downward.
- Revised Full-Year Earnings Forecast (FY ending Dec 2026):
- Net Sales: 61,599 million yen (down 22.3% from previous forecast, down 9.8% YoY)
- Operating Profit: 8,588 million yen (down 30.7% from previous forecast, down 22.3% YoY)
- Ordinary Profit: 7,237 million yen (down 34.6% from previous forecast, down 27.3% YoY)
- Net Profit: 4,770 million yen (down 37.2% from previous forecast, down 28.4% YoY)
As of the end of 2Q, the progress rate against the revised full-year forecast is 43.4% for net sales and 32.3% for operating profit. Although the progress rate appears slightly low, the company plans to accumulate profits through a sales plan weighted toward the second half and the execution of flexible strategies.
Key Policy Measures for the Second Half:
- Breaking away from reliance on overseas investors and strengthening sales to domestic investors and end-users (general consumers).
- Diversifying sales channels by strengthening cooperation with financial institutions, including regional banks.
- Improving turnover rates by implementing flexible pricing strategies in response to market conditions.
- Early leasing and value-up of completed properties in development projects (e.g., the SIDEPLACE series).
7. Shareholder Return Policy and Dividend Forecast Changes
In conjunction with the revision of earnings forecasts, the company has presented new figures regarding shareholder returns.
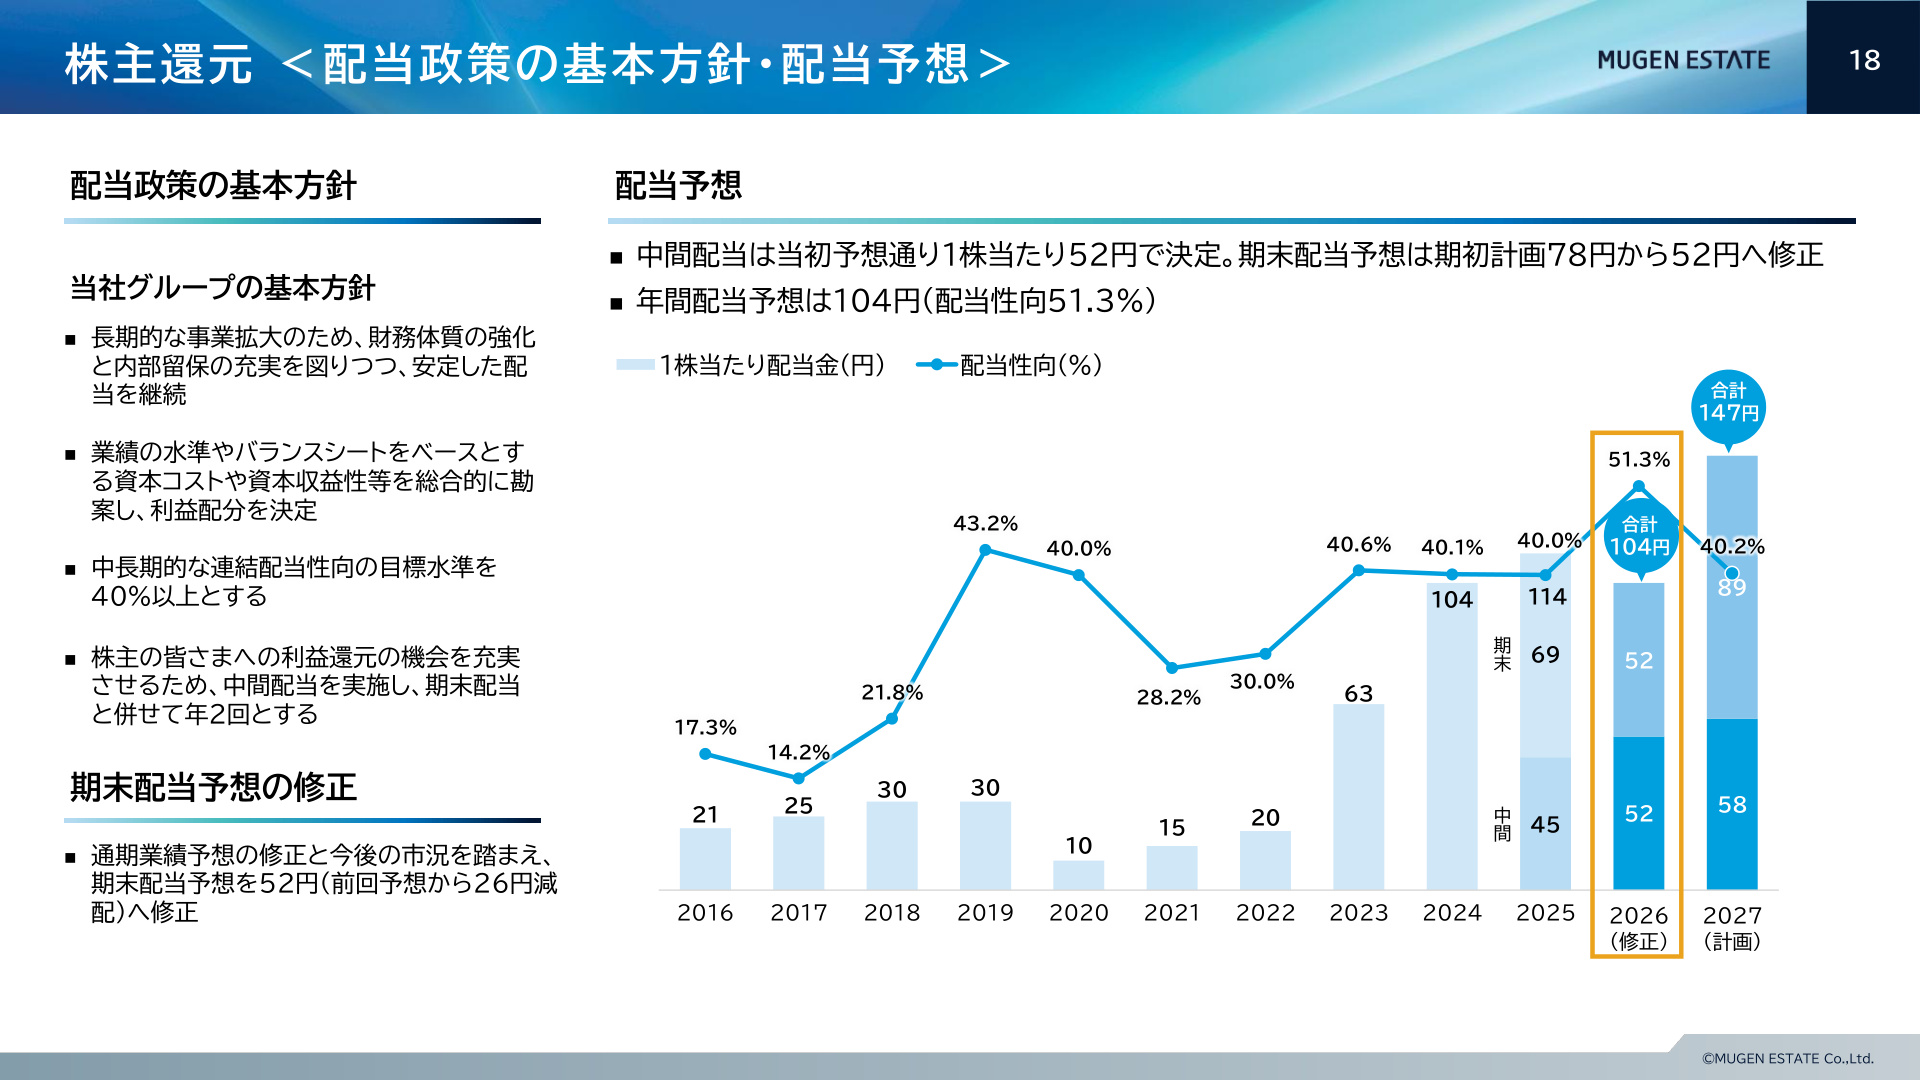
The slide above (PAGE 17) shows the basic policy of the company's dividend policy and the trend of dividend forecasts. The important context for this slide is that while the year-end dividend forecast has been revised downward in line with the downward revision of the full-year earnings forecast, the company strictly adheres to its medium- to long-term return policy of a consolidated dividend payout ratio of 40% or more, resulting in a high return level of 51.3%.
Specifically, the interim dividend was set at 52 yen per share , as originally planned. On the other hand, due to the downward revision of the full-year earnings forecast, the year-end dividend forecast has been revised to 52 yen , a reduction of 26 yen from the initial plan of 78 yen.
As a result, the annual dividend forecast is 104 yen per share (compared to 114 yen in the previous year). Although the dividend amount itself will decrease in response to the decline in earnings, the revised expected consolidated dividend payout ratio reaches 51.3% , confirming that the dividend setting is strongly conscious of the shareholder return stance.
8. Conclusion and Future Outlook
Mugen Estate's financial results for the second quarter of the fiscal year ending December 2026 were impacted by external factors, including changes in the interest rate environment, a decline in demand from overseas investors, and stagnation in the high-end market in central Tokyo.
However, a closer look reveals that a clear solution— sales expansion in regional areas (up 215.1% YoY) —is beginning to function, indicating that the geographical and attribute-based diversification of the business portfolio is progressing. Furthermore, inventory of real estate for sale remains abundant at 80,982 million yen, and financial soundness indicators such as the equity ratio (32.3%) remain in a healthy range.
Moving forward, the greatest points of interest in the company's earnings recovery story will be whether flexible pricing strategies for the second half and the development of sales channels for domestic investors and end-users proceed as planned, and how the liquidation speed of the accumulated inventory changes.
This content is not intended as investment advice or a recommendation. Any opinions expressed are solely the personal views of each article.