


Kuroda Group Q1 FY2027 Earnings Deep Dive: Riding the Wave of Strong Data Center Demand to Achieve a 152% Surge in Operating Profit

StockClub
Published: Aug 07, 2026, 10:17 AM
Sentiment Analysis
Kuroda Group (Securities Code: 287A) reported a strong increase in both revenue and profit for the first quarter of the fiscal year ending March 2027 , bolstered by the explosive global expansion in data center demand driven by the rapid adoption of generative AI. Both the core manufacturing and trading businesses showed significant growth.
This report selects 10 key topics from the published earnings materials to provide a comprehensive analysis of the company's current performance, the structure of profit fluctuations, segment-specific details, and the full-year outlook.
1. Overview of Q1 Results and Key Performance Indicators (KPIs)
The consolidated financial results (IFRS) for the first quarter demonstrated not only the effects of revenue growth but also a significant improvement in business profitability.
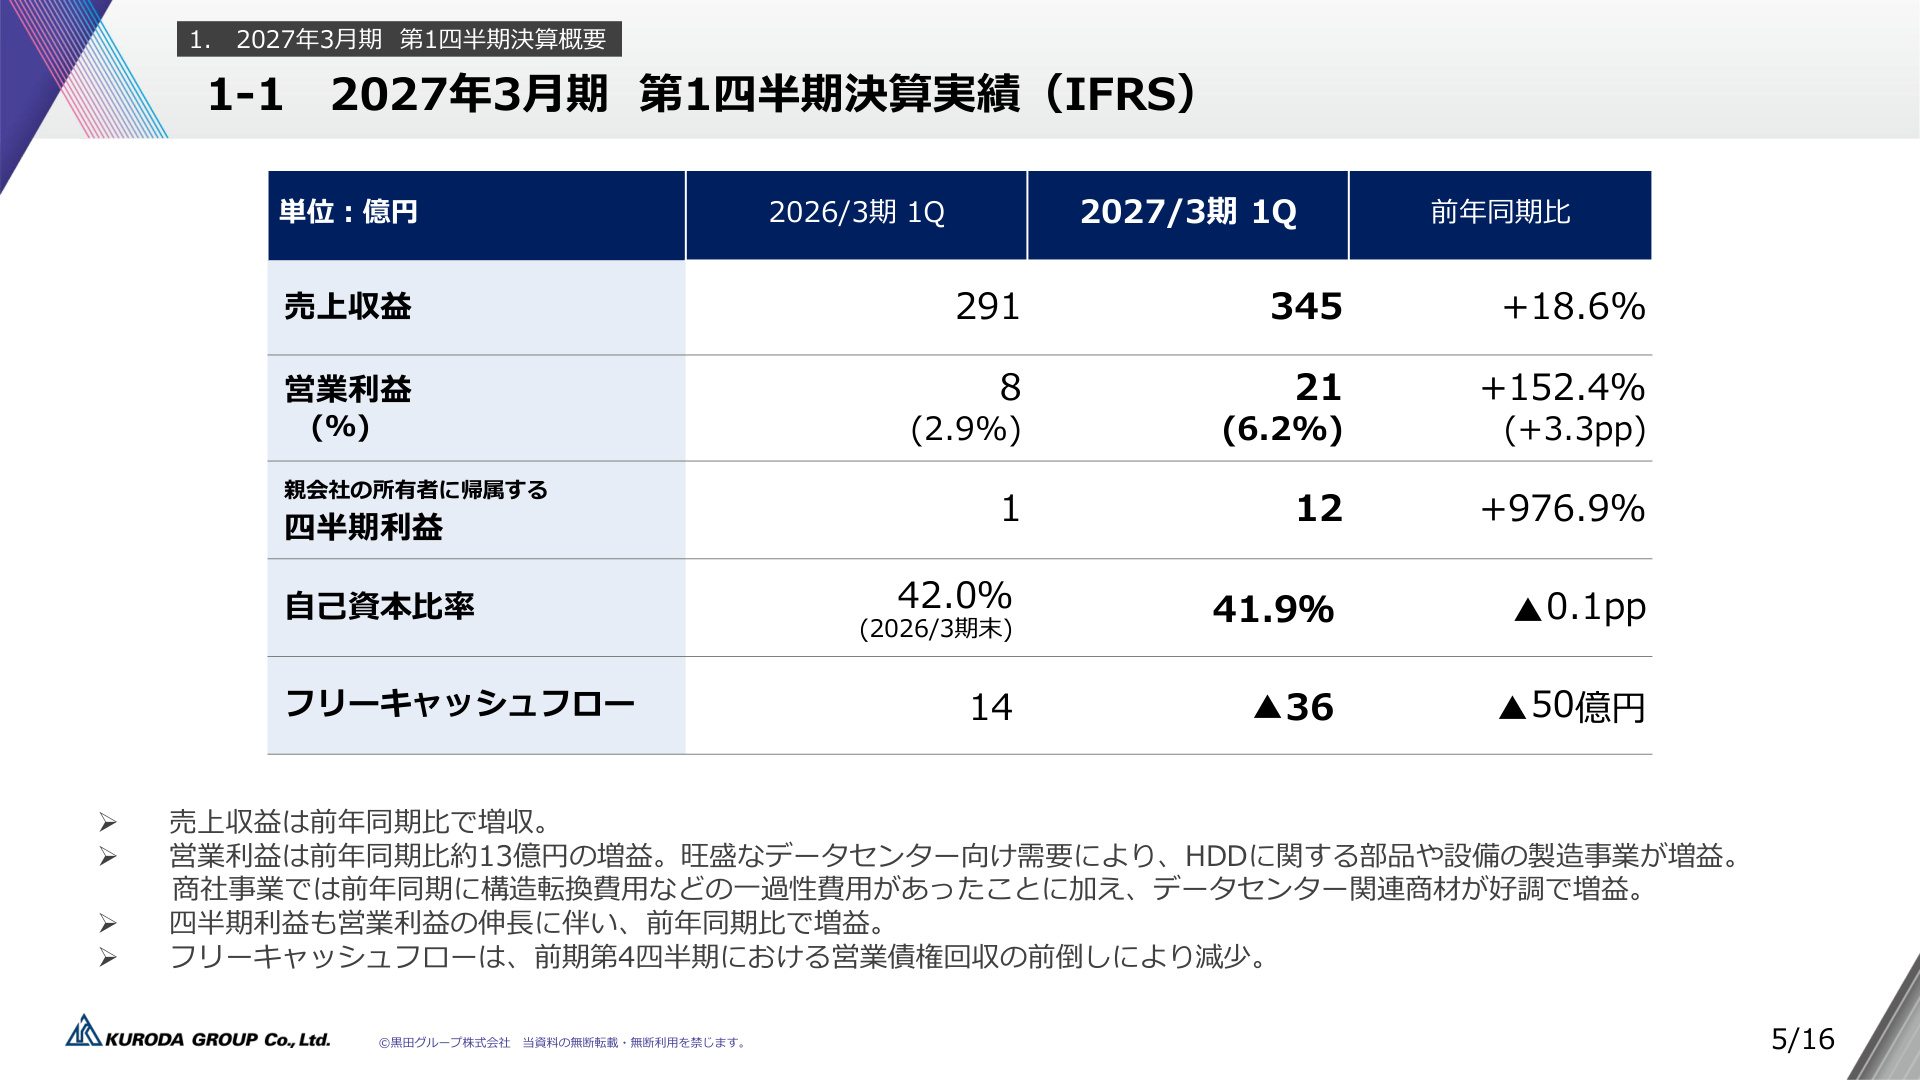
- Revenue : ¥34.5 billion (+18.6% YoY)
- Operating Profit : ¥2.1 billion (+152.4% YoY)
- Operating Profit Margin : 6.2% (up 3.3 percentage points from 2.9% in the same period last year)
- Profit Attributable to Owners of the Parent : ¥1.2 billion (+976.9% YoY)
The following slide summarizes the key figures for the consolidated Q1 results.
Slide Commentary and Data Background
This slide illustrates at a glance how rapidly the company's performance has recovered and expanded. While operating profit stood at ¥0.8 billion in the same period last year, it has surged approximately 2.5 times to ¥2.1 billion this term. More notable than the 18.6% increase in revenue is the expansion of the operating profit margin from 2.9% to 6.2% . This is the result of a dual effect: an increased ratio of high-value-added products and materials for data centers, and the disappearance of one-time expenses incurred in the previous fiscal year. Profit attributable to owners of the parent also jumped significantly from ¥0.1 billion in the same period last year to ¥1.2 billion .
2. Detailed Analysis of Operating Profit Drivers
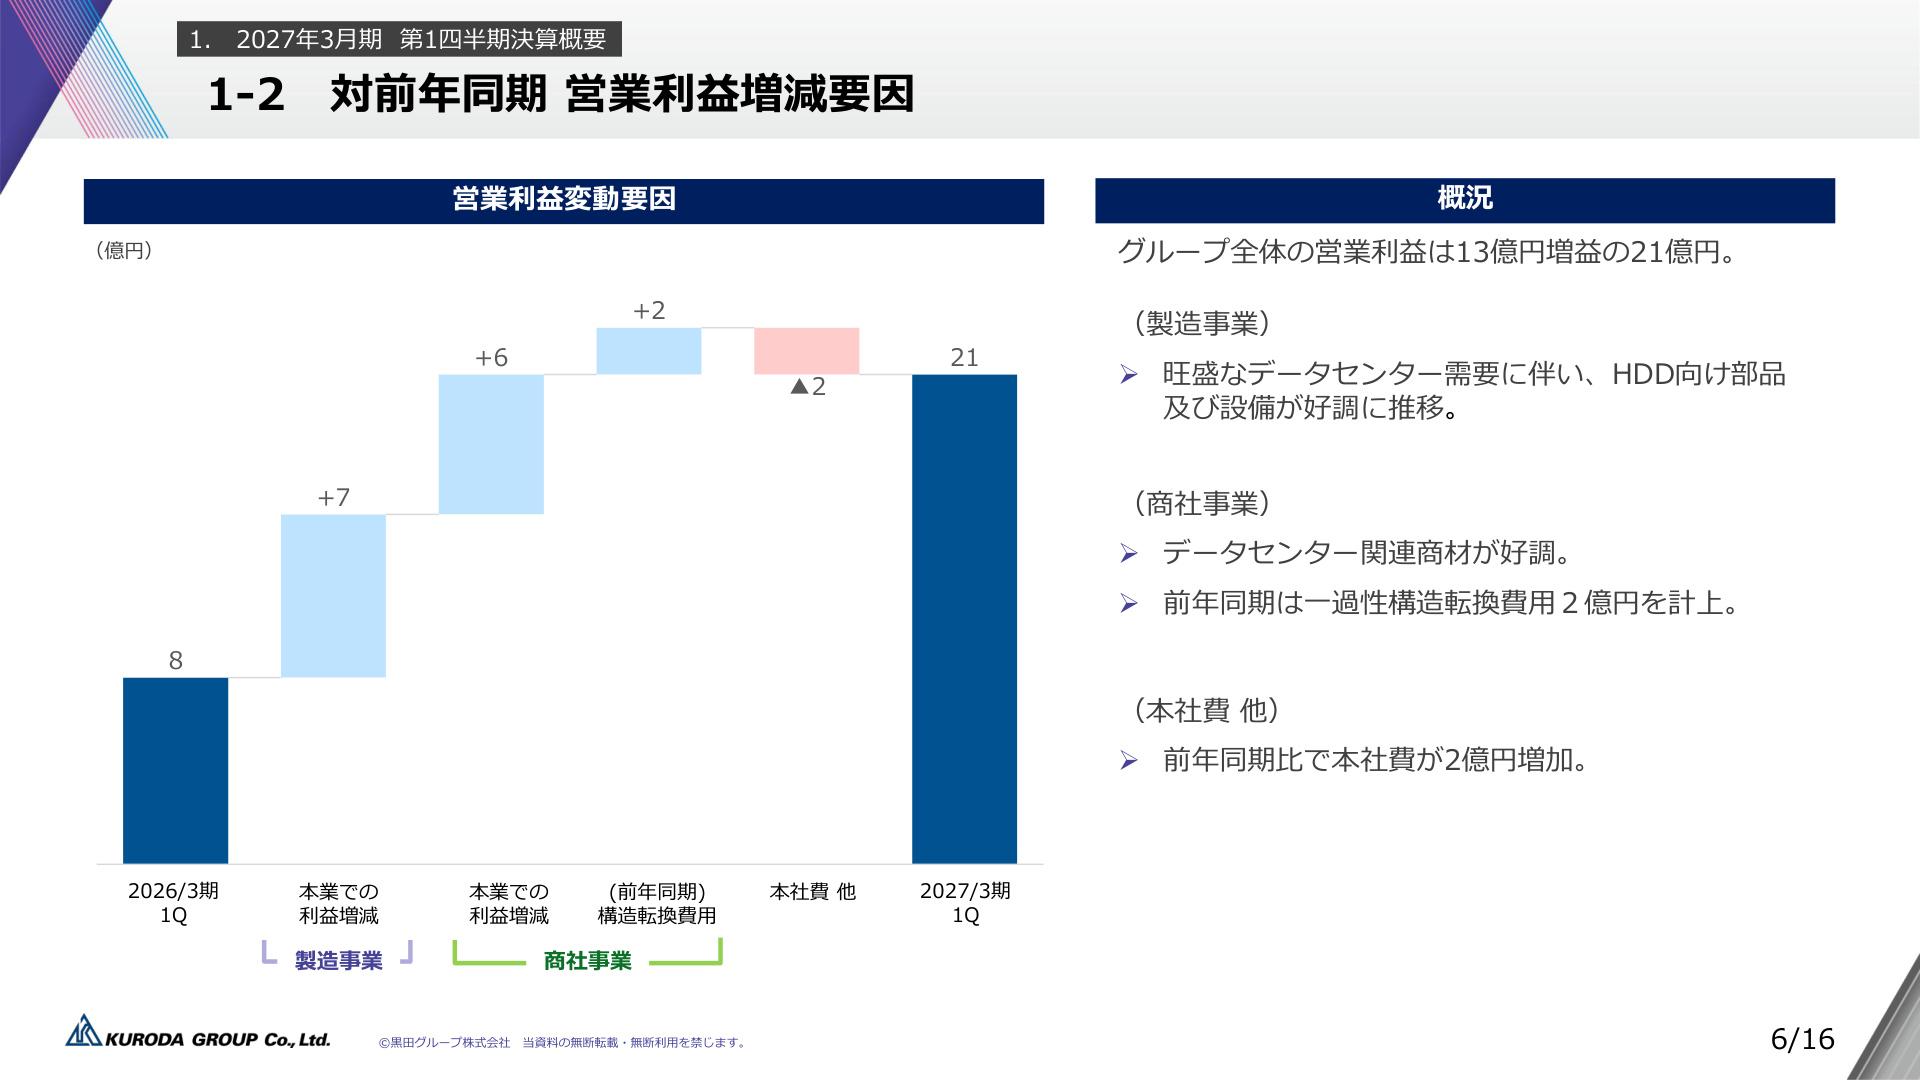
A breakdown of the ¥1.3 billion increase in operating profit—from ¥0.8 billion in the same period last year to ¥2.1 billion this term—reveals a structure of improved profitability across the company's entire business portfolio.
The following slide is a waterfall chart showing the factors behind the operating profit fluctuation.
Slide Commentary and Data Background
Key takeaways from this variance analysis include:
- Growth in Core Manufacturing Business (+¥0.7 billion) : Strong shipments of HDD-related components and automated equipment for data centers significantly boosted gross profit for the manufacturing segment.
- Growth in Core Trading Business (+¥0.6 billion) : Driven by increased demand for data center peripheral components and semiconductor manufacturing equipment in Japan.
- Elimination of Prior-Year One-Time Expenses (+¥0.2 billion) : The ¥0.2 billion in structural reform costs recorded in the trading business during the same period last year did not recur, acting as a positive factor for profit.
- Increase in Head Office Expenses (▲¥0.2 billion) : While head office costs rose by ¥0.2 billion due to administrative costs and upfront investments associated with group-wide business expansion, the profit growth from both core businesses (totaling +¥1.3 billion) far outweighed this.
3. Segment Trends ①: Profitability Improvement and Growth Drivers in Manufacturing
In the Manufacturing segment , Q1 revenue reached ¥9.8 billion (a significant increase from ¥7.3 billion in the same period last year), with operating profit of ¥1.3 billion (up from ¥0.7 billion). The operating profit margin rose sharply from 9.3% to 13.5% .
Performance by major product category is as follows:
- LCD Production Materials : Sales of alignment film printing plates remained largely flat year-on-year. Preparations for the operation of a new factory in China are currently underway. Factory automation equipment saw strong growth, driven by HDD-related demand for data centers.
- Electrical Construction Materials : Sales increased year-on-year as a result of strengthened sales efforts for new products. Furthermore, preemptive buying demand due to concerns over rising raw material prices and shortages caused by escalating tensions in the Middle East also supported revenue growth.
- HDD Components : The strong trend from Q4 of the previous fiscal year continued, with a notable increase in sales of various components for high-capacity HDDs used in data centers. The transfer of filter production to the Thailand factory , part of structural reforms to improve profitability, is proceeding with a target for completion within the year.
- Other Areas : Circuit design/contract development and aluminum die-casting businesses remained at the same level as the previous year. The automotive resin molding mold business showed an upward trend in sales to major customers.
4. Segment Trends ②: Capturing Demand and Growth Trajectory in Trading
In the Trading segment , Q1 revenue was ¥25.4 billion (¥22.2 billion in the same period last year), and operating profit was ¥1.2 billion (¥0.5 billion in the same period last year). The operating profit margin improved sharply from 2.0% to 4.9% .
Topics by area in the trading business include:
- Automotive Sector : Sales of electronic components for multimedia applications grew steadily. Negative impacts from the supply-demand tightness of rare earths and semiconductor materials, which had been a market concern, have not materialized at this stage.
- Domestic/Overseas Regions : Sales expanded primarily in Japan , capturing demand for peripheral components for cloud providers and data center construction, as well as materials for semiconductor manufacturing equipment.
- Structural Reform Effects : As mentioned above, the elimination of the ¥0.2 billion in structural reform costs recorded in the same period last year directly contributed to the jump in profit margins.
5. Consolidated Financial Position and Cash Flow
Financial Position (Balance Sheet)
- Total Assets : ¥99.9 billion as of the end of Q1 FY2027 (+¥1.9 billion from the end of the previous fiscal year).
- Major Asset Changes : Cash and deposits decreased from ¥17.3 billion to ¥12.4 billion , while trade receivables increased from ¥23.6 billion to ¥28.7 billion due to business expansion. Inventories also increased slightly from ¥11.9 billion to ¥12.5 billion .
- Equity Ratio : 41.9% (down 0.1 percentage points from 42.0% at the end of the previous fiscal year, maintaining a sound financial level).
Cash Flow (CF)
- Free Cash Flow : ▲¥3.6 billion (+¥1.4 billion in the same period last year).
- Reasons for CF Decline : This is a temporary phenomenon resulting from the reversal of the early collection of trade receivables implemented in Q4 of the previous fiscal year (FY2026), and does not indicate a decline in the company's fundamental cash-generating ability.
6. Full-Year Earnings Forecast and Dividend Policy (No Changes)
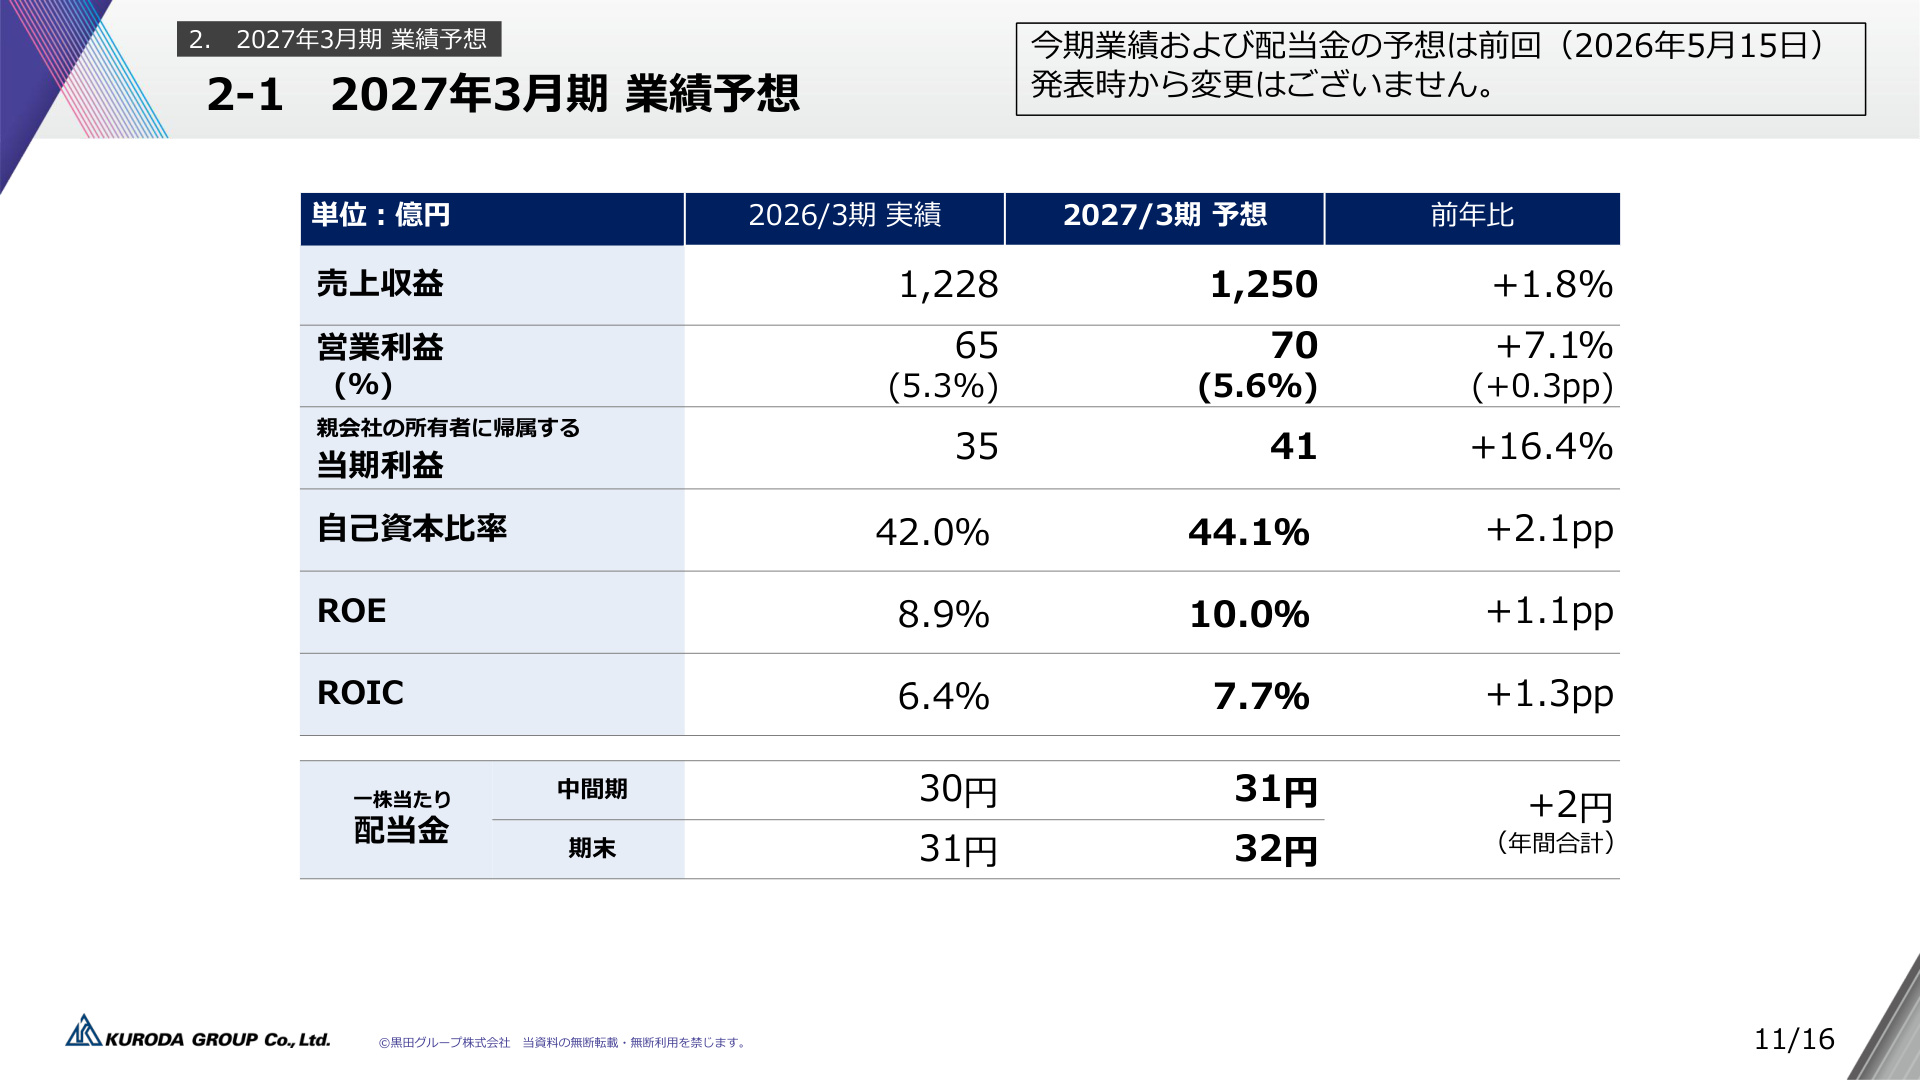
The full-year consolidated earnings forecast and dividend forecast for the fiscal year ending March 2027 remain unchanged from the figures announced on May 15, 2026.
The following slide summarizes the full-year earnings forecast and target financial indicators.
Slide Commentary and Data Background
This slide shows the final goals the company is aiming for this fiscal year:
- Revenue : ¥125.0 billion (+1.8% YoY)
- Operating Profit : ¥7.0 billion (+7.1% YoY, Operating Profit Margin 5.6%)
- Profit for the Period : ¥4.1 billion (+16.4% YoY)
- ROE (Return on Equity) : 10.0% (up 1.1 percentage points from 8.9%)
- ROIC (Return on Invested Capital) : 7.7% (up 1.3 percentage points from 6.4%)
- Annual Dividend : ¥63 (Interim ¥31, Year-end ¥32; a planned increase of ¥2 from the previous year's ¥61)
With an operating profit of ¥2.1 billion achieved in Q1, the progress rate against the full-year target of ¥7.0 billion is 30.0% , marking a very smooth start.
7. Full-Year Segment Outlook and Operating Profit Scenarios
Key points regarding the full-year business breakdown and operating profit scenarios are as follows:
Segment Forecast Breakdown
- Manufacturing : Revenue ¥34.8 billion (+9.0% YoY), Operating Profit ¥4.5 billion (+0.1% YoY, Operating Profit Margin 12.9%). The manufacturing segment is expected to maintain a high profit margin (12.9%).
- Trading : Revenue ¥92.9 billion (▲0.1% YoY), Operating Profit ¥3.7 billion (+13.9% YoY, Operating Profit Margin 3.9%). The trading segment plans for a significant profit increase despite a slight decline in revenue, through the rationalization of unprofitable transactions and a shift toward high-margin products.
Full-Year Operating Profit Scenario (Previous Year ¥6.5 billion → Current Year ¥7.0 billion: +¥0.5 billion)
- Elimination of Prior-Year One-Time Factors (▲¥0.8 billion) : Incorporates the risk of the disappearance of temporary positive factors recorded in the previous year.
- Growth in Core Manufacturing Profit (+¥1.1 billion) : Profit contribution from the growth of HDD-related equipment and automation equipment.
- Growth in Core Trading Profit (+¥0.2 billion) : Expansion of data center peripheral components.
- Head Office Expenses, etc. (±¥0 billion) : A plan to reach an operating profit of ¥7.0 billion for the full year while maintaining overall balance.
8. Quarterly Performance Trends (Appendix Data Analysis)
Reviewing the quarterly trend data in the earnings appendix clarifies the company's growth momentum.
- Revenue Trend : After a temporary dip from ¥29.9 billion in Q1 FY2025 to ¥29.1 billion in Q1 FY2026, revenue recovered steadily through Q2 (¥30.4 billion), Q3 (¥30.9 billion), and Q4 (¥32.4 billion). In Q1 FY2027, it reached ¥34.5 billion , recording the highest revenue level in recent quarters.
- Operating Profit Trend : Bottoming out at ¥0.8 billion in Q1 FY2026, profit recovered rapidly to ¥2.0 billion in Q2 and ¥2.1 billion in Q3. Q1 of this year also maintained a high profit level of ¥2.1 billion .
These quarterly trends confirm that the structural reforms promoted by the company have aligned with the structural demand expansion of AI and data centers, elevating the company's performance to a new stage .
9. Macro Environment, Risk Factors, and Mid-to-Long-Term Growth Measures
The materials also indicate the company's current recognition of the external environment and risks:
- Geopolitical Risks : The company states that no direct impact of the Middle East situation on performance is recognized at this time . However, indirect effects, such as preemptive buying demand in anticipation of rising raw material prices, require close monitoring.
- Component Procurement Risks : It is reported that no serious impact from the tightness of rare earths and semiconductor materials in the automotive sector has materialized at this time .
- Optimization of Production Bases (Structural Reform) : The restructuring of the manufacturing system to strengthen cost competitiveness and diversify geopolitical risks is proceeding steadily, including the transfer of filter production to Thailand (scheduled for completion within the year) and preparations for the operation of a new factory for alignment film printing plates in China .
10. Conclusion: The Growth Story of the Kuroda Group
In short, the Q1 FY2027 earnings can be described as "a strong performance that successfully converted the special demand from generative AI and data centers into actual results."
Beyond simply riding the wave of demand, the results clearly demonstrate the success of the company's own initiatives—such as structural reforms like the transfer to Thailand in the manufacturing segment, a shift toward profit-oriented operations in the trading segment, and the strengthening of sales for high-value-added automation equipment and various components—resulting in a dramatic rise in the operating profit margin to 6.2%.
The progress rate against the full-year plan (operating profit of ¥7.0 billion, annual dividend of ¥63) is very high. The steady performance of HDD components for data centers and semiconductor-related materials, along with the progress of structural reforms in each business, are expected to be key factors supporting the company's sustainable corporate value enhancement.
This content is not intended as investment advice or a recommendation. Any opinions expressed are solely the personal views of each article.