


Earnings Deep-Dive Report: Akebono Brake Industry Q1 FY2027 Results and the Fruits of Business Structural Reform

StockClub
Published: Aug 06, 2026, 11:07 AM
Sentiment Analysis
Akebono Brake Industry’s financial results for the first quarter of the fiscal year ending March 2027 (covering January to June 2026, with variations by region) show that while net sales declined year-on-year, operating profit remained stable, and the company successfully turned a net profit. Amid a complex interplay of structural reforms in the North American business, price pass-throughs, and foreign exchange impacts, we provide a detailed analysis of the company's current business environment and the transformation of its profit structure through 10 key topics.
1. Consolidated Financial Highlights: Revenue Decline Met with Steady Bottom-Line Recovery
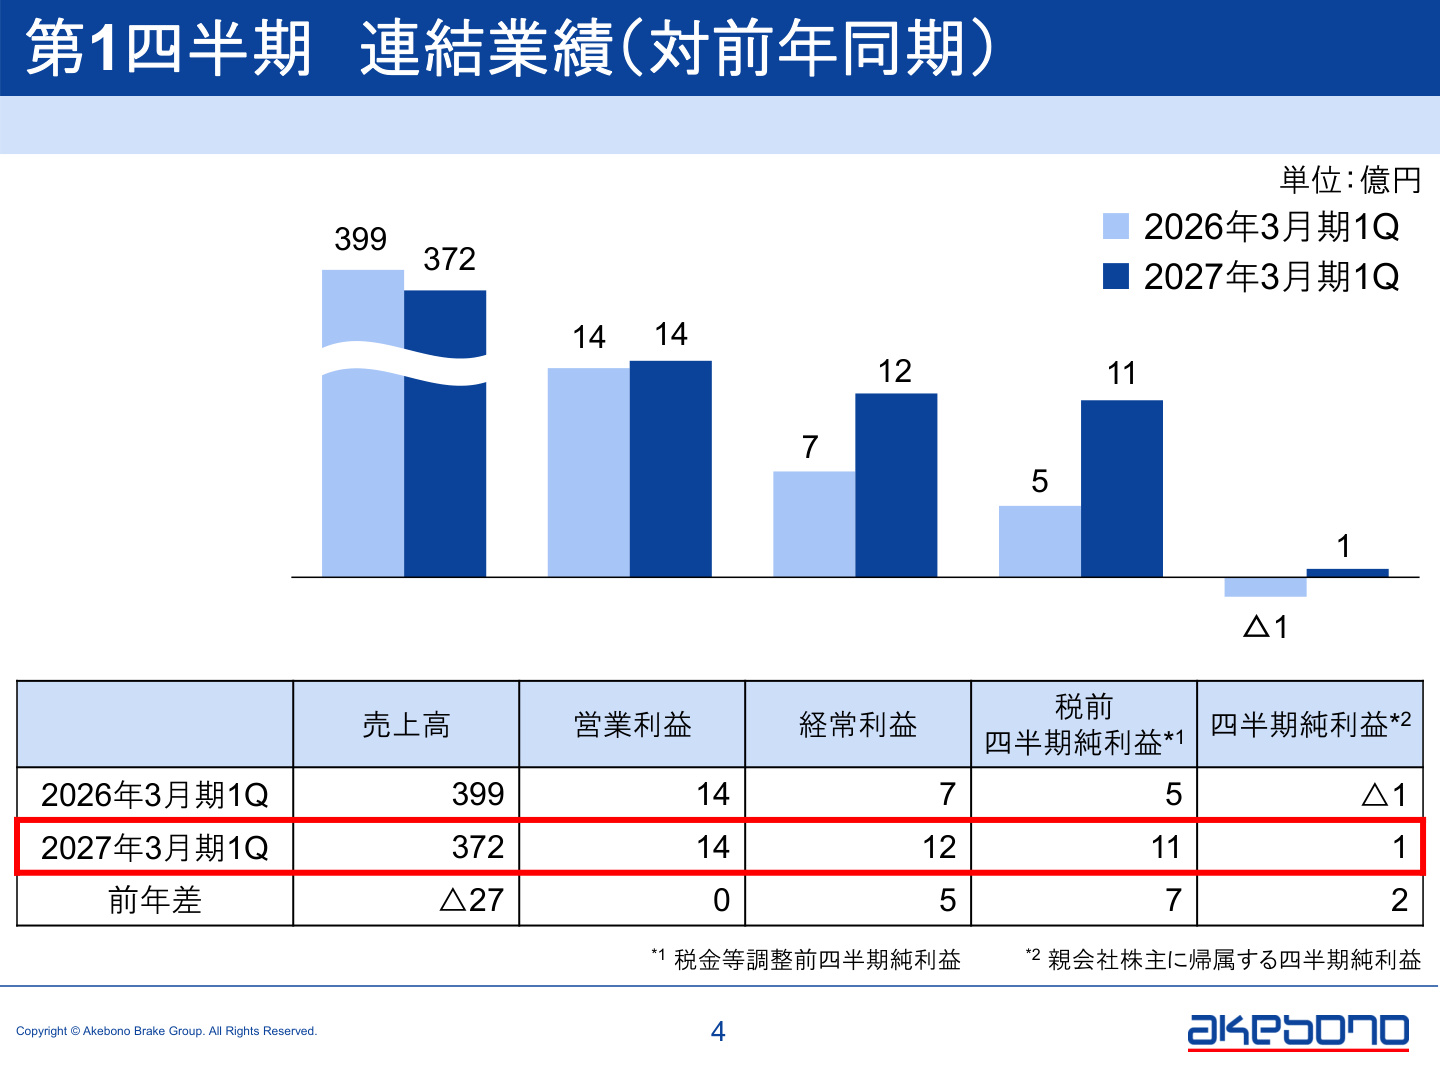
Consolidated results for the first quarter were as follows: net sales of 37.2 billion yen (down 2.7 billion yen, or 6.8% YoY) , operating profit of 1.4 billion yen (flat YoY) , ordinary profit of 1.2 billion yen (up 0.5 billion yen, or 71.4% YoY) , and net profit attributable to owners of the parent of 0.1 billion yen (compared to a 0.1 billion yen loss in the same period last year).
[Significance and Background of the Slide Above]
This slide provides an at-a-glance overview of the quarter, highlighting the most critical aspect of these results: the shift in profit structure characterized by "maintaining operating profit despite lower sales, and achieving a turnaround to net profit." While sales declined due to factory consolidation in North America, the significant improvement in ordinary profit (from 0.7 billion to 1.2 billion yen) and net profit (from -0.1 billion to +0.1 billion yen) serves as evidence that the series of business structural reforms is beginning to bear fruit.
2. Sales Analysis: Production Adjustments Linked to U.S. Single-Plant Consolidation
The primary factor behind the 2.7 billion yen year-on-year decline in net sales was the reduction in production volume associated with the consolidation of U.S. operations into a single plant. This impact pushed sales down by 4.7 billion yen. Conversely, while fluctuations in orders outside North America contributed +0.3 billion yen , price revisions and fluctuations added +0.6 billion yen , and the weaker yen provided a +1.1 billion yen boost, these were insufficient to fully offset the decline in the U.S., resulting in an overall decrease in revenue.
3. Operating Profit Analysis: Offsetting Cost Increases with Structural Reform Gains
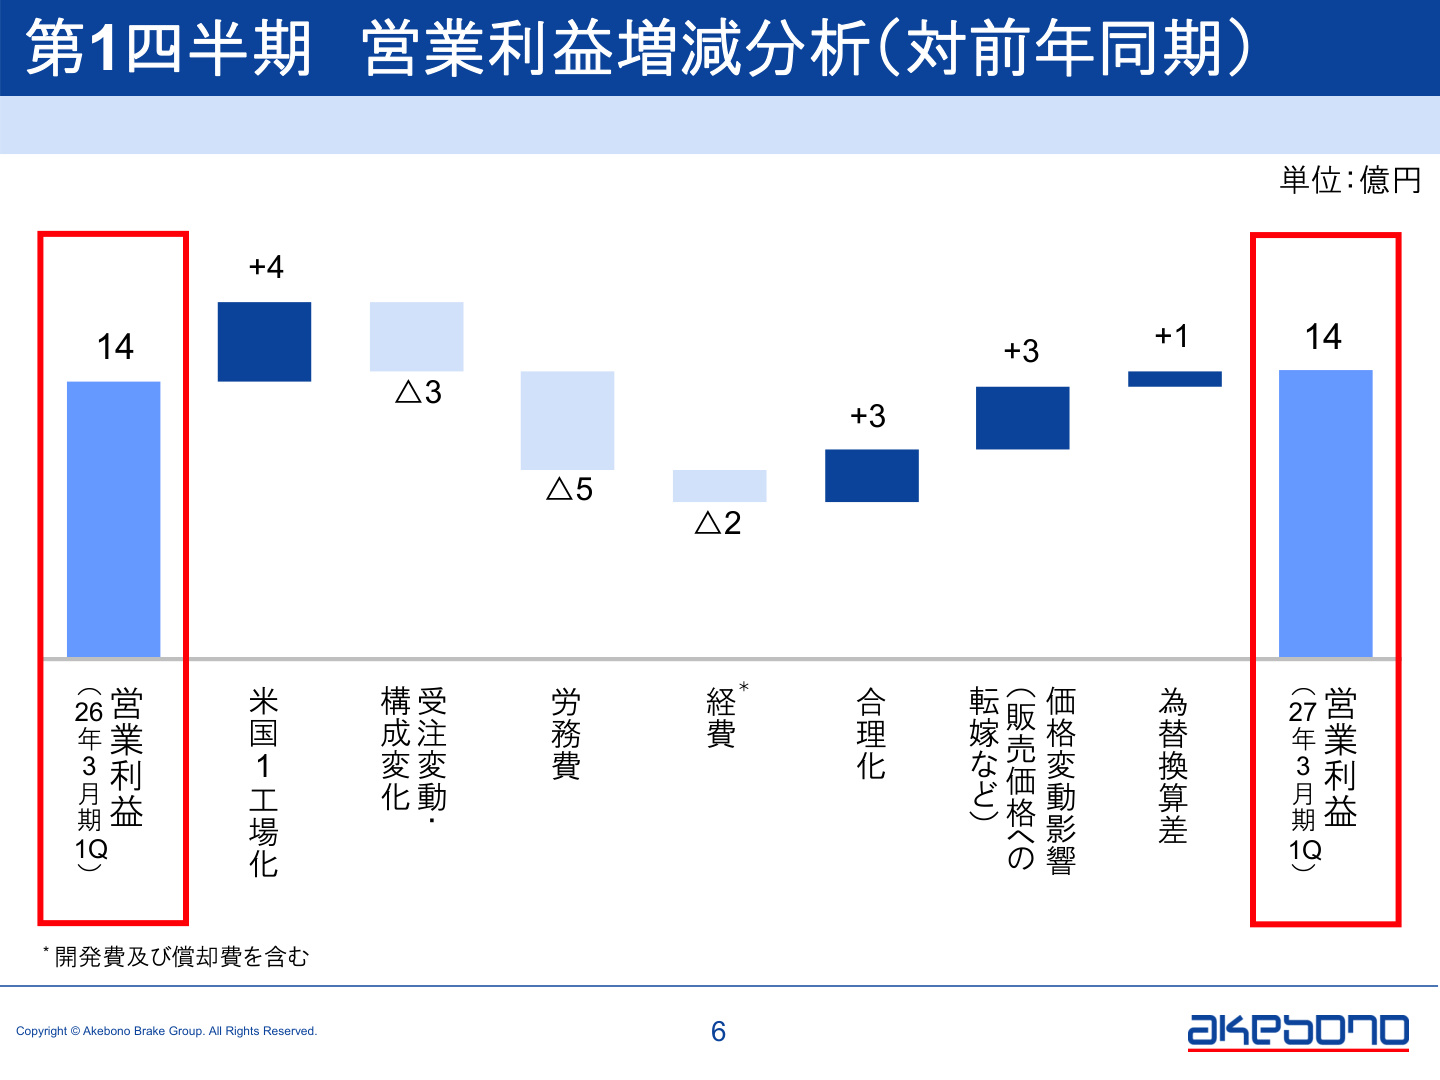
The ability to maintain an operating profit of 1.4 billion yen despite falling sales is rooted in clear profit-improvement factors. The largest contributor was the improvement in fixed costs and capacity utilization resulting from the U.S. single-plant consolidation (+0.4 billion yen). In addition, rigorous rationalization efforts (+0.3 billion yen) , price pass-throughs to counter rising raw material costs (+0.3 billion yen), and foreign exchange translation differences (+0.1 billion yen) all contributed positively.
[Significance and Background of the Slide Above]
This waterfall chart of operating profit changes clearly illustrates the company's scenario for recovering its core earning power. Despite facing intense cost-push factors such as increased labor costs (-0.5 billion yen), order fluctuations/mix changes (-0.3 billion yen), and increased expenses (-0.2 billion yen), the structure shows how these were fully offset by internal efforts: "U.S. single-plant consolidation (+0.4 billion yen)," "rationalization (+0.3 billion yen)," and "price pass-throughs (+0.3 billion yen)."
4. Regional Trends ① Japan: Strong OEM Demand Offset by Lower Aftermarket Sales and Rising Costs
Net sales in the Japanese market remained solid at 15.7 billion yen (up 0.2 billion yen YoY). Despite negative factors such as the discontinuation of certain vehicle models and the transfer of production for high-performance mass-production vehicles, the continued effect of price revisions implemented in the previous term and strong orders from certain automakers contributed to the results. However, operating profit declined to 0.4 billion yen (down 0.3 billion yen YoY). The main reasons were a change in sales mix due to a decline in orders for high-margin aftermarket products , as well as soaring energy costs and increased labor expenses that outweighed productivity improvement efforts.
5. Regional Trends ② North America (U.S. & Mexico): Site Consolidation and Narrowing Losses
North America remains the primary theater for the company's structural reforms.
- U.S. : Net sales fell significantly to 6.8 billion yen (down 4.2 billion yen YoY) , but operating profit improved to -0.1 billion yen (an improvement of 0.4 billion yen) , significantly narrowing the deficit. Although the impact of lower orders due to the single-plant consolidation was felt, the effects of structural reforms, such as personnel optimization and expense reduction, are steadily emerging.
- Mexico : Net sales reached 3.1 billion yen (up 0.6 billion yen YoY) , and operating profit was 0.1 billion yen (up 0.1 billion yen YoY). In addition to the weak yen and increased orders for certain models, the ability to recover previous-term raw material price hikes through pricing in this quarter contributed to the results. Overall, while North America saw a significant decline in revenue, substantial progress toward achieving an operating profit is evident.
6. Regional Trends ③ ASEAN: Top-Line Growth and New Plant Relocation Costs
The ASEAN region (Thailand, Indonesia, Vietnam) is driving growth. Total sales in ASEAN expanded to 8.5 billion yen (up 0.7 billion yen YoY).
- Thailand : Increased revenue and profit due to higher orders for OEM products and the weak yen.
- Indonesia : Revenue increased due to higher orders from Japanese manufacturers, but profit declined due to rising labor costs (wage hikes) and temporary expenses associated with the relocation to a new plant.
- Vietnam : Increased revenue and profit due to a recovery in orders for motorcycle products. Overall operating profit for the region was 0.8 billion yen (flat YoY) , but this is a region where we can expect improved profitability once temporary expenses subside.
7. Regional Trends ④ China & Europe: Maintaining Profitability in Challenging Environments
- China : Net sales were 2.7 billion yen (flat YoY) , and operating profit was 0.1 billion yen (down 0.1 billion yen YoY). Despite an increase in orders for friction materials and the weak yen, the decline in orders from Chinese automakers had a significant negative impact.
- Europe : Net sales were 2.5 billion yen (down 0.1 billion yen YoY) , and operating profit was 0.0 billion yen (flat YoY). Despite the impact of production ends due to model changes, the company maintained profitability through thorough personnel optimization and expense reduction in line with production volumes.
8. Factors Affecting Ordinary and Net Profit: FX Gains and Reduced Structural Reform Costs
Regarding non-operating and extraordinary income/losses, the improvement in foreign exchange gains/losses and the reduction in business structural reform expenses contributed significantly to the bottom line.
- Foreign exchange losses of 0.3 billion yen in the same period last year turned into 0.3 billion yen in foreign exchange gains this quarter (a net improvement of 0.6 billion yen) , pushing ordinary profit to 1.2 billion yen.
- The burden associated with the end of OEM production at the Elizabethtown plant in the U.S. decreased, leading to a 0.2 billion yen reduction in business structural reform expenses (-0.2 billion yen to 0.0 billion yen).
- On the other hand, although deferred tax adjustments worsened by 0.5 billion yen due to the recording of deferred tax liabilities, the company secured a net profit of 0.1 billion yen (an improvement of 0.2 billion yen YoY).
9. Financial Foundation and Cash Flow: Generating Stable Free Cash Flow
The financial position remains robust. Total assets increased by 1.7 billion yen from the end of the previous fiscal year to 130.5 billion yen , and net assets stood at 57.3 billion yen. The equity ratio is 39.0% (39.2% at the end of the previous term), and the net D/E ratio is 0.33x (0.34x at the end of the previous term), maintaining a sound financial structure. In terms of cash flow, cash flow from operating activities was +2.6 billion yen , exceeding investment cash flow (e.g., capital expenditures) of -2.0 billion yen, resulting in a positive free cash flow of +0.6 billion yen. Cash and cash equivalents increased from 18.1 billion yen at the end of the previous term to 19.0 billion yen.
10. Customer Portfolio and Product Diversification Strategy: Risk Mitigation and High Value-Added Focus
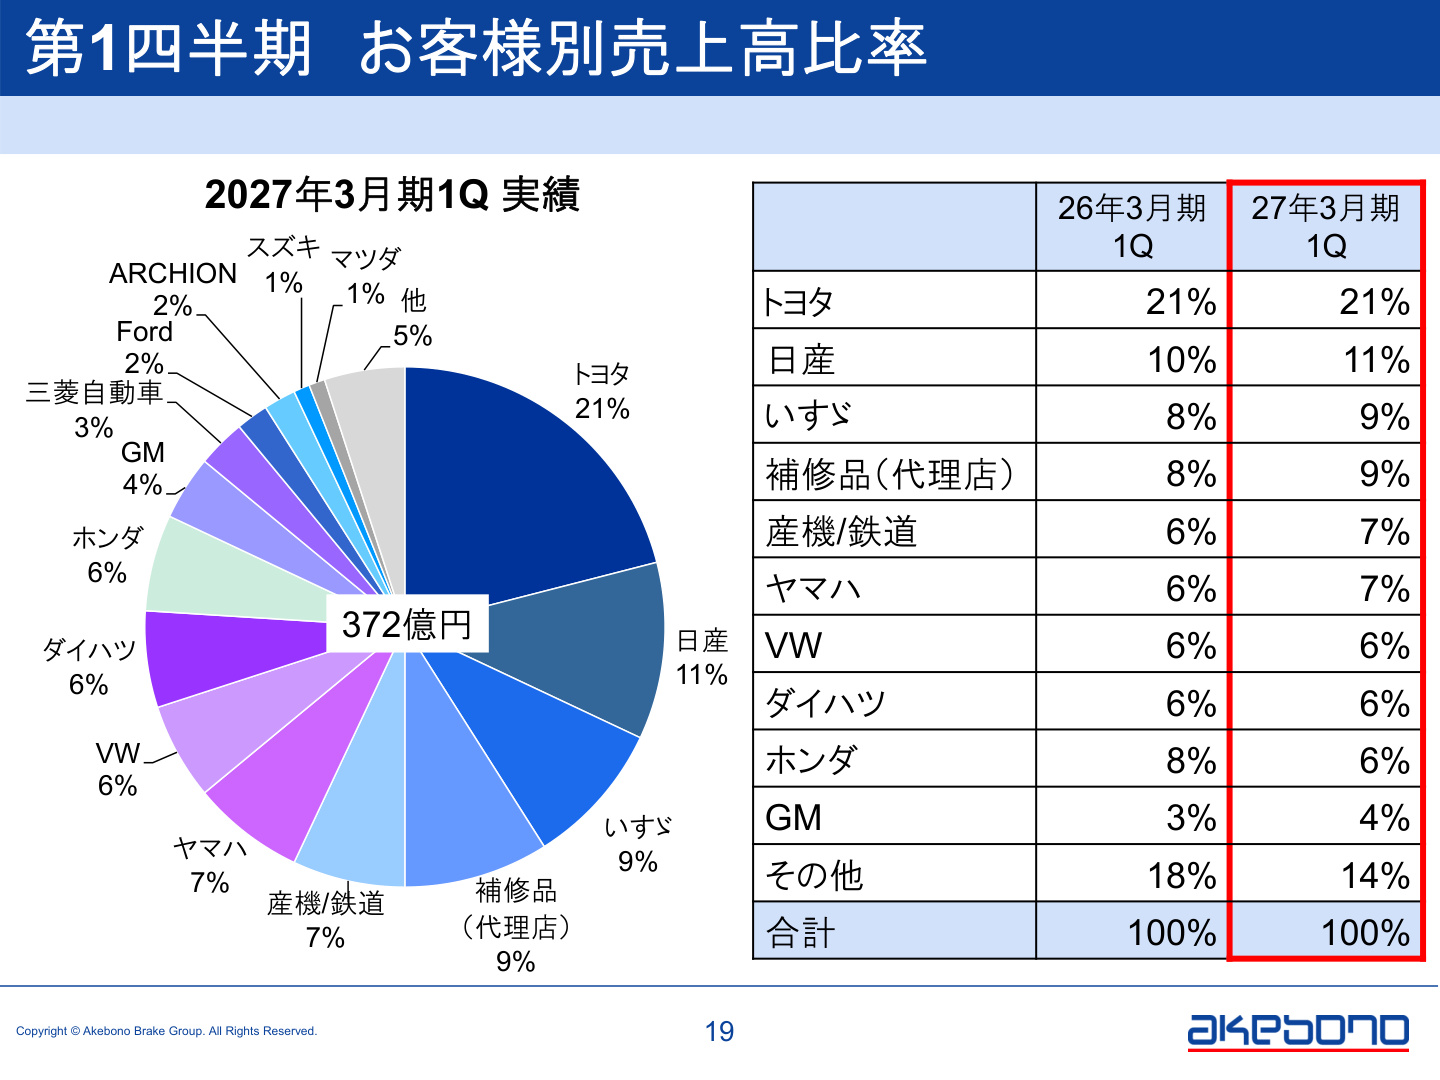
The customer portfolio in the company's sales composition has evolved into a balanced structure that does not rely excessively on any single automaker.
[Significance and Background of the Slide Above]
This slide illustrates the company's management of customer concentration risk and the composition of its growth assets. While major OEMs account for a significant share— Toyota Group at 21% , Nissan at 11% , and Isuzu at 9% —high-margin, stable sectors such as aftermarket products (9%) , industrial machinery/railway vehicles (7%) , and Yamaha (motorcycle-related, etc., 7%) steadily account for a portion of the business. The strategy of mitigating production volume risks associated with specific automakers while supporting earnings through a diversified portfolio including railways and industrial machinery is clearly visualized.
Summary: Overview of Performance and Outlook
Akebono Brake Industry's Q1 FY2027 results can be evaluated as "a quarter where the fruits of business structural reforms, starting with the U.S. single-plant consolidation, have steadily begun to appear in the profit and loss statement." The contraction in the top line is largely a planned aspect of structural reform, and the company is successfully transforming into a structure capable of securing operating profit even in an inflationary environment through fixed cost reductions and thorough price pass-throughs.
Moving forward, the resolution of temporary factors such as new plant relocation costs in the ASEAN market, further expansion of products for industrial machinery and railways, and the timing of achieving full profitability in the North American business will be key factors for further profitability improvements.
This content is not intended as investment advice or a recommendation. Any opinions expressed are solely the personal views of each article.