


Shibaura Mechatronics Q1 FY2027 Earnings Analysis: Historic Order Surge Driven by Generative AI and Future Growth Strategy

StockClub
Published: Aug 06, 2026, 10:58 AM
Sentiment Analysis
Shibaura Mechatronics (Securities Code: 6590) reported its Q1 FY2027 (April-June 2026) financial results , which, despite temporary delays in revenue recognition due to delivery schedule adjustments in front-end processes, demonstrated robust strength with a massive expansion in orders, reaching 52 billion yen in quarterly orders (up 191% YoY) . The surge is primarily driven by explosive demand for generative AI, leading to a sharp increase in orders for semiconductor back-end (advanced packaging) equipment, which is strongly propelling the company's future performance.
This report extracts 10 key topics from the disclosed financial materials to provide a detailed analysis of the company's current status and its mid-to-long-term growth story.
1. Q1 Highlights: Temporary Revenue/Profit Adjustment vs. Explosive Order Growth
Consolidated financial results for the first quarter were as follows: Net Sales of 20 billion yen (down 7% YoY) , Operating Profit of 2.9 billion yen (down 30% YoY) , Ordinary Profit of 2.9 billion yen (down 28% YoY) , and Net Income attributable to owners of the parent of 1.9 billion yen (down 33% YoY) .
While the results appear to show a decline in both revenue and profit, a closer examination reveals that the "quality" of the performance remains exceptionally high. The primary cause for the decline is the deferral of revenue recognition to Q2 and beyond, resulting from customer investment plan reviews and delivery schedule changes in semiconductor front-end processes , rather than a contraction in demand. Conversely, orders received jumped to 52 billion yen (up 191% YoY) , nearly triple the level of the previous year, with the backlog—the foundation for future revenue—accumulating to 80.3 billion yen as of the end of June 2026 .
The following table compares performance trends against the same period last year and previous quarters.
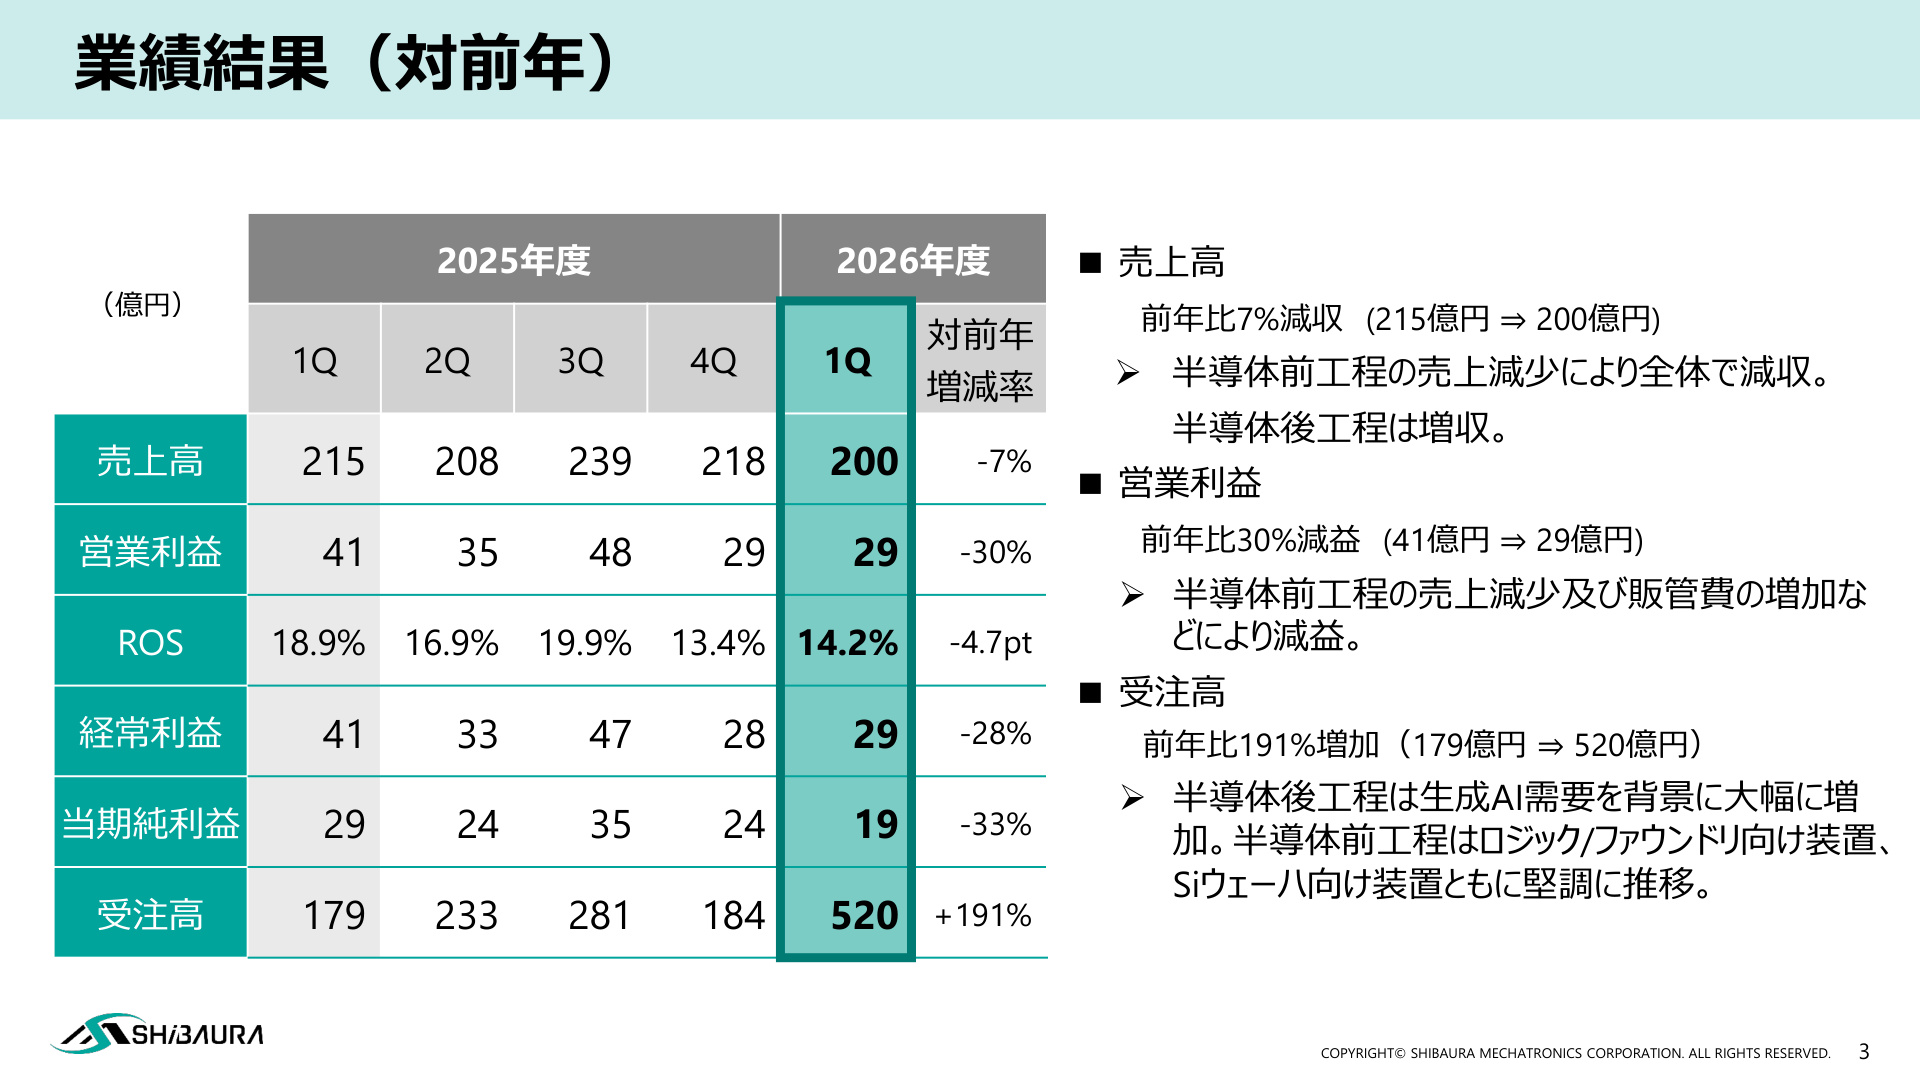
[Background and Significance of Slide 2]
This performance trend table symbolizes the contrast between the "revenue recognition time lag" and the "explosive growth in orders" for this quarter. While net sales decreased from 21.5 billion yen in the same period last year to 20 billion yen, and the Return on Sales (ROS) dropped by 4.7 percentage points from 18.9% to 14.2%, the growth in orders received (from 17.9 billion yen to 52 billion yen, +191%) is outstanding. This clearly indicates that the company is currently in a preparation phase for manufacturing and delivery to meet explosive demand, rather than experiencing a stagnation.
2. Segment Analysis ①: Mechatronics Systems Division (Leap in Back-end Processes)
The Mechatronics Systems Division , which oversees semiconductor back-end, FPD back-end, and vacuum application equipment, significantly boosted performance this quarter.
- Net Sales : 10.4 billion yen (up 22% YoY)
- Segment Profit : 3.1 billion yen (up 29% YoY)
- Orders Received : 37.1 billion yen (up 367% YoY)
Demand for advanced packaging equipment, particularly for generative AI GPUs , has been intense, causing segment orders to surge more than 4.6 times from 8.0 billion yen in the same period last year to 37.1 billion yen. The technical superiority and product lineup strength in this back-end field have become the company's new growth engine.
3. Segment Analysis ②: Fine Mechatronics Division (Front-end Process Adjustments)
The performance of the Fine Mechatronics Division , responsible for semiconductor and FPD front-end processes, is as follows:
- Net Sales : 8.7 billion yen (down 26% YoY)
- Segment Profit/Loss : -0.1 billion yen (compared to a 1.7 billion yen profit in the same period last year)
- Orders Received : 14.0 billion yen (up 61% YoY)
The decline in sales and the operating loss are temporary phenomena caused by the shift of delivery and revenue recognition for certain equipment to Q2 and beyond due to customer investment schedule adjustments, combined with increased SG&A expenses such as R&D and personnel costs for future growth. Orders themselves showed a solid recovery and expansion trend at 14.0 billion yen (up 61% YoY) , centered on equipment for logic/foundries and silicon wafers.
4. Focus on SPE (Semiconductor Production Equipment) and GNT Product Strength
Looking at the sales and order structure by business field, the company's reliance on and superiority in SPE (Semiconductor Production Equipment) becomes even clearer.
SPE sales for this quarter reached 17.9 billion yen, accounting for 89% of total sales. Of this, sales of GNT (Global Niche Top) products , where the company holds a competitive edge, reached 12.2 billion yen (68% of SPE sales). As FPD (display) equipment sales dropped to 2% (0.4 billion yen) of the total due to market sluggishness, the concentration of resources on the SPE field has proven highly successful.
In terms of orders, the prominence of the SPE field is even more striking. The following graph shows the trend in orders by field.
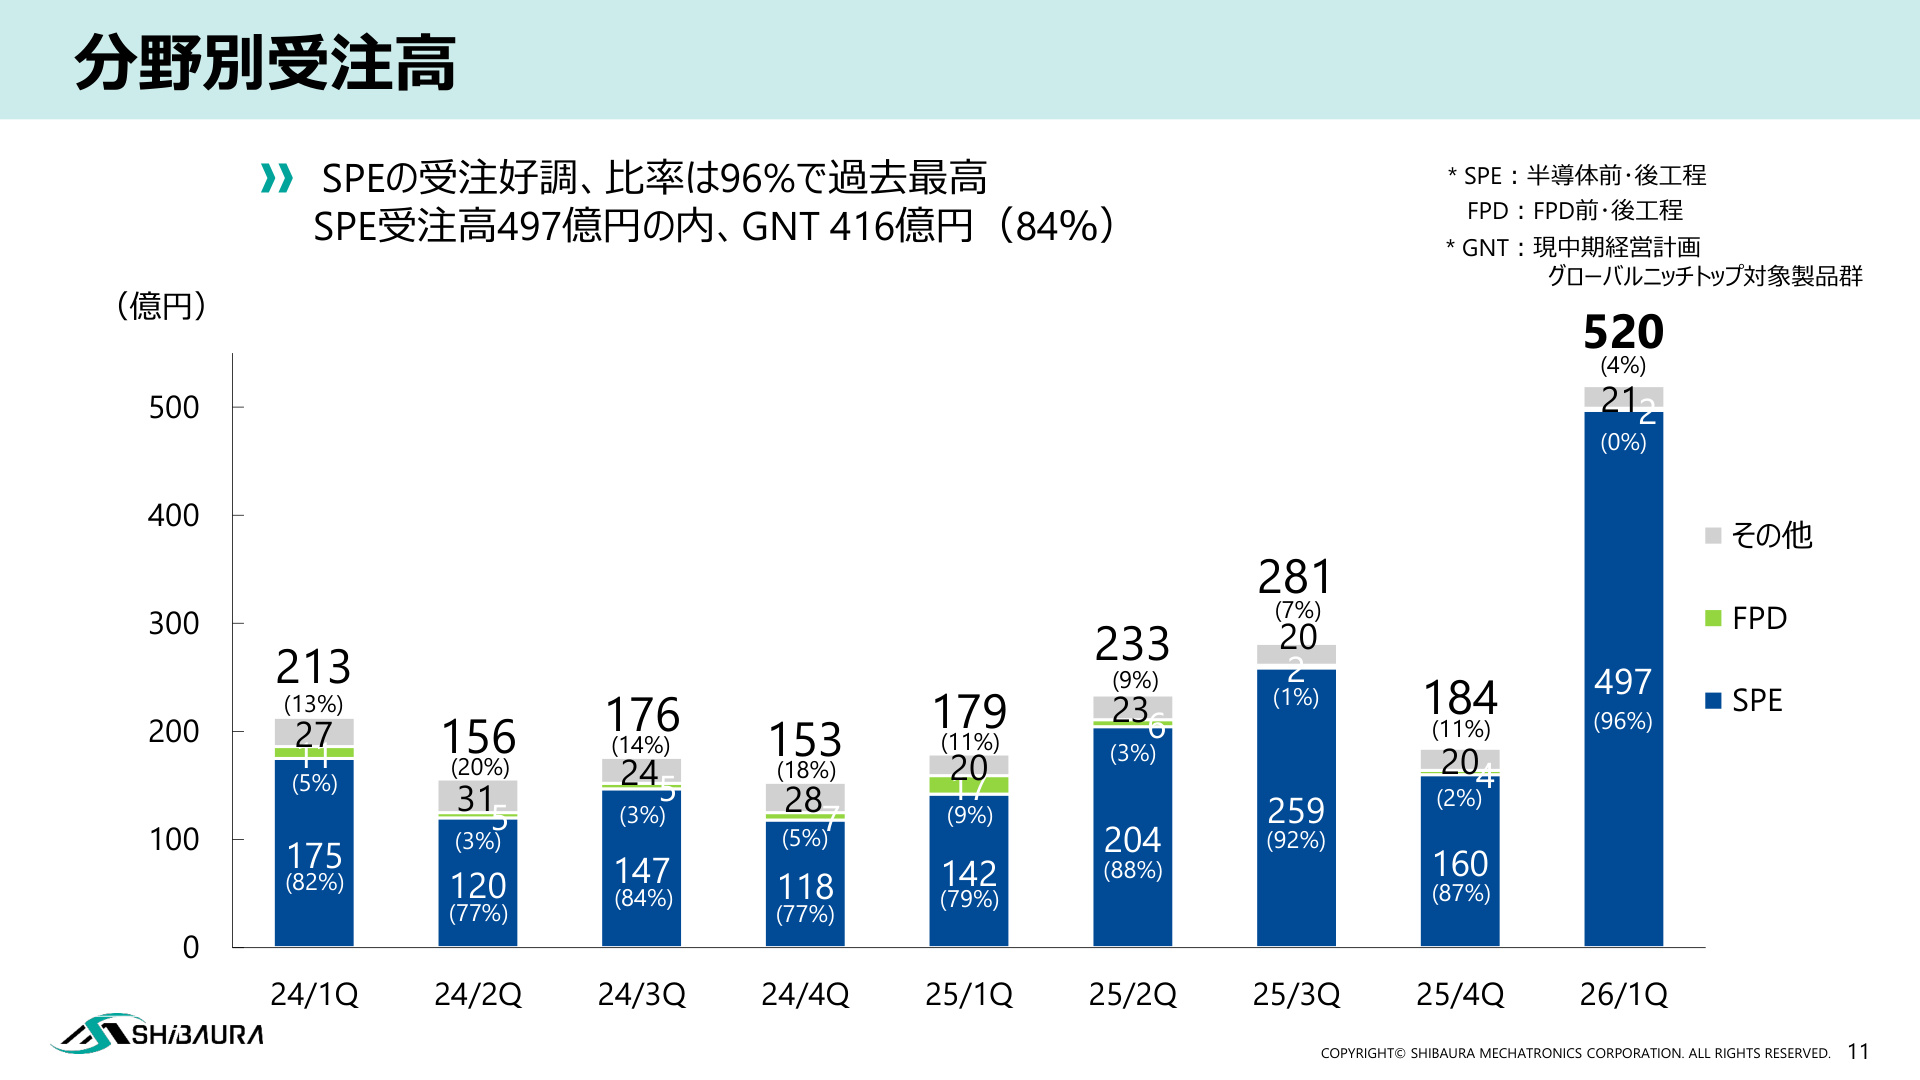
[Background and Significance of Slide 10]
This graph is critical data showing that Shibaura Mechatronics' business portfolio has completely shifted to an SPE-led model . Of the 52 billion yen in total orders this quarter, SPE orders reached 49.7 billion yen (96% of the total, a record high) . Furthermore, GNT products accounted for 41.6 billion yen (84% of SPE orders) . This is evidence that the company's proprietary cleaning, surface treatment, and bonder technologies have secured an indispensable position in the global advanced semiconductor supply chain.
5. Regional Trends: Concentration of Demand in the Taiwan Market
Regional trends in orders and sales highlight where global advanced semiconductor investments are concentrated.
Overseas sales accounted for 79% of total sales this quarter (Taiwan 51%, China 22%). Furthermore, the overseas ratio in orders received rose to 89% . The following graph shows the proportion of orders by region.
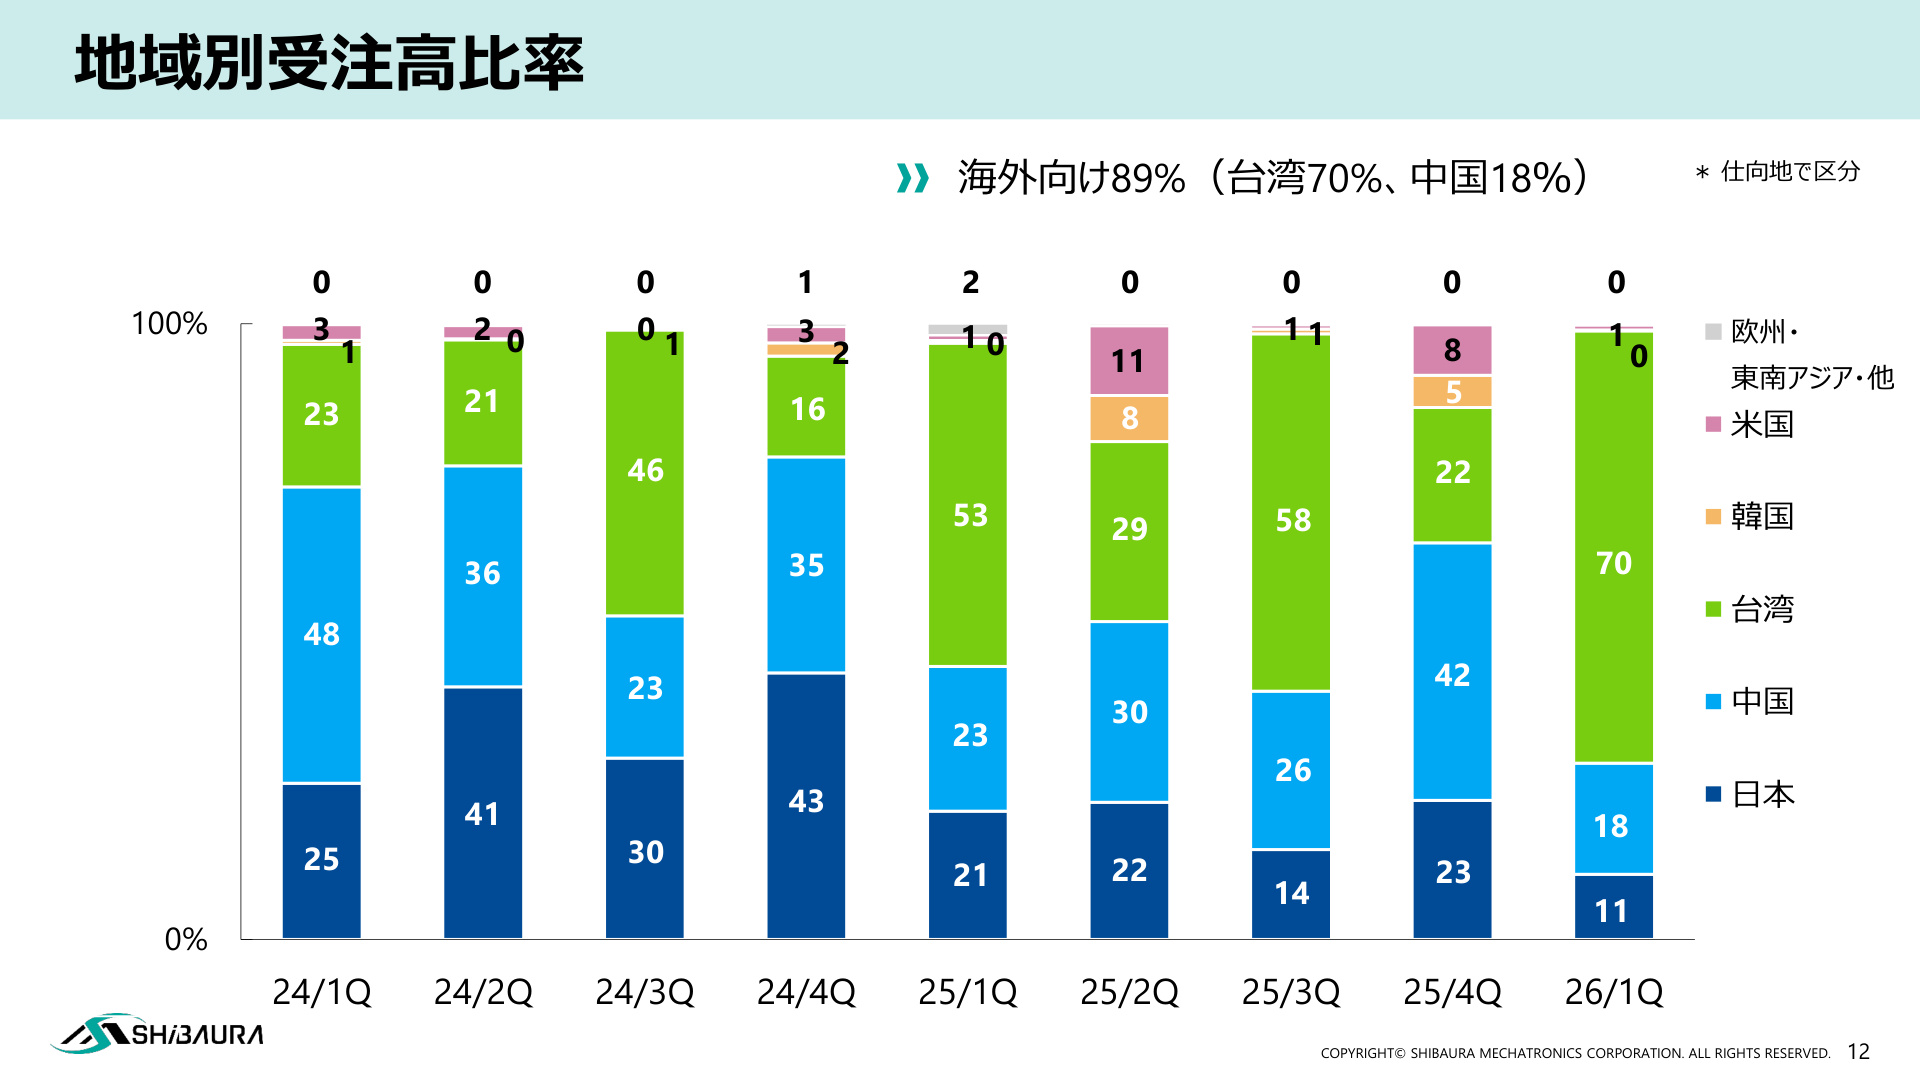
[Background and Significance of Slide 11]
Slide 11 shows a dramatic shift in the regional ratio of orders. The order ratio for Taiwan jumped to 70% (approximately 36.4 billion yen) this quarter. This directly reflects aggressive capital investment in advanced packaging (such as CoWoS) and cutting-edge logic lines, primarily by the world's largest foundries. Compared to previous quarters, the ratio for Taiwan is outstanding, indicating that the company's advanced equipment is deeply embedded in the core of the global cutting-edge semiconductor ecosystem.
6. Key Topics and Progress in Next-Generation Technology Development
The disclosure materials highlight the following five points as technology and product topics that support future growth:
- Advanced Packaging Equipment (Back-end) : Strong inquiries and orders continue, centered on generative AI GPU applications.
- Wet Processing Equipment for PLP (Panel Level Packaging) : Development for mass production continues for PLP, which is attracting attention as a next-generation semiconductor packaging technology (deployment of the "PD-Series," etc.).
- Single-Wafer Phosphoric Acid Etching Equipment (Front-end) : Continues to see strong inquiries from customers, showing steady performance.
- Single-Wafer Si Wafer Cleaning Equipment (Front-end) : Inquiries are on an upward trend, raising expectations for further market recovery.
- Equipment for Masks (Front-end) : Inquiries for both etching and cleaning equipment are increasing from mask manufacturers and others.
In both front-end and back-end processes, the product lineup aligned with cutting-edge market trends is successfully securing inquiries.
7. Financial Soundness and Balance Sheet
The financial foundation supporting expanding orders and increased production capacity is solid.
- Total Assets : 95.7 billion yen (slightly down from 100.9 billion yen at the end of the previous fiscal year)
- Equity Ratio : Improved from 55.1% at the end of the previous fiscal year to 56.0%
- D/E Ratio : Maintained an extremely low debt dependency of 0.16x
- Net Assets : 53.6 billion yen
In current assets, the company has secured 24.7 billion yen in cash and deposits, and inventories stand at 14.3 billion yen, reflecting preparations of work-in-progress and raw materials for future shipments. The financial health is high, providing sufficient liquidity to smoothly proceed with future growth investments, capital expenditures, and R&D.
8. Full-Year Earnings Forecast and Outlook
The company has maintained its full-year earnings forecast for FY2026 (ending March 2027) , which was announced in May 2026.
- Net Sales : 99.0 billion yen (up 12.5% YoY)
- Operating Profit : 16.0 billion yen (up 4.6% YoY)
- ROS (Return on Sales) : 16.2%
- Net Income : 11.9 billion yen (up 6.3% YoY)
- ROE (Return on Equity) : 20.2%
While the progress rate for Q1 net sales is approximately 20.2% and operating profit is approximately 18.1% against the full-year forecast, considering the staggering 52 billion yen in orders and the 80.3 billion yen backlog , it is highly probable that the company will remain on track to achieve its full-year plan as equipment deliveries and inspections (revenue recognition) proceed from Q2 onwards.
Summary
Shibaura Mechatronics' Q1 FY2027 results reveal that behind the "superficial figures" of a temporary decline in revenue and profit due to timing differences, there is a clear structural increase in demand driven by the generative AI revolution (52 billion yen in quarterly orders, 96% SPE ratio) . Armed with a solid financial foundation and high technical superiority (GNT product group), the company is advancing to a new stage of growth.
This content is not intended as investment advice or a recommendation. Any opinions expressed are solely the personal views of each article.